

Evaluation of Bayesian Linear Regression derived gene set test methods
- PMID: 39716056
- PMCID: PMC11667926
- DOI: 10.1186/s12864-024-11026-2
Evaluation of Bayesian Linear Regression derived gene set test methods
Abstract
Background: Gene set tests can pinpoint genes and biological pathways that exert small to moderate effects on complex diseases like Type 2 Diabetes (T2D). By aggregating genetic markers based on biological information, these tests can enhance the statistical power needed to detect genetic associations.
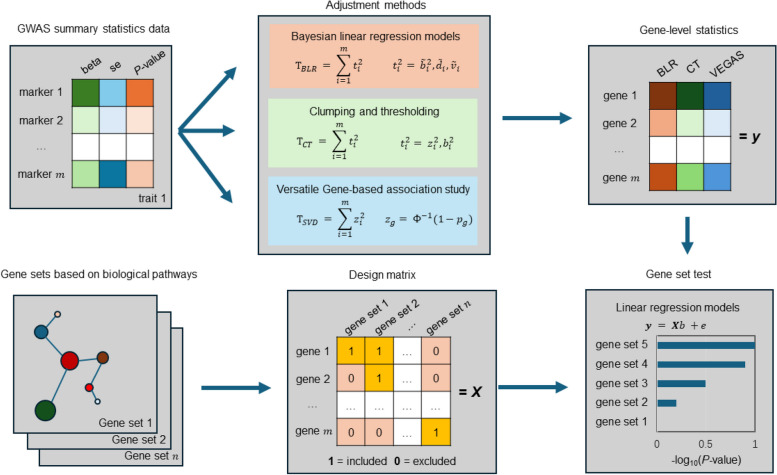
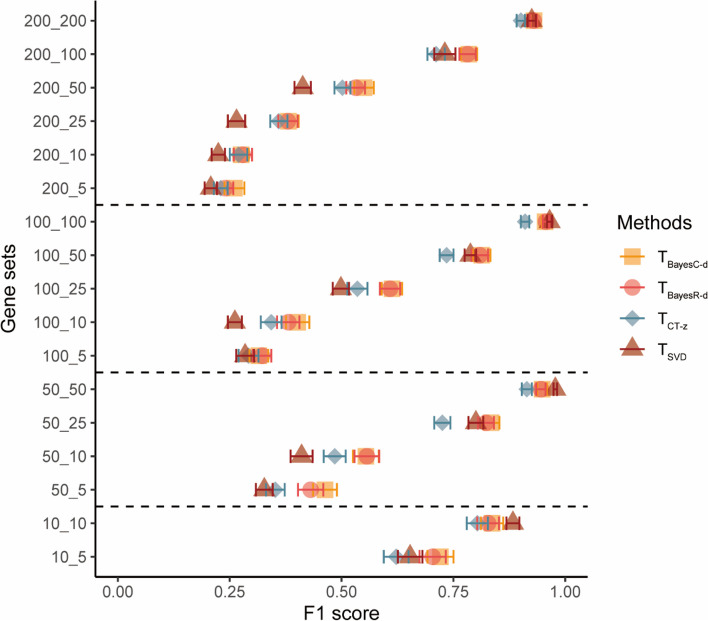
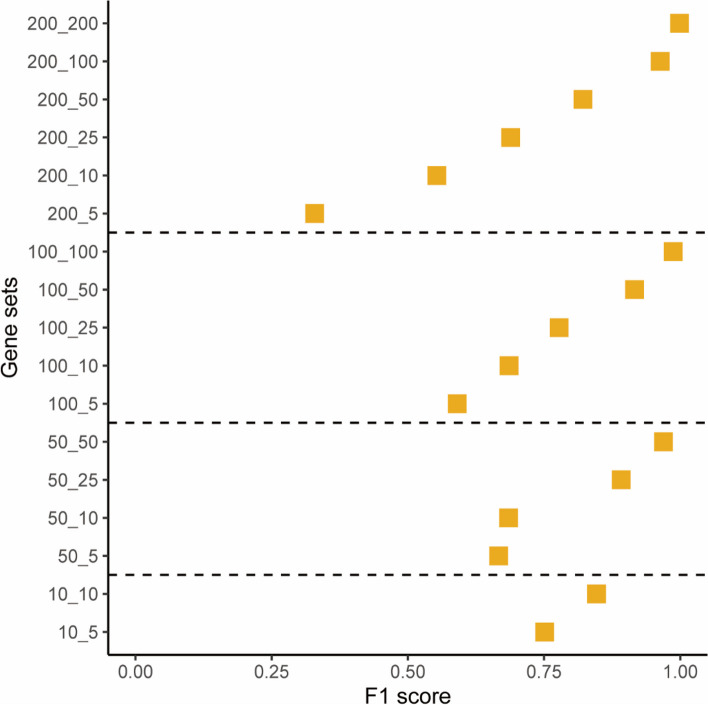
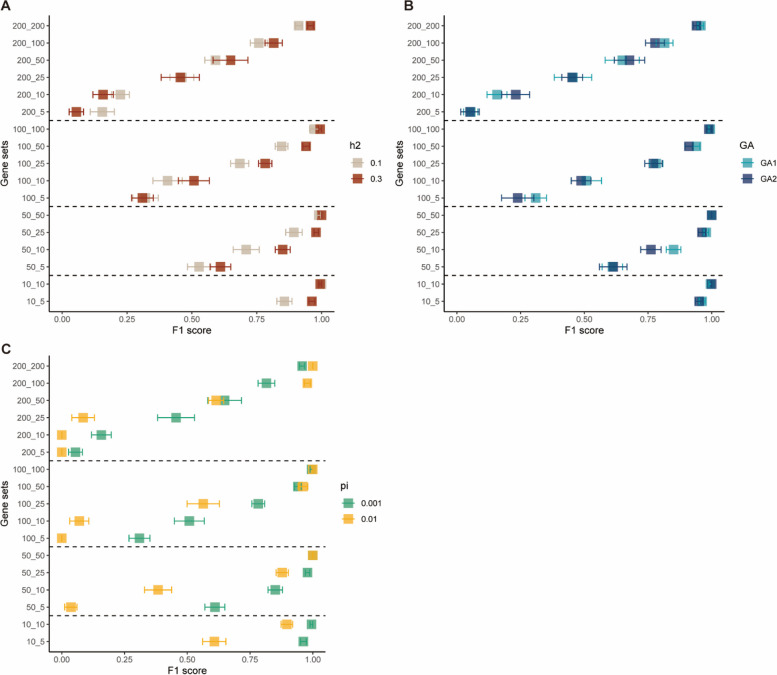
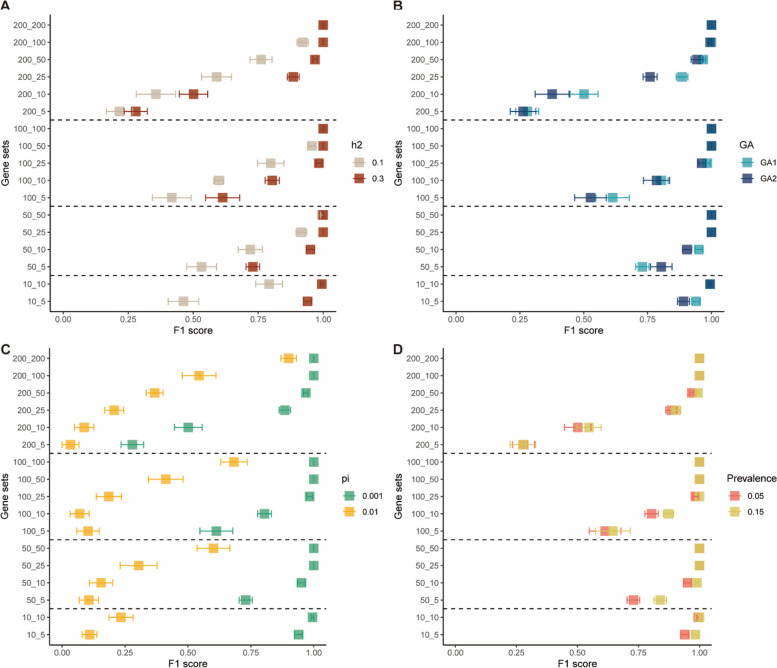
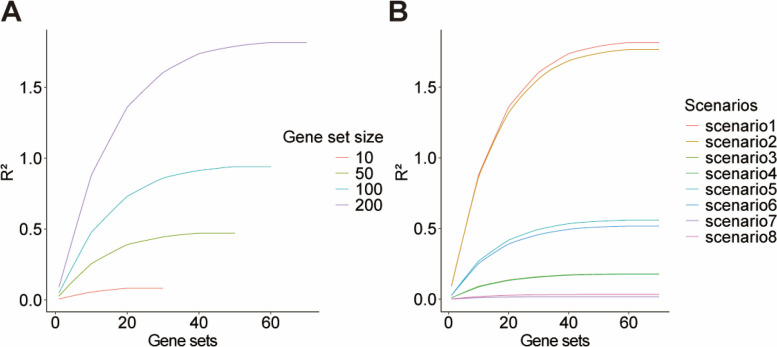
Results: Our goal was to develop a gene set test utilizing Bayesian Linear Regression (BLR) models, which account for both linkage disequilibrium (LD) and the complex genetic architectures intrinsic to diseases, thereby increasing the detection power of genetic associations. Through a series of simulation studies, we demonstrated how the efficacy of BLR derived gene set tests is influenced by several factors, including the proportion of causal markers, the size of gene sets, the percentage of genetic variance explained by the gene set, and the genetic architecture of the traits. By using KEGG pathways, eQTLs, and regulatory elements as different kinds of gene sets with T2D results, we also assessed the performance of gene set tests in explaining more about real phenotypes.
Conclusions: Comparing our method with other approaches, such as the gold standard MAGMA (Multi-marker Analysis of Genomic Annotation) approach, our BLR gene set test showed superior performance. Combining performance of our method in simulated and real phenotypes, this suggests that our BLR-based approach could more accurately identify genes and biological pathways underlying complex diseases.
Keywords: BLR; Complex disease; Gene set test; Type 2 diabetes.
© 2024. The Author(s).
Conflict of interest statement
Declarations. Ethics approval and consent to participate: Human studies in the UK Biobank project have received approval from the Ethics and Governance Framework (EGF), which ensures data and sample usage adheres to scientific and ethical standards. The consent to participation will apply throughout the lifetime of the UK Biobank, unless participants withdraw, and involves the collection and storage of biological samples (blood, saliva, urine) and electronic health records (GP, hospitals, dental, prescriptions). Individual data is anonymized, with each research project receiving its own anonymized dataset. The ethics committee waived the need for written informed consent. Competing interests: The authors declare no competing interests.
Figures
Similar articles
-
Evaluation of Bayesian Linear Regression models for gene set prioritization in complex diseases.PLoS Genet. 2024 Nov 4;20(11):e1011463. doi: 10.1371/journal.pgen.1011463. eCollection 2024 Nov. PLoS Genet. 2024. PMID: 39495786 Free PMC article.
-
How powerful are summary-based methods for identifying expression-trait associations under different genetic architectures?Pac Symp Biocomput. 2018;23:228-239. Pac Symp Biocomput. 2018. PMID: 29218884 Free PMC article.
-
Next generation modeling in GWAS: comparing different genetic architectures.Hum Genet. 2014 Oct;133(10):1235-53. doi: 10.1007/s00439-014-1461-1. Epub 2014 Jun 17. Hum Genet. 2014. PMID: 24934831
-
Genetic architecture of type 2 diabetes.Biochem Biophys Res Commun. 2014 Sep 19;452(2):213-20. doi: 10.1016/j.bbrc.2014.08.012. Epub 2014 Aug 8. Biochem Biophys Res Commun. 2014. PMID: 25111817 Review.
-
Application of Bayesian genomic prediction methods to genome-wide association analyses.Genet Sel Evol. 2022 May 13;54(1):31. doi: 10.1186/s12711-022-00724-8. Genet Sel Evol. 2022. PMID: 35562659 Free PMC article. Review.
References
-
- Tinajero MG, Malik VS. An update on the epidemiology of type 2 diabetes: a global perspective. Endocrinol Metab Clin North Am. 2021;50(3):337–55. - PubMed
MeSH terms
Grants and funding
LinkOut - more resources
Full Text Sources
Medical
Research Materials
