. 2024 Dec 23;30(1):271.
doi: 10.1186/s10020-024-01039-8.

Distinct patterns of cell adhesion, migration, and morphology in olfactory neuroepithelium cells of bipolar disorder patients

Affiliations

Distinct patterns of cell adhesion, migration, and morphology in olfactory neuroepithelium cells of bipolar disorder patients

Alejandra Delgado-Sequera et al. Mol Med. .

Abstract

Background: Bipolar disorder (BD) is a severe, chronic mental illness that remains difficult to diagnose due to the lack of specific biomarkers, relying primarily on clinical assessments. Early diagnosis and treatment are essential for improving prognosis and lowering suicide risk. This study aimed to identify biomarkers and therapeutic targets by utilizing olfactory neuroepithelium (ONE) cells from patients with BD and controls.

Methods: Immunofluorescence of ONE cells, along with proteomic and RNA sequencing analyses, was performed to investigate cytoskeletal changes and pathways involved in cell adhesion, movement, and morphology. Additionally, potential biomarkers were investigated in blood samples to improve clinical accessibility.

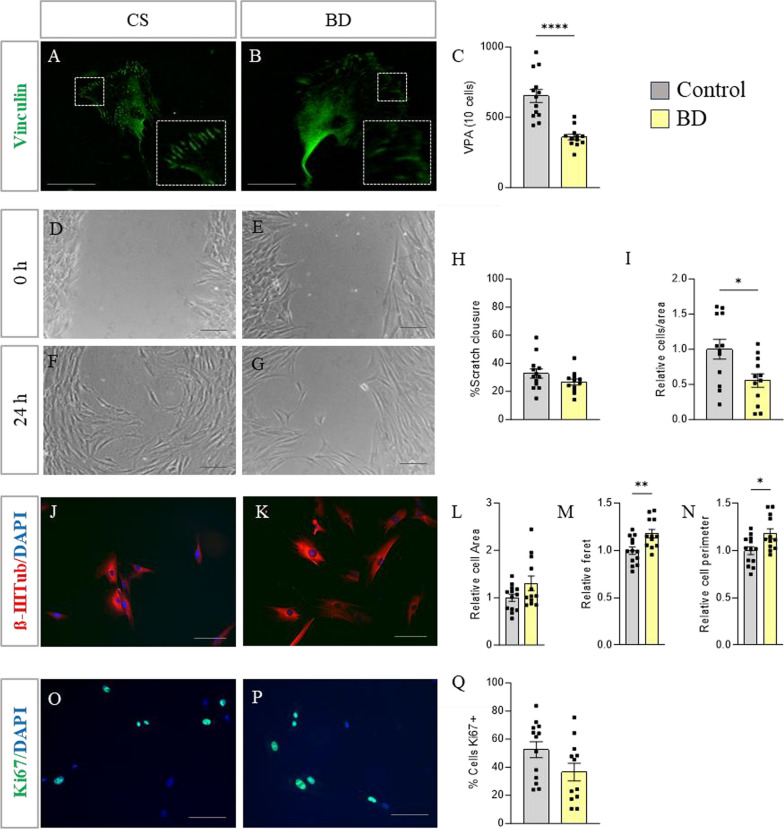
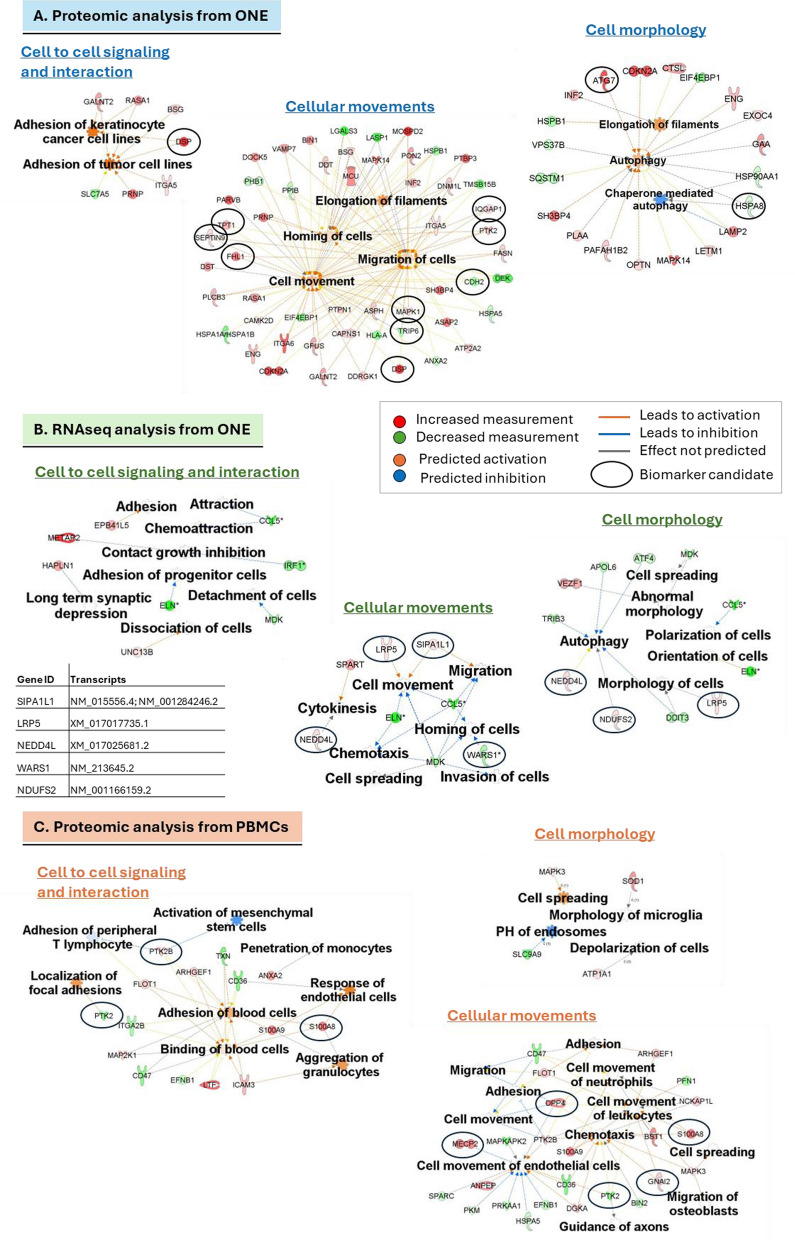
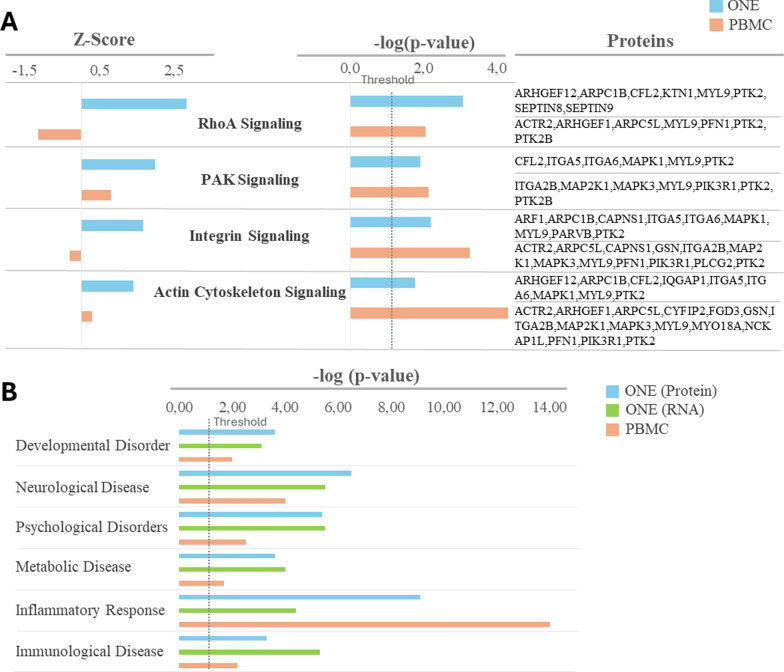
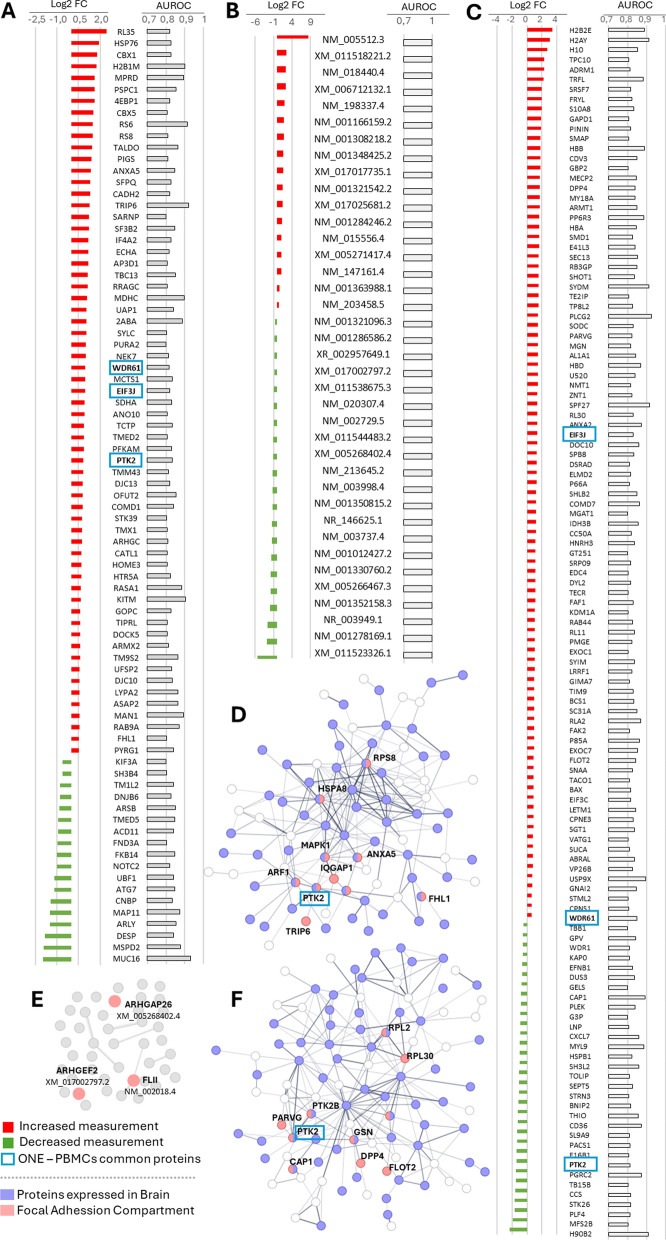
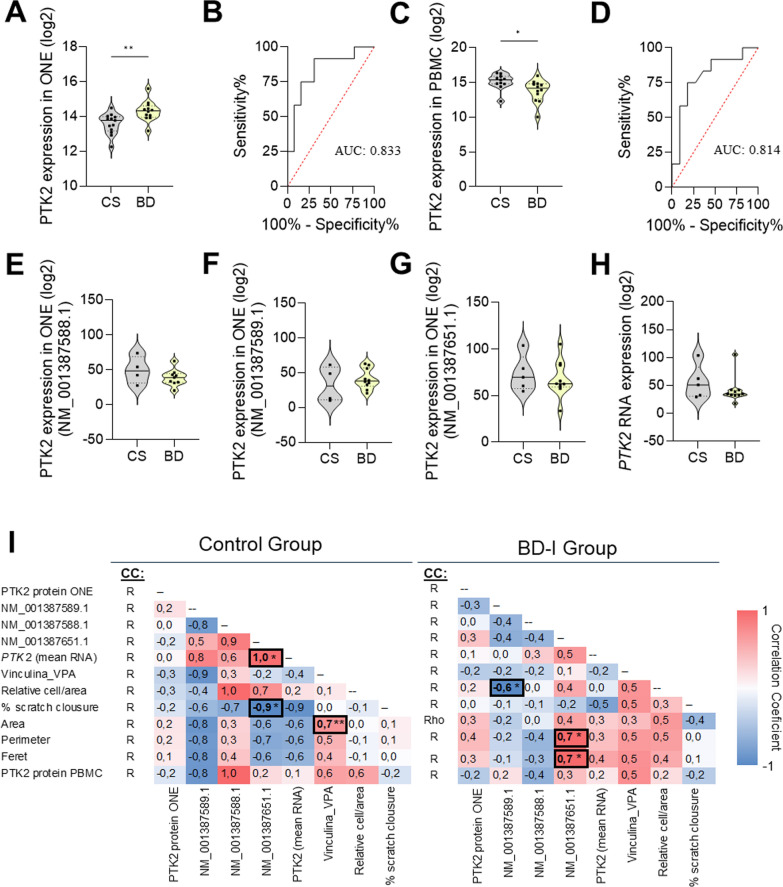
Results: Thus, according to functional assays, ONE cells derived from BD patients exhibited decreased substrate adhesion, reduced cell migration, and morphological changes compared to control cells. In addition, proteomic and RNAseq analyses in ONE cells and peripheral blood mononuclear cells (PBMCs) revealed alterations in pathways such as RhoA/PAK/Integrin and Actin Cytoskeleton Signaling, as well as significant changes in inflammatory and immunological pathways. AUROC analysis identified proteins like PTK2 as potential diagnostic biomarkers, showing altered expression in both ONE cells and PBMCs. PTK2 RNA expression correlated with distinct morphological traits in BD ONE cells.

Conclusions: In summary, this study identified cytoskeletal alterations, reduced adhesion, and disrupted migration patterns in BD ONE cells, highlighting molecular mechanisms underlying these changes and emphasizing PTK2's role as a potential diagnostic biomarker for BD.

Keywords: Biomarker; Bipolar disorder; Cytoskeleton; Olfactory neuroepithelium.


Conflict of interest statement

Declarations. Ethics approval and consent to participate: The Andalusian Ethics Committee (CCEIBA) approved this study, and all the participants signed the informed consent. Consent for publication: Not applicable. Competing interests: The authors declare no competing interests.

Figures

Fig. 1
Fig. 1
In vitro characterization of ONE cells. A, B Immunofluorescence images of vinculin-positive cells. The insets show magnifications of selected areas. C Quantification of vinculin points of adhesion (VPA). DG Bright-field images of the scratched area at 0 and 24 h. H Quantification of the percentage of scratch closure after 24 h. I Quantification of the number of cells that migrated to the scratch after 24 h. J, K Immunofluorescence images showing β-III-Tubulin-positive cells (red) with nuclei stained with DAPI (blue). LN Quantification of cell area, perimeter, and Feret’s diameter relative to that of the control cells. O, P Immunofluorescence images of Ki67-positive cells (green) with nuclei stained with DAPI (blue). Q Quantification of the percentage of Ki67-positive cells relative to the total number of cells quantified by DAPI. Data are presented as mean ± SEM. *p < 0,05; ** p < 0,01; **** p < 0,0001. Scale bar represents 50 μm. CS: Control subjects; BD: Bipolar disorder; VPA; vinculin points of adhesion
Fig. 2
Fig. 2
Biofunctions significantly affected in BD cells compared to controls: ‘cell to cell signaling and interaction’, ‘cell movement’ and ‘cell morphology’. A Selected biofunctions and proteins involved in these biofunctions from ONE cells. B Selected biofunctions and RNAs involved in these biofunctions from ONE cells. C Selected biofunctions and proteins involved in these biofunctions from PBMCs. ONE olfactory neuroepithelium, PBMC peripheral blood mononuclear cells. Circles label biomarker candidates with AUROC > 0.8 for proteins and AUROC = 1 for RNA transcripts
Fig. 3
Fig. 3
Cellular pathways and disorders associated with differentially expressed molecules in BD cells compared to controls. A Canonical pathways significantly altered in BD cells compared to controls and related to the cytoskeleton, cell migration and/or cell adhesion. B Disorders associated with the differentially expressed proteins in ONE and PBMC from BD patients compared to controls. ONE olfactory neuroepithelium cells, PBMC peripheral blood mononuclear cells, PAK p21-activated kinase
Fig. 4
Fig. 4
Proteins and RNA transcripts expression levels (BD vs Control) as biomarker candidates. A List of proteins from ONE with AUROC > 0.8 and Log2 Fold Change (FC) < − 0.5 or > 0.5. B List of RNA transcripts from ONE with AUROC = 1 and Log2 Fold Change (FC) < − 0.5 or > 0.5. C List of proteins from PBMC with AUROC > 0.8 and Log2 Fold Change (FC) < − 0.5 or > 0.5. D Proteins from ONE with AUROC > 0.8, including enrichment in proteins expressed in the brain (purple) and/or in the focal adhesion compartment (pink), as assessed by STRING. E RNA transcripts from ONE with AUROC = 1; including RNA transcripts with a function in focal adhesion (pink). F Proteins from PBMC with AUROC > 0.8, including enrichment in proteins expressed in the brain (purple) and/or in the focal adhesion compartment (pink), as assessed by STRING
Fig. 5
Fig. 5
Measurement of PTK2 expression levels and correlations with cellular parameters. A, B PTK2 protein expression levels and AUROC in ONE. C, D PTK2 protein expression levels and AUROC in PBMC. EH PTK2 RNA transcript levels in ONE. I Correlation coefficient between PTK2 protein/RNA expression levels and cellular parameters. CS control subjects, BD bipolar disorder, ONE olfactory neuroepithelial cells, PBMC peripheral blood mononuclear cells; *p < 0.05; **p < 0.01; R: Pearson’s correlation; Rho: Spearman’s correlation

Similar articles

References

    1. American Psychiatric Association. Diagnostic and statistical manual of mental disorders. 5th ed. Arlington: American Psychiatric Publishing; 2013.
    1. Armendáriz BG, del Masdeu MM, Soriano E, Ureña JM, Burgaya F. The diverse roles and multiple forms of focal adhesion kinase in brain. Eur J Neurosci. 2014;40(11):3573–90. - PubMed
    1. Barnett JH, Smoller JW. The genetics of bipolar disorder. Neuroscience. 2009;164:331–43. - PMC - PubMed
    1. Bellon A. Comparing stem cells, transdifferentiation and brain organoids as tools for psychiatric research. Transl Psychiatry. 2024;14:127. - PMC - PubMed
    1. Benítez-King G, Valdés-Tovar M, Trueta C, Galván-Arrieta T, Argueta J, Alarcón S, et al. The microtubular cytoskeleton of olfactory neurons derived from patients with schizophrenia or with bipolar disorder: implications for biomarker characterization, neuronal physiology and pharmacological screening. Mol Cell Neurosci. 2016;73:84–95. - PubMed