

Study on molecular response of alfalfa to low temperature stress based on transcriptomic analysis
- PMID: 39716071
- PMCID: PMC11667927
- DOI: 10.1186/s12870-024-05987-5
Study on molecular response of alfalfa to low temperature stress based on transcriptomic analysis
Abstract
Background: Alfalfa (Medicago sativa L.) is an important high-quality forage crop. Low temperature is an abiotic stress factor that affects the distribution and productivity of alfalfa. To further understand the molecular response to low temperature, and to identify additional genes and metabolic pathways associated with cold tolerance in alfalfa, in this study we conducted transcriptome sequencing, weighted gene co-expression network analysis, KEGG pathway enrichment analysis, and quantitative real-time PCR validation in alfalfa cultivars subjected to low-temperature treatment.
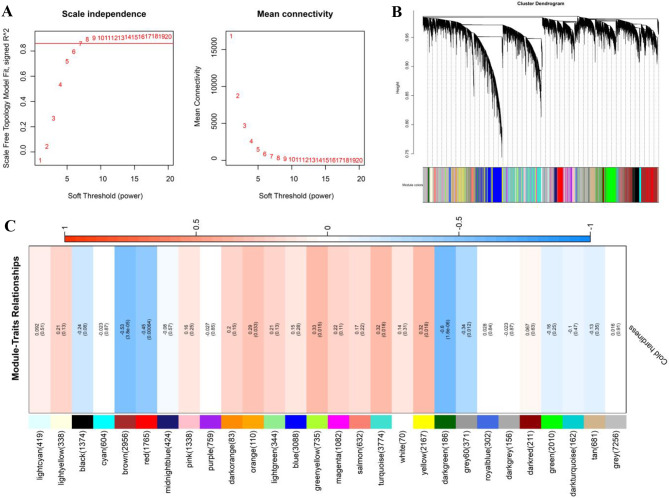
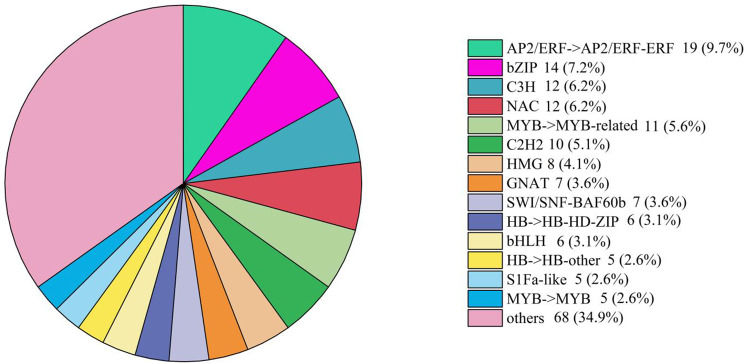
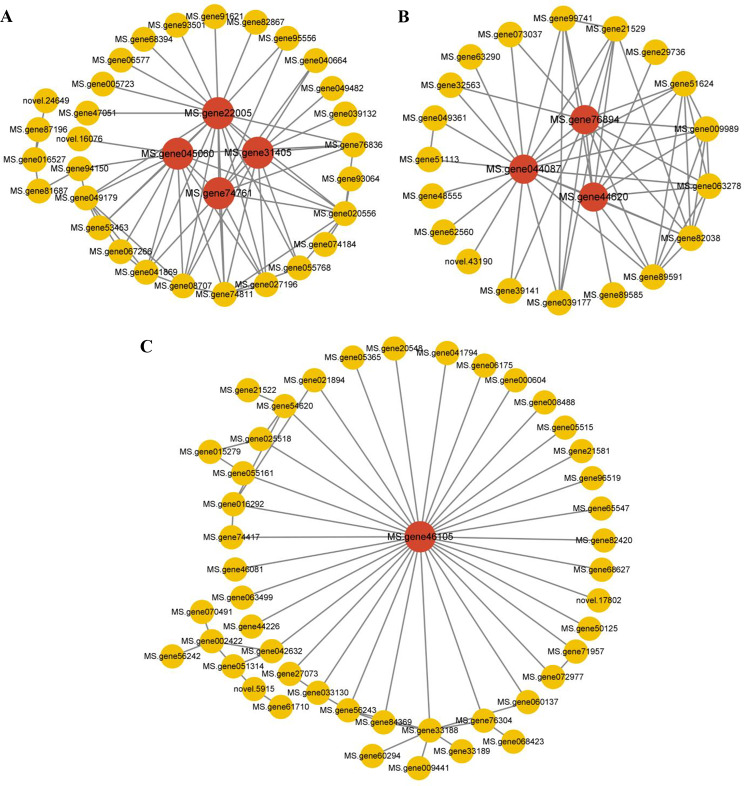
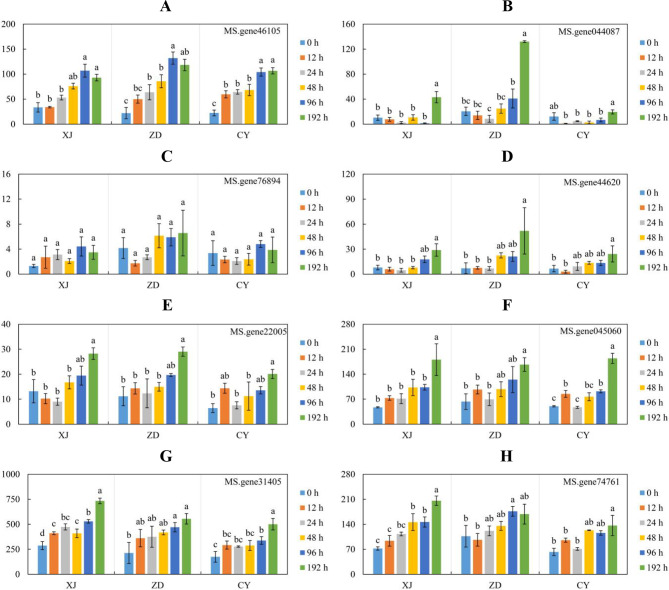
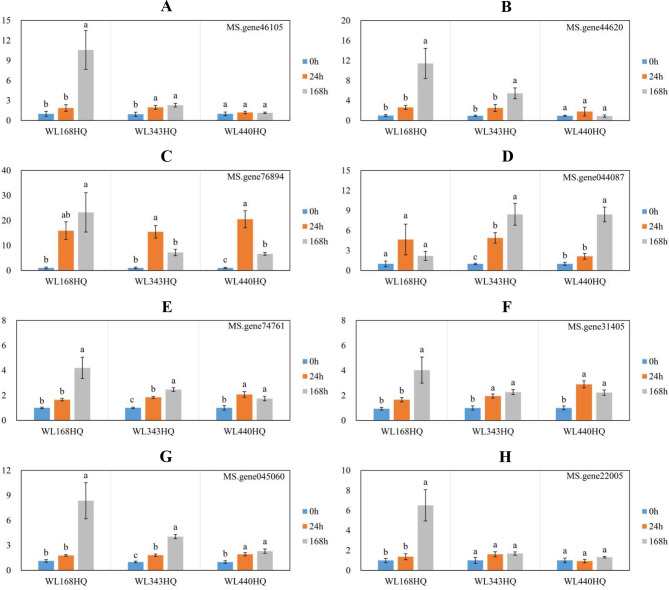
Results: Weighted gene co-expression network analysis revealed that three gene modules were significantly negatively correlated with the semi-lethal temperature for alfalfa. Genes in the three modules were used to construct gene co-expression networks, from which MS.gene46105, MS.gene044087, MS.gene76894, MS.gene44620, MS.gene22005, MS.gene045060, MS.gene31405, and MS.gene74761 were selected as important genes associated with cold tolerance. Quantitative real-time PCR analysis of these eight genes validated the reliability of the transcriptome sequencing data. In addition, further analysis of the genes within the three modules revealed that several transcription factors (AP2/ERF, bZIP, C3H, NAC, and others) and metabolic pathways (N-glycan biosynthesis, citrate cycle, glycolysis/gluconeogenesis, and carbon metabolism, and others) responded well to the low temperature.
Conclusions: Three gene modules, eight genes, several transcription factors and multiple metabolic pathways associated with cold tolerance were screened. This results will provide a valuable reference for further clarification of the cold tolerance mechanism and breeding for cold tolerance in alfalfa.
Keywords: Alfalfa; Cold tolerance; Low temperature; Molecular response; Weighted gene co-expression network analysis.
© 2024. The Author(s).
Conflict of interest statement
Declarations. Ethics approval and consent to participate: Plant materials used in this study were cultivated on the experimental plot of Shanxi Agricultural University by our research team, and all the members have no objection to this use. Consent for publication: Not applicable. Competing interests: The authors declare no competing interests.
Figures


Similar articles
-
Identification of Cold Tolerance Transcriptional Regulatory Genes in Seedlings of Medicago sativa L. and Medicago falcata L.Int J Mol Sci. 2024 Sep 26;25(19):10345. doi: 10.3390/ijms251910345. Int J Mol Sci. 2024. PMID: 39408674 Free PMC article.
-
Multiple Regulatory Networks Are Activated during Cold Stress in Medicago sativa L.Int J Mol Sci. 2018 Oct 15;19(10):3169. doi: 10.3390/ijms19103169. Int J Mol Sci. 2018. PMID: 30326607 Free PMC article.
-
Transcriptomic analyses provide molecular insight into the cold stress response of cold-tolerant alfalfa.BMC Plant Biol. 2024 Aug 3;24(1):741. doi: 10.1186/s12870-024-05136-y. BMC Plant Biol. 2024. PMID: 39095692 Free PMC article.
-
Comparative Phenotypic and Transcriptomic Analyses Provide Novel Insights into the Molecular Mechanism of Seed Germination in Response to Low Temperature Stress in Alfalfa.Int J Mol Sci. 2024 Jun 30;25(13):7244. doi: 10.3390/ijms25137244. Int J Mol Sci. 2024. PMID: 39000350 Free PMC article.
-
Genome-Wide Investigation of MicroRNAs and Their Targets in Response to Freezing Stress in Medicago sativa L., Based on High-Throughput Sequencing.G3 (Bethesda). 2016 Jan 22;6(3):755-65. doi: 10.1534/g3.115.025981. G3 (Bethesda). 2016. PMID: 26801649 Free PMC article.
Cited by
-
Aluminum Stress Response Is Regulated Through a miR156/SPL13 Module in Medicago sativa.Genes (Basel). 2025 Jun 27;16(7):751. doi: 10.3390/genes16070751. Genes (Basel). 2025. PMID: 40725407 Free PMC article.
References
-
- Zang Z, Li Z, Wang J, Lu X, Lyu Q, Tang M, Cui HL, Yan S. Terahertz spectroscopic monitoring and analysis of citrus leaf water status under low temperature stress. Plant Physiol Biochem. 2023;194:52–9. - PubMed
-
- Bertrand A, Bipfubusa M, Claessens A, Rocher S, Castonguay Y. Effect of photoperiod prior to cold acclimation on freezing tolerance and carbohydrate metabolism in alfalfa (Medicago sativa L). Plant Sci. 2017;264:122–8. - PubMed
-
- Kidokoro S, Shinozaki K, Yamaguchi-Shinozaki K. Transcriptional regulatory network of plant cold-stress responses. Trends Plant Sci. 2022;27(9):922–35. - PubMed
-
- Thomashow MF. plant cold acclimation: freezing tolerance genes and Regulatory mechanisms. Annu Rev Plant Physiol Plant Mol Biol. 1999;50:571–99. - PubMed
MeSH terms
Grants and funding
LinkOut - more resources
Full Text Sources
Research Materials
