

Pathway metrics accurately stratify T cells to their cells states
- PMID: 39716187
- PMCID: PMC11668091
- DOI: 10.1186/s13040-024-00416-7
Pathway metrics accurately stratify T cells to their cells states
Abstract
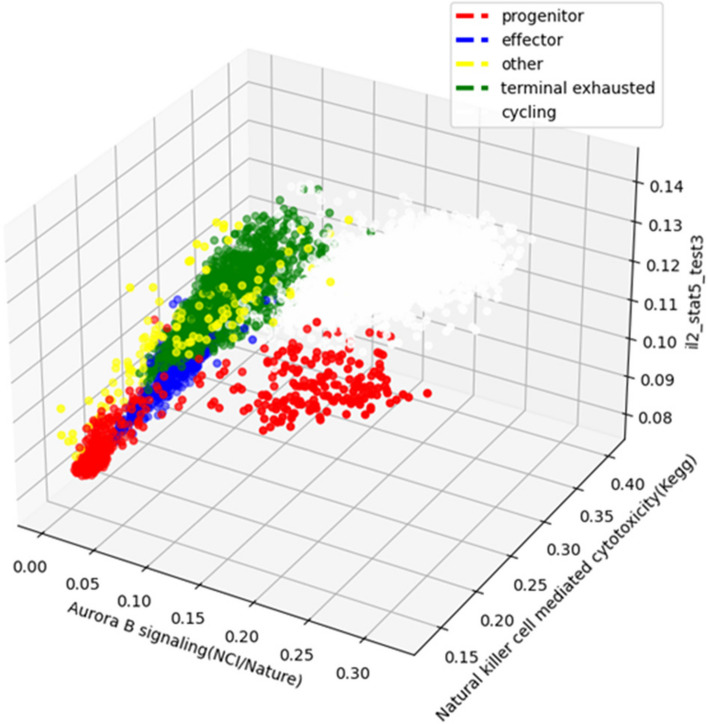
Pathway analysis is a powerful approach for elucidating insights from gene expression data and associating such changes with cellular phenotypes. The overarching objective of pathway research is to identify critical molecular drivers within a cellular context and uncover novel signaling networks from groups of relevant biomolecules. In this work, we present PathSingle, a Python-based pathway analysis tool tailored for single-cell data analysis. PathSingle employs a unique graph-based algorithm to enable the classification of diverse cellular states, such as T cell subtypes. Designed to be open-source, extensible, and computationally efficient, PathSingle is available at https://github.com/zurkin1/PathSingle under the MIT license. This tool provides researchers with a versatile framework for uncovering biologically meaningful insights from high-dimensional single-cell transcriptomics data, facilitating a deeper understanding of cellular regulation and function.
Keywords: Dimensionality reduction; Machine learning; Pathway analysis; RNA sequencing; Single-cell data; Systems biology.
© 2024. The Author(s).
Conflict of interest statement
Declarations. Ethics approval and consent to participate: Not applicable. Consent for publication: Not applicable. Competing interests: The authors declare no competing interests.
Figures
References
-
- Aibar S, González-Blas CB, Moerman T, Huynh-Thu VA, Imrichova H, Hulselmans G, Rambow F, Marine J-C, Geurts P, Aerts J, van den Oord J, Atak ZK, Wouters J, Aerts S. SCENIC: single-cell regulatory network inference and clustering. Nat Methods. 2017;14(11):1083–6. 10.1038/nmeth.4463. - DOI - PMC - PubMed
-
- ATOM. (n.d.). Retrieved October 31. 2023, from https://pypi.org/project/atom/
LinkOut - more resources
Full Text Sources
