. 2024 Dec 24;28(1):431.
doi: 10.1186/s13054-024-05216-3.

Multiomic molecular patterns of lipid dysregulation in a subphenotype of sepsis with higher shock incidence and mortality

Affiliations

Multiomic molecular patterns of lipid dysregulation in a subphenotype of sepsis with higher shock incidence and mortality

Beulah Augustin et al. Crit Care. .

Abstract

Background: Lipids play a critical role in defense against sepsis. We sought to investigate gene expression and lipidomic patterns of lipid dysregulation in sepsis.

Methods: Data from four adult sepsis studies were analyzed and findings were investigated in two external datasets. Previously characterized lipid dysregulation subphenotypes of hypolipoprotein (HYPO; low lipoproteins, increased mortality) and normolipoprotein (NORMO; higher lipoproteins, lower mortality) were studied. Leukocytes collected within 24 h of sepsis underwent RNA sequencing (RNAseq) and shotgun plasma lipidomics was performed.

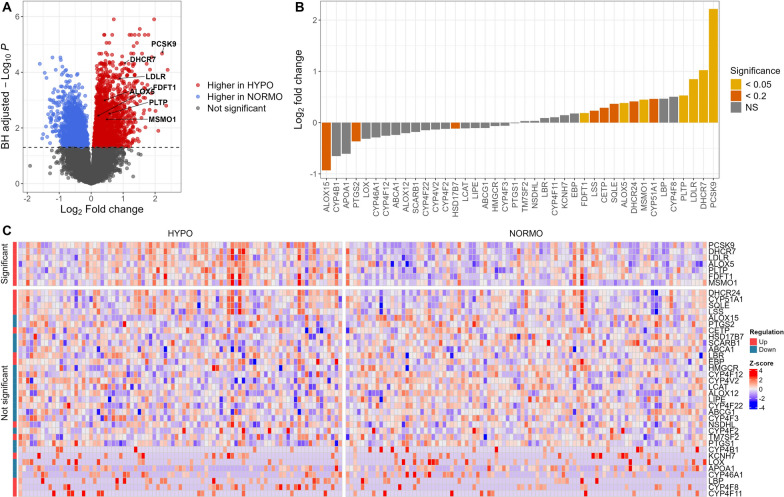
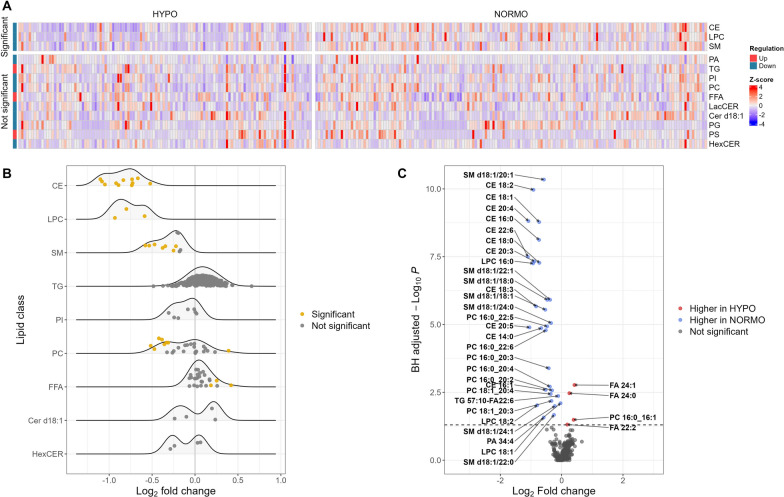
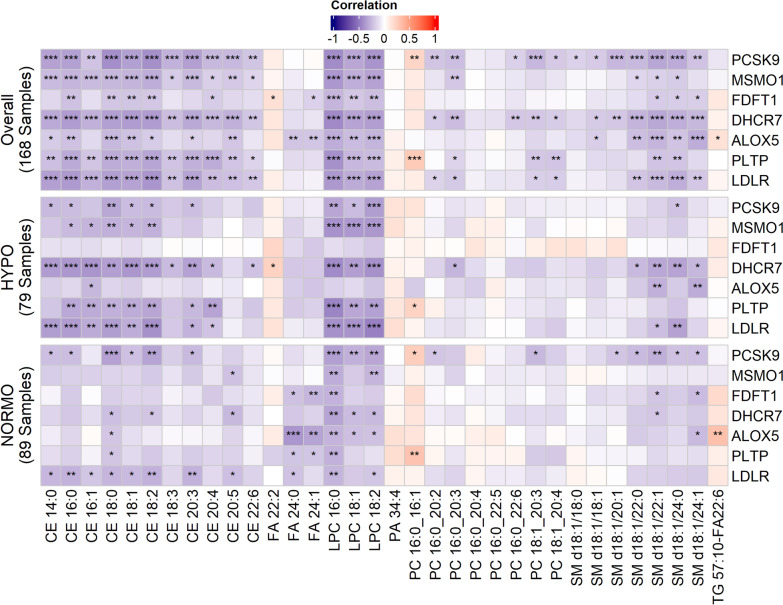
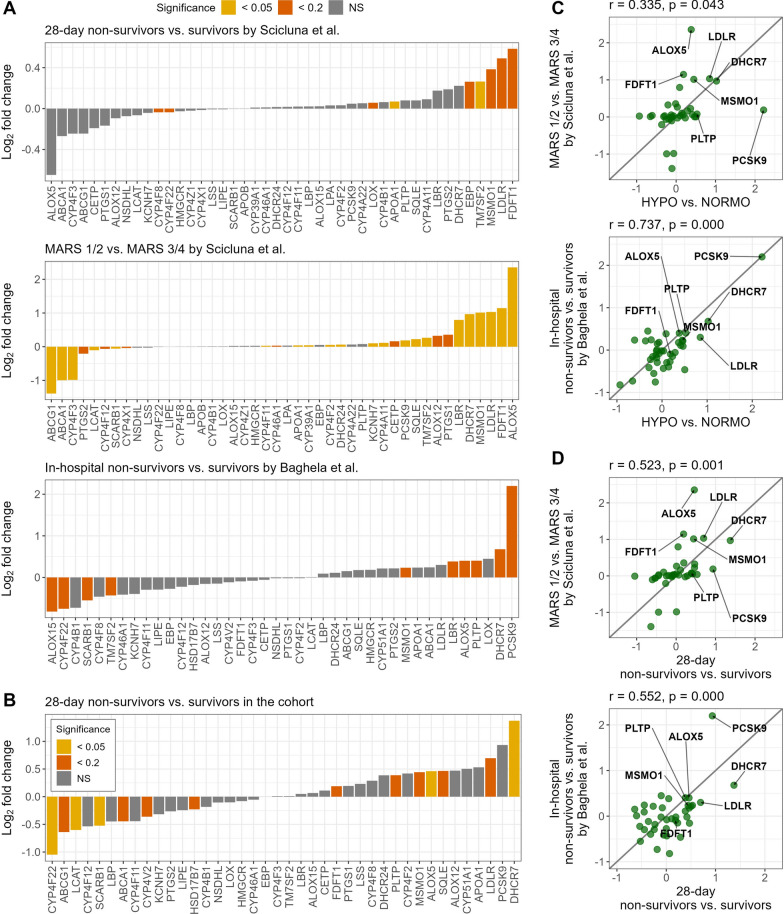
Results: Of 288 included patients, 43% were HYPO and 57% were NORMO. HYPO patients exhibited higher median SOFA scores (9 vs 5, p = < 0.001), vasopressor use (67% vs 34%, p = < 0.001), and 28-day mortality (30% vs 16%, p = 0.004). Leukocyte RNAseq identified seven upregulated lipid metabolism genes in HYPO (PCSK9, DHCR7, LDLR, ALOX5, PLTP, FDFT1, and MSMO1) vs. NORMO patients. Lipidomics revealed lower cholesterol esters (CE, adjusted p = < 0.001), lysophosphatidylcholines (LPC, adjusted p = 0.001), and sphingomyelins (SM, adjusted p = < 0.001) in HYPO patients. In HYPO patients, DHCR7 expression strongly correlated with reductions in CE, LPC, and SM (p < 0.01), while PCSK9, MSMO1, DHCR7, PLTP, and LDLR upregulation were correlated with low LPC (p < 0.05). DHCR7, ALOX5, and LDLR correlated with reductions in SM (p < 0.05). Mortality and phenotype comparisons in two external datasets (N = 824 combined patients) corroborated six of the seven upregulated lipid genes (PCSK9, DHCR7, ALOX5, PLTP, LDLR, and MSMO1).

Conclusion: We identified a genetic lipid dysregulation signature characterized by seven lipid metabolism genes. Five genes in HYPO sepsis patients most strongly correlated with low CE, LPC, and SMs that mediate cholesterol storage and innate immunity.

Trial registration: ClinicalTrials.gov NCT02934997 NCT04576819 NCT03405870.

Keywords: Cholesterol; Lipids; Phenotyping; Sepsis.


Conflict of interest statement

Declarations. Ethical approval and consent to participate: This study was approved by the institutional review boards of the University of Florida College of Medicine, and all participants provided written consent before study participation. Consent for publication: All authors have provided consent for publication of the manuscript. Competing interests: The authors declare no competing interests.

Figures

Fig. 1
Fig. 1
RNA-seq analysis comparing HYPO vs. NORMO. A Volcano plot displaying results from the differential expression analysis of 26,878 genes between HYPO and NORMO. Each dot represents a gene, with colors indicating significance, using a Benjamini-Hochberg-adjusted P value cutoff of less than 0.05 (dashed line). The x-axis denotes the log2 fold change for HYPO vs. NORMO, and the y-axis shows the Benjamini-Hochberg-adjusted -log10 P value. B Bar plot showing the log2 fold change of 40 lipid genes for HYPO vs. NORMO. Seven non-expressed lipid genes have been excluded from the analysis. Colors represent the significance of these genes, determined by the Benjamini-Hochberg-adjusted P value, adjusted for 26,878 comparisons. C Heatmap showing the expression of 40 lipid genes. Seven non-expressed lipid genes have been excluded from the analysis. The color scale corresponds to z-scored, log2-transformed gene expression values for each sample. Significance was determined by the Benjamini-Hochberg-adjusted P value, with a cutoff of 0.05, adjusted for 26,878 comparisons
Fig. 2
Fig. 2
Lipidomics analysis comparing HYPO vs. NORMO. A Heatmap showing the abundance of 13 lipid classes analyzed via shotgun lipidomics. The color scale corresponds to z-scored concentration values for each sample. Significance was determined by the Benjamini-Hochberg-adjusted P value, with a cutoff of 0.05, adjusted for 13 lipid class comparisons. B Ridgeline plot comparing lipid species between HYPO and NORMO. Each dot represents an individual lipid species within its corresponding lipid class (y-axis). The color of the dot indicates whether the lipid is significantly altered, with a cutoff of 0.05 for the Benjamini-Hochberg-adjusted P value, adjusted for all 355 lipid species comparisons. The x-axis represents the log2 fold change for HYPO vs. NORMO. Four lipid classes (PA, LacCER, PG, and PS) are hidden due to having fewer than 3 individual lipid species within the class. C Volcano plot displaying the differential abundance of 355 lipids between HYPO and NORMO. Each dot represents a lipid species, with colors indicating significance using a Benjamini-Hochberg-adjusted P value cutoff of less than 0.05. The x-axis denotes the log2 fold change for HYPO vs. NORMO, and the y-axis shows the Benjamini-Hochberg-adjusted -log10 P value
Fig. 3
Fig. 3
Correlation analysis between individual lipids and HYPO vs. NORMO subphenotypes by expression of the 7 significant genes. The correlation matrix displays significant correlations between genes in overall analysis (all patients, N = 168), HYPO patients only (N = 79), and NORMO patients only (N = 89), for patients with RNAseq data. Significant correlations are indicated as follows: ***p < 0.001, **p < 0.01, *p < 0.05). Differences in the correlations between specific upregulated genes and individual cholesterol esters (CE), lysophosphatidylcholines (LPC), phosphatidylcholines (PC), and sphingomyelins (SM) are observable between HYPO and NORMO patients, with the most significant differences correlated with upregulation of PCSK9, MSMO1, DHCR7, PLTP, and LDLR in HYPO patients
Fig. 4
Fig. 4
Comparison of gene expression patterns in external datasets. A Bar plot showing the log2 fold changes of lipid genes for 28-day non-survivors vs. survivors, MARS 1/2 vs. MARS 3/4 (Scicluna et al.), and in-hospital non-survivors vs. survivors (Baghela et al.). Non-expressed lipid genes have been excluded from the corresponding analysis. Colors represent the significance of these genes, determined by the Benjamini-Hochberg-adjusted P value. B Bar plot showing the log2 fold changes of 40 lipid genes for 28-day non-survivors vs. survivors in our study. Seven non-expressed lipid genes have been excluded from the analysis. Colors represent the significance of these genes, determined by the Benjamini-Hochberg-adjusted P value. C Correlation between log2 fold changes from validation sets compared to HYPO vs. NORMO in our study. The x-axis denotes the log2 fold change for HYPO vs. NORMO in our study, and the y-axis shows the log2 fold changes for MARS 1/2 vs. MARS 3/4 (Scicluna et al.) and in-hospital non-survivors vs. survivors (Baghela et al.), separately. D Correlation between log2 fold changes from validation sets compared to 28-day non-survivors vs. survivors in our study. The x-axis denotes the log2 fold change for 28-day non-survivors vs. survivors in our study, and the y-axis shows the log2 fold changes for MARS 1/2 vs. MARS 3/4 (Scicluna et al.) and in-hospital non-survivors vs. survivors (Baghela et al.), separately

References

    1. Seymour CW, Liu VX, Iwashyna TJ, Brunkhorst FM, Rea TD, Scherag A, Rubenfeld G, Kahn JM, Shankar-Hari M, Singer M, Deutschman CS. Assessment of clinical criteria for sepsis: for the third international consensus definitions for sepsis and septic shock (sepsis-3). JAMA. 2016;315(8):762–74. 10.1001/jama.2016.0288. - PMC - PubMed
    1. van Leeuwen HJ, Heezius ECJM, Dallinga GM, van Strijp JAG, Verhoef J, van Kessel KPM. Lipoprotein metabolism in patients with severe sepsis. Crit Care Med. 2003;31(5):1359–66. 10.1097/01.CCM.0000059724.08290.51. - PubMed
    1. Barker G, Leeuwenburgh C, Brusko T, Moldawer L, Reddy ST, Guirgis FW. Lipid and lipoprotein dysregulation in sepsis: clinical and mechanistic insights into chronic critical illness. J Clin Med. 2021;10(8):1693. 10.3390/jcm10081693. - PMC - PubMed
    1. Barker G, Winer JR, Guirgis FW, Reddy S. HDL and persistent inflammation immunosuppression and catabolism syndrome. Curr Opin Lipidol. 2021;32(5):315–22. 10.1097/MOL.0000000000000782. - PMC - PubMed
    1. Catapano AL, Pirillo A, Bonacina F, Norata GD. HDL in innate and adaptive immunity. Cardiovascular research. Published online June 15, 2014. cvu150 [pii] - PubMed

Publication types

Associated data