

Sex differences in hypertension incidence and risk factors: a population-based cohort study in Southern Iran
- PMID: 39716231
- PMCID: PMC11668117
- DOI: 10.1186/s12889-024-21082-8
Sex differences in hypertension incidence and risk factors: a population-based cohort study in Southern Iran
Abstract
Background: Hypertension (HTN) is a major global public health concern. This study aims to identify gender differences to inform more effective prevention strategies and targeted management approaches.
Methods: This prospective cohort study included 7,710 participants aged 40 to 70 years, with a mean follow-up duration of 5.2 years. HTN was defined using European hypertension management guidelines. A Cox regression model was employed to determine factors associated with HTN, adjusting for confounding variables effects.
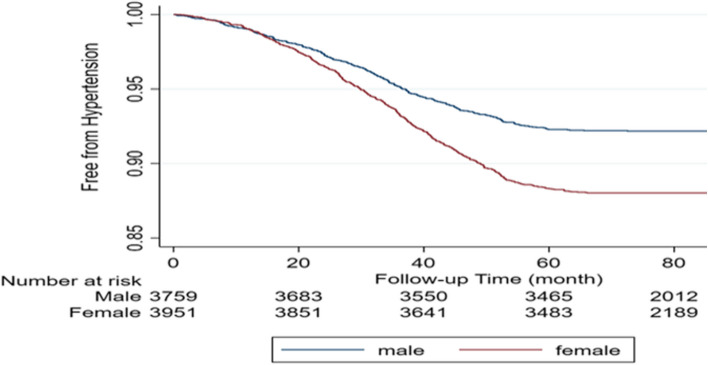
Results: During the mean follow-up period of 5.2 years, the incidence rate of hypertension was 21.54 per 1,000 person-years, with females exhibiting a higher incidence than males. Several significant predictors of HTN were identified. In men, key risk factors included age (60-70 years, 2.83-fold increase, 95% CI 2.05-3.92), high waist-to-height ratio (5.63-fold increase, 95% CI 2.42-13.07), smoking (2.68-fold increase, 95% CI 1.04-6.91), and opium use (1.93-fold increase, 95% CI 1.06-3.49). In women, significant predictors included age (60-70 years, 3.65-fold increase, 95% CI 2.59-5.15), contraceptive drug use (1.24-fold increase, 95% CI 1.01-1.52), high waist-to-height ratio (1.87-fold increase, 95% CI 1.19-2.92), pre-HTN (3.64-fold increase, 95% CI 3.01-4.40), and kidney stones (1.32-fold increase, 95% CI 1.06-1.65).
Conclusion: This study identified key predictors of hypertension (HTN) with notable gender differences. For men, significant risk factors included age, high waist-to-height ratio, smoking, and opium use; for women, the prominent predictors were age, contraceptive use, pre-HTN, and kidney stones. These findings highlight the need for gender-specific strategies in HTN prevention and management, focusing on modifiable risk factors by gender.
Keywords: Cohort study; Hypertension; Incidence; Risk factors; Sex.
© 2024. The Author(s).
Conflict of interest statement
Declarations. Ethics approval and consent to participate: The PERSIAN Cohort Study is being conducted in 18 different regions across Iran, including Kharameh in Fars province, with ethical approval from the Ministry of Health and Medical Education. The study adheres to the Helsinki Declaration and Iranian national research ethics guidelines, under reference number IR.SUMS.SCHEANUT.REC.1401.136. All participants provided informed written consent before participating. Consent for publication: Not applicable. Competing interests: The authors declare no competing interests.
Figures


References
-
- Sawicka K, Szczyrek M, Jastrzebska I, et al. Hypertension–the silent killer. J Pre-Clin Clin Res. 2011;5(2).
-
- Sepanlou S, Sharafkhah M, Poustchi H, et al. Hypertension and mortality in the Golestan Cohort Study: A prospective study of 50 000 adults in Iran. J Hum Hypertens. 2016;30(4):260–7. - PubMed
MeSH terms
LinkOut - more resources
Full Text Sources
Medical
