. 2024 Dec 23;24(1):426.
doi: 10.1186/s12935-024-03581-1.

The expression of pro-prion, a transmembrane isoform of the prion protein, leads to the constitutive activation of the canonical Wnt/β-catenin pathway to sustain the stem-like phenotype of human glioblastoma cells

Affiliations

The expression of pro-prion, a transmembrane isoform of the prion protein, leads to the constitutive activation of the canonical Wnt/β-catenin pathway to sustain the stem-like phenotype of human glioblastoma cells

Alessandro Corsaro et al. Cancer Cell Int. .

Abstract

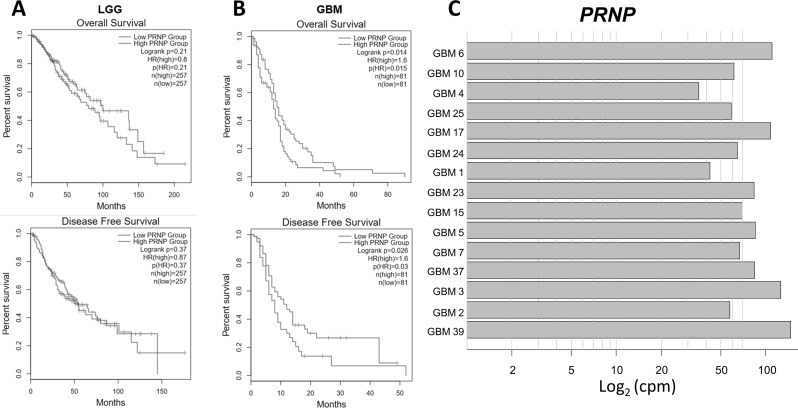
Background: Cellular prion protein (PrPC) is a widely expressed membrane-anchored glycoprotein, which has been associated with the development and progression of several types of human malignancies, controlling cancer stem cell activity. However, the different molecular mechanisms regulated by PrPC in normal and tumor cells have not been characterized yet.

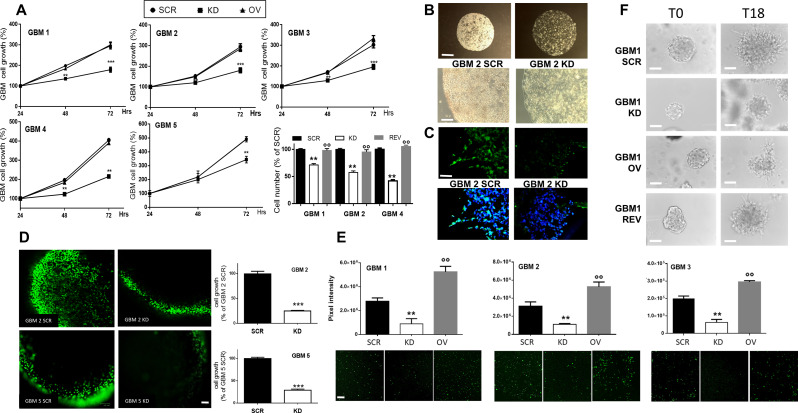
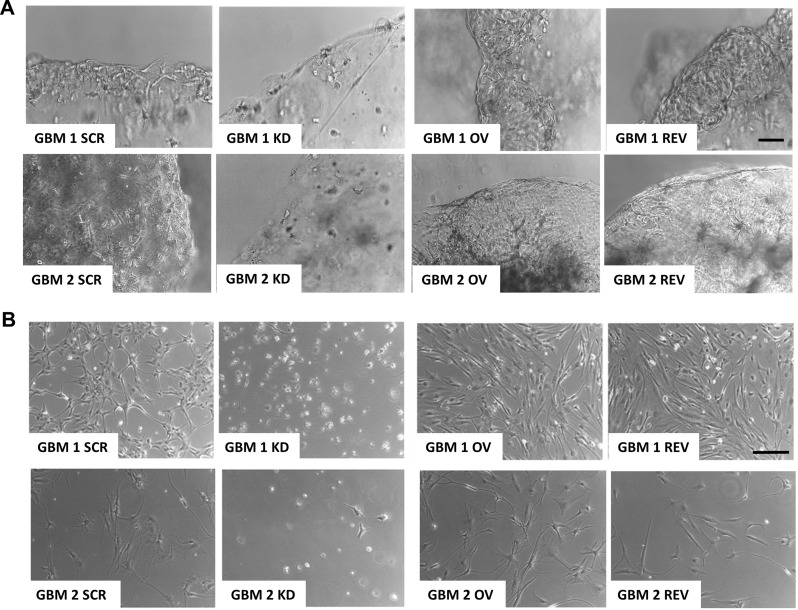
Methods: To assess the role of PrPC in patient-derived glioblastoma stem cell (GSC)-enriched cultures, we generated cell lines in which PrPC was either overexpressed or down-regulated and investigated, in 2D and 3D cultures, its role in cell proliferation, migration, and invasion. We evaluated the role of PrPC in supporting GSC stemness and the intracellular signaling involved using qRT-PCR, immunocytofluorescence, and Western blot.

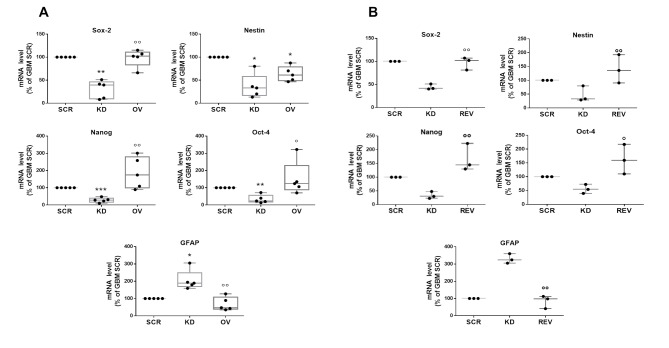
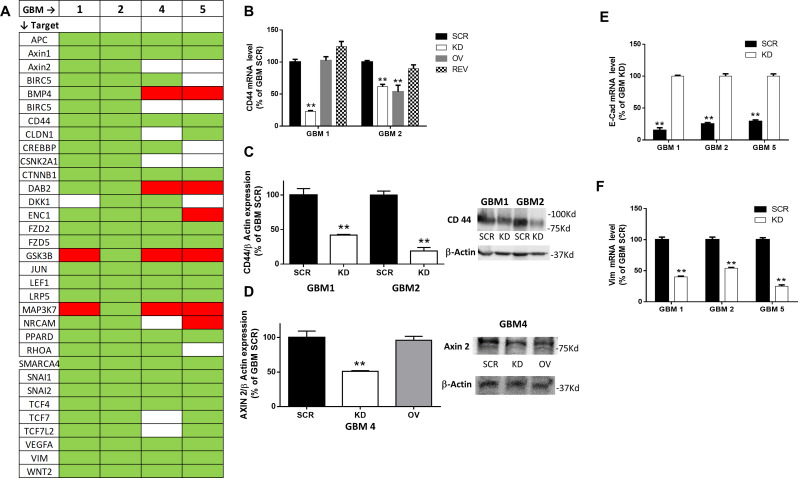
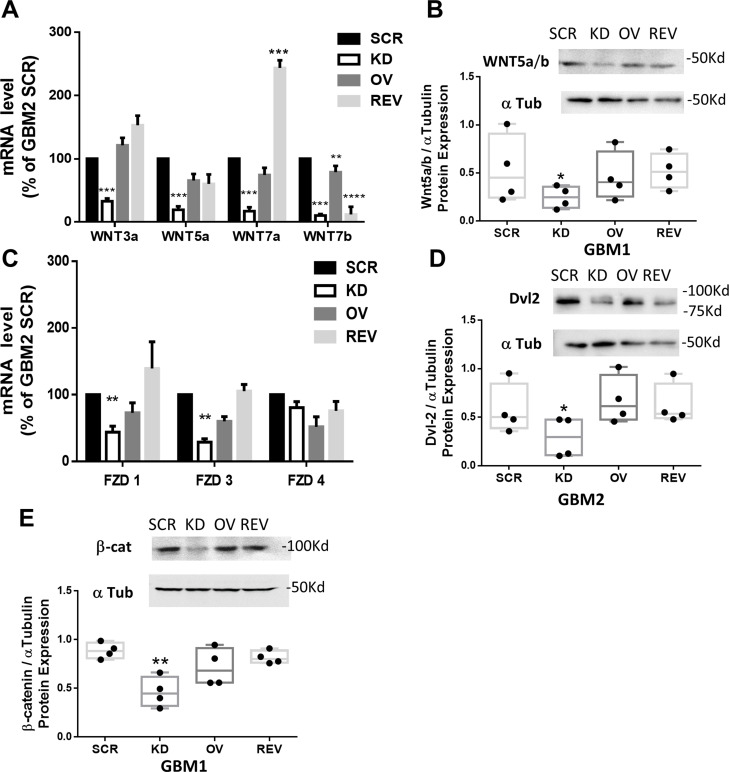
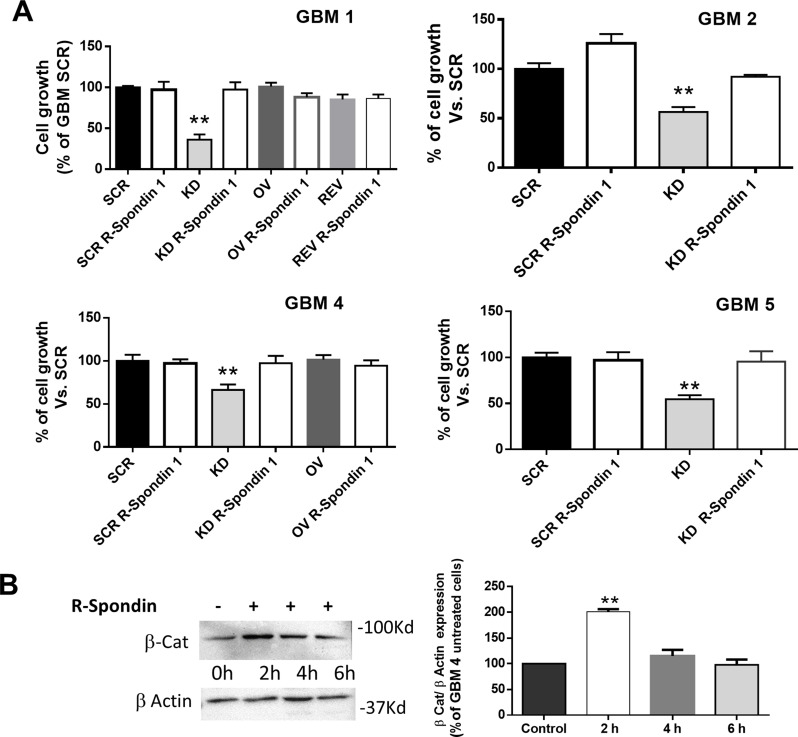
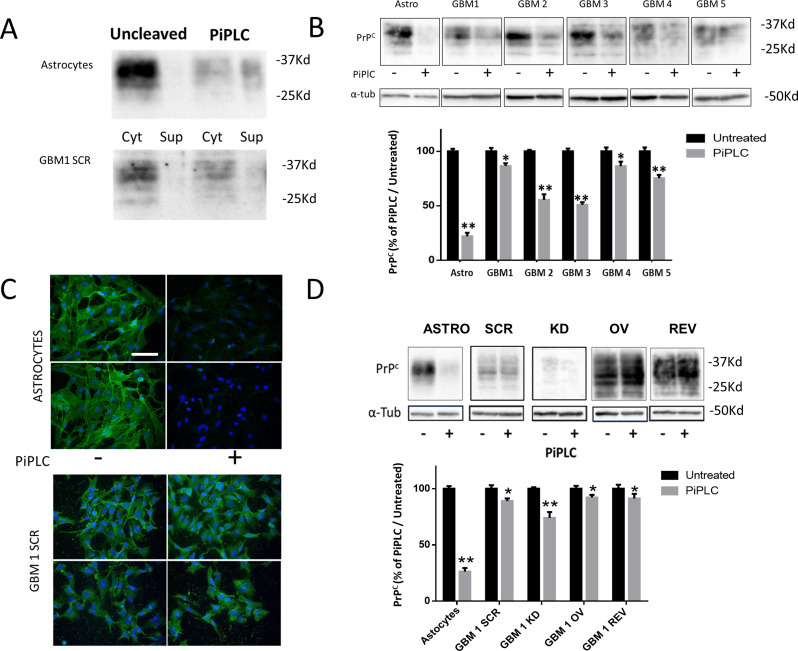
Results: Stable PrPC down-regulation leads to a significant reduction of GSC proliferation, migration, and invasiveness. These effects were associated with the inhibition of the expression of stemness genes and overexpression of differentiation markers. At molecular level PrPC down-regulation caused a significant inhibition of Wnt/β-catenin pathway, through a reduced expression of Wnt and Frizzled ligand/receptor subtypes, resulting in the inhibition of β-catenin transcriptional activity, as demonstrated by the reduced expression of its target genes. The specificity of PrPC in these effects was demonstrated by rescuing the phenotype and the biological activity of PrPC down-regulated GSCs by re-expressing the protein. To get insights into the distinct mechanisms by which PrPC regulates proliferation in GSCs, but not in normal astrocytes, we analyzed structural features of PrPC in glioma stem cells and astrocytes using Western blot and immunofluorescence techniques. Using Pi-PLC, an enzyme that cleaves GPI anchors, we show that, in GSCs, PrP is retained within the plasma membrane in an immature Pro-PrP isoform whereas in astrocytes, it is expressed in its mature PrPC form, anchored on the extracellular face of the plasma membrane.

Conclusions: The persistence of Pro-PrP in GSCs is an altered cellular mechanism responsible of the aberrant, constitutive activation of Wnt/β-catenin pathway, which contributes to glioblastoma malignant features. Thus, the activity of Pro-PrP may represent a targetable vulnerability in glioblastoma cells, offering a novel approach for differentiating and eradicating glioblastoma stem cells.

Keywords: Glioblastoma stem cells; Prion protein; Pro-prion, Wnt/β-catenin pathway..


Conflict of interest statement

Declarations. Ethics Declaration: Human GBM specimens were obtained from the Neurosurgery Dept. of IRCCS Ospedale Policlinico San Martino (Genova, Italy), after Institutional Ethical Committee approval (CER Liguria 360/2019) and patients’ informed consent. Competing interests: The authors declare no competing interests.

Figures

Fig. 1
Fig. 1
Prognostic significance of PrPC expression in GBM and transcript levels in patient-derived GSC cultures. Kaplan–Meier survival analysis of overall survival and disease-free survival of low-grade gliomas (LGG) (total 514 patients) (A) and GBM (total 162 patients) (B) with high or low expression level of PRNP, using GEPIA (http://gepia2.cancer-pku.cn/#index) in TCGA database (https://portal.gdc.cancer.gov/). A statistically significant difference was observed only in GBM (OS: P = 0.014; PFS: P = 0.026). C) PRNP transcript levels in GSCs isolated from 15 human GBMs. Data was obtained by RNA-seq, and expressed as counts per million reads mapped (cpm)
Fig. 2
Fig. 2
PrPC expression modulates GSC proliferation in 2D and 3D cultures. A) Growth curves of GBM 1–5 GSC cultures, comparing GBM SCR, KD and OV. Proliferation rate was evaluated 24-48-72 h from plating, by MTT assay. Each point represents the mean ± SD (n = 3, each performed in quadruplicate). ** p < 0.01 *** p < 0.001 vs. both GBM SCR and OV (t-test). Histogram represents viable cell number counts, using Trypan bleu exclusion test from GBM 1, 2, and 4 SCR, KD, REV evaluated 24 h after plating. Each bar represents the mean ± SD (n = 3, each performed in triplicate). ** p < 0.01 vs. GBM SCR; °°p < 0.01 vs. GBM KD (ANOVA, Tukey’s post-test). B) Representative images of 3D cultures of GBM2 SCR (left) and KD (right) cells, embedded in Matrigel and allowed to grow for 15 days, showing the cell density and the cell expansion within the spheroids. Upper panels: scale bar = 400 μm, lower panels: scale bar = 200 μm. C) Representative images of PrPC-expressing cells (green) in 3D GBM2 SCR (left) and KD (right) cultures, analyzed by immunofluorescence. Nuclei are counterstained with DAPI (blue). Scale bar = 100 μm. D) Representative images of proliferating cells (green) within GBM2 and GBM5 SCR and KD 3D organoids after 10 days of culture, assessed by 5-EdU labeling. Scale bar = 200 μm. Histograms show the percentage of labelled (proliferating) cells obtained by ImageJ analysis of n = 7 spheroids for each culture; each available plan was analyzed in at least three different areas. ***p < 0.001 vs. GBM SCR (t-test). E) Effects of PrPC downregulation on GSC migration. Lower panels: Representative images of fluorescently labelled SCR, KD, and OV cells from GBM1, 2, and 3 migrated in 18 h towards 10%-containing medium used as chemoattractant. Scale bar = 200 μm. Upper panels: quantification of the fluorescence intensity of migrated cells using ImageJ software. Data represent the mean ± SD (n = 3). ** p < 0.01 vs. respective GBM SCR, °° p < 0.01 vs. respective GBM KD (ANOVA Tukey’s post-test). F) Matrigel invasion ability of GBM1 SCR, KD, OV, and REV. Representative images depict GSC spheroids embedded in Matrigel at time T0 (left column) and at time T18 (right column). Invasion was calculated by ImageJ, counting the cells that leave the spheroid to invade the Matrigel matrix. Quantification is reported in Supplementary Fig. 4B. Scale bar = 100 μm
Fig. 3
Fig. 3
PrPC drives GSC survival. Representative images of 3D (A) and 2D (B) GBM1 and GBM2 cell cultures, after 15 days of growth in medium without growth factors. In both culture models, GBM KD failed to survive, leading to 3D organoid and 2D monolayer degeneration; conversely, GBM SCR, OV, and REV were viable and grew in well-organized 3D structures or in 2D monolayers. (A) Scale bar = 100 μm; (B) Scale bar = 50 μm
Fig. 4
Fig. 4
PrPC sustains the stem-like phenotype of GSCs. mRNA levels of stemness (Sox2, nestin, Nanog, Oct-4) and differentiation (GFAP) marker genes in GBM1-5 (dots), evaluated by qRT-PCR. Box-whisker plot represents the mean (line in the center of the box), the 75th, and 25th percentiles (upper and lower ends of boxes) and outliers. A) Comparison of GBM1-5 SCR, KD and OV cells. B) Comparison of GBM1, 2 and 4 SCR, KD, and REV. *p < 0.05, **p < 0.01, ***p < 0.0001 vs. respective GBM SCR; °p < 0.05 °°p < 0.01 vs. respective GBM KD (ANOVA, Tukey’s post-test)
Fig. 5
Fig. 5
PrPC downregulation affects Wnt/β catenin signaling pathway. A) Heatmap showing changes in mRNA levels of Wnt pathway-related genes in GBM1-2-4-5 KD cells, compared to respective GBM SCR. Data were obtained using a predesigned PCR panel for Wnt signaling pathway. Green = downregulation; red = upregulation; white = unchanged. N = 3. B) CD44 mRNA levels in GBM1 and GBM2 SCR, KD, OV, and REV, analyzed by qRT-PCR. Bars represent the mean ± SD. **p < 0.01 vs. respective GBM SCR (t-test). C) Quantification of CD44 protein expression normalized to β-actin content (left). Bars represent the mean ± SD (n = 3). **p < 0.01 vs. respective GBM SCR (t-test). Representative immunoblot shows the content of CD44 protein in GBM1 and GBM2 SCR and KD (right). D) Quantification of Axin2 protein expression normalized to β-actin content (left). Bars represent the mean ± SD (n = 3). **p < 0.01 vs. respective GBM SCR (t-test). Representative immunoblot shows the content of Axin 2 protein in GBM4 SCR, KD and OV (right). E) E-cadherin mRNA levels in GBM1, 2 and 5 SCR (black bars) and KD (white bars) cells, analyzed by qRT-PCR. Bars represent the mean ± SD. **p < 0.01 vs. respective GBM SCR; °°p < 0.01 vs. respective GBM KD (t-test). F) Vimentin mRNA levels in GBM1, 2 and 5 SCR (black bars) and KD (white bars) cells, analyzed by qRT-PCR. Bars represent the mean SD. **p < 0.01 vs. respective GBM KD (t-test)
Fig. 6
Fig. 6
PrPC downregulation influences the mRNA and protein content of components of the Wnt/β catenin pathway. A) mRNA levels of Wnt subtypes, in GBM2 SCR, KD, OV, and REV cells analyzed by qRT-PCR. Bars represent the mean ± SEM (n = 4). **p < 0.01 vs. respective GBM SCR; ***p < 0.001 vs. respective GBM SCR (t-test). B) Representative Western blot (upper panel) and densitometric quantification (lower panel) of Wnt5a/b protein content in GBM1 SCR, KD, and REV cells, normalized to α-tubulin content. Bars represent the mean ± SD (n = 3). *p < 0.05 vs. GBM SCR (t-test). C) mRNA levels of Frizzled (FZD) subtypes, in GBM2 SCR, KD, OV, and REV analyzed by qRT-PCR. Bars represent the mean ± SEM (n = 4). **p < 0.01 vs. respective GBM SCR (t-test). D) Representative Western blot (upper panel) and densitometric quantification (lower panel) of Dvl2 in GBM2 SCR, KD, and REV cells, normalized to α-tubulin content. Bars represent the mean ± SD (n = 3). *p < 0.05 vs. GBM SCR (t-test). E) Representative Western blot (upper panel) and densitometric quantification (lower panel) of β-catenin in GBM1 SCR, KD, and REV cells, normalized to α-tubulin content. Bars represent the mean ± SD (n = 3). **p < 0.01 vs. GBM SCR (t-test)
Fig. 7
Fig. 7
Activation of β-catenin pathway with R-Spondin1 restores proliferation in PrPC-downregulated GSCs. A) Cell proliferation of GBM1, 2, 4, and 5 after 48 h of treatment with R-Spondin1 (500 ng/ml), measured by MTT assay. Bars represent the mean ± SD (n = 3) **p < 0.01 (t-test). B) Left panel: Representative immunoblot of GBM4 KD for non-phosphorylated β-catenin at time 0 (untreated control), and after 2, 4, and 6 h of treatment with R-Spondin 1 (500ng/ml). Right panel: Quantification was carried out by densitometric analysis and normalized to β-actin content. Bars represent the mean ± SD (n = 3). **p < 0.01 vs. untreated GBM KD (t-test)
Fig. 8
Fig. 8
GSCs contain Pro-PrP, the immature form of PrPC. A) Representative immunoblot of PrPC cellular fraction (Cell) or released in the supernatant (Sup) in control cells (Uncleaved) or following GPI digestion by Pi-PLC (PiPLC) in normal astrocytes and GBM1 SCR cells. B) Representative immunoblot of retained PrPC, following GPI digestion by Pi-PLC in astrocytes and GBM1-5 SCR cells (upper panel). PrPC quantification by densitometric analysis, normalized to α-tubulin, is expressed as percentage of Pi-PLC-treated compared to untreated cells (lower panel). Bars represent the mean ± SD (n = 2). *p < 0.05, **p < 0.01 vs. respective untreated cells (t-test). C) Representative images of immunofluorescence for PrPC (green) showing the profile of membrane PrPC expression in normal astrocytes and GBM1 SCR cells, in control conditions (-) and after digestion for 30 min with Pi-PLC (+). After fixation, cells have been immunoprobed without permeabilization to evidence PrPC expression in plasma membrane only. Nuclei are counterstained with DAPI (blue). Scale bar = 100 µM. D) Representative immunoblot of retained or released PrPC, following GPI digestion with Pi-PLC in astrocytes and GBM1 SCR, KD, OV, and REV cells. PrPC quantification by densitometric analysis, normalized to α-tubulin, is expressed as a percentage of Pi-PLC-treated compared to untreated cells. Bars represent the mean ± SD. *p < 0.05, **p < 0.01 vs. respective untreated cells (t-test)

Similar articles

References

    1. Louis DN, Perry A, Wesseling P, Brat DJ, Cree IA, Figarella-Branger D, et al. The 2021 WHO classification of tumors of the Central Nervous System: a summary. Neuro Oncol. 2021;23(8):1231–51. - PMC - PubMed
    1. Stupp R, Taillibert S, Kanner A, Read W, Steinberg D, Lhermitte B, et al. Effect of Tumor-Treating Fields Plus maintenance temozolomide vs maintenance temozolomide alone on survival in patients with glioblastoma: a Randomized Clinical Trial. JAMA. 2017;318(23):2306–16. - PMC - PubMed
    1. Florio T, Barbieri F. The status of the art of human malignant glioma management: the promising role of targeting tumor-initiating cells. Drug Discov Today. 2012;17(19–20):1103–10. - PubMed
    1. Singh SK, Hawkins C, Clarke ID, Squire JA, Bayani J, Hide T, et al. Identification of human brain tumour initiating cells. Nature. 2004;432(7015):396–401. - PubMed
    1. Antony H, Wiegmans AP, Wei MQ, Chernoff YO, Khanna KK, Munn AL. Potential roles for prions and protein-only inheritance in cancer. Cancer Metastasis Rev. 2012;31(1–2):1–19. - PMC - PubMed

LinkOut - more resources