. 2024 Dec 23;21(1):327.
doi: 10.1186/s12974-024-03314-1.

Accumulated BCAAs and BCKAs contribute to the HFD-induced deterioration of Alzheimer's disease via a dysfunctional TREM2-related reduction in microglial β-amyloid clearance

Affiliations

Accumulated BCAAs and BCKAs contribute to the HFD-induced deterioration of Alzheimer's disease via a dysfunctional TREM2-related reduction in microglial β-amyloid clearance

Yang Yang et al. J Neuroinflammation. .

Abstract

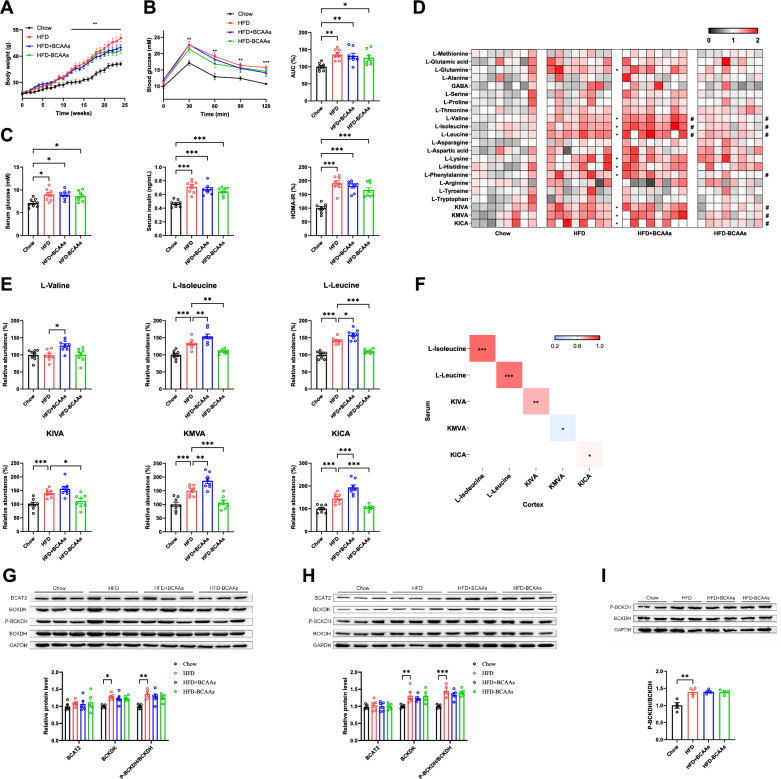
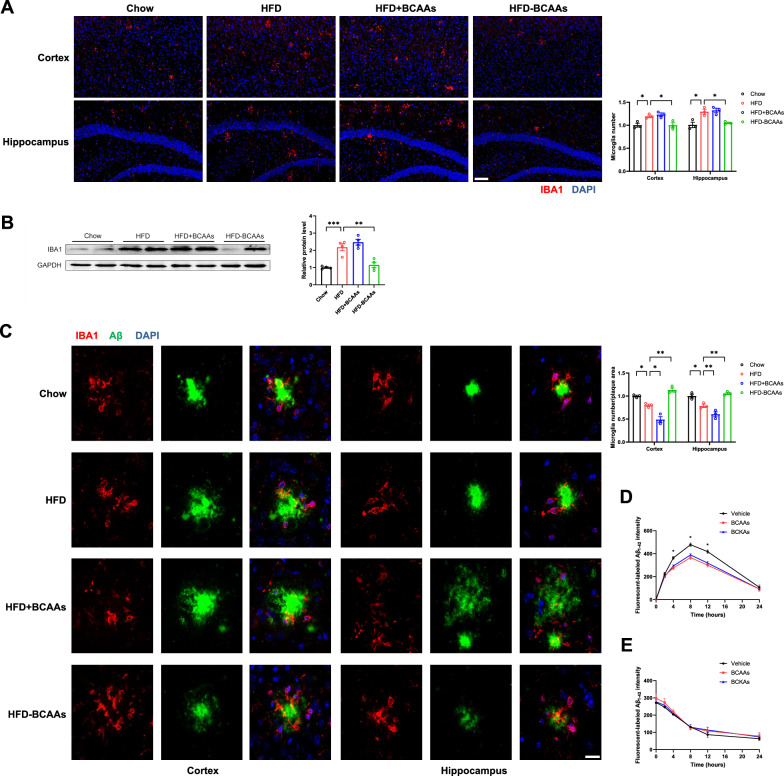
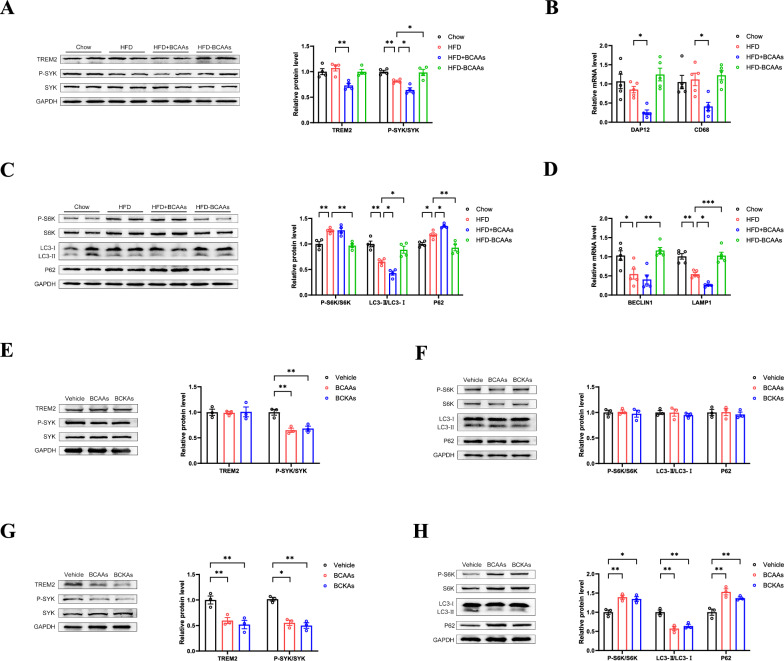
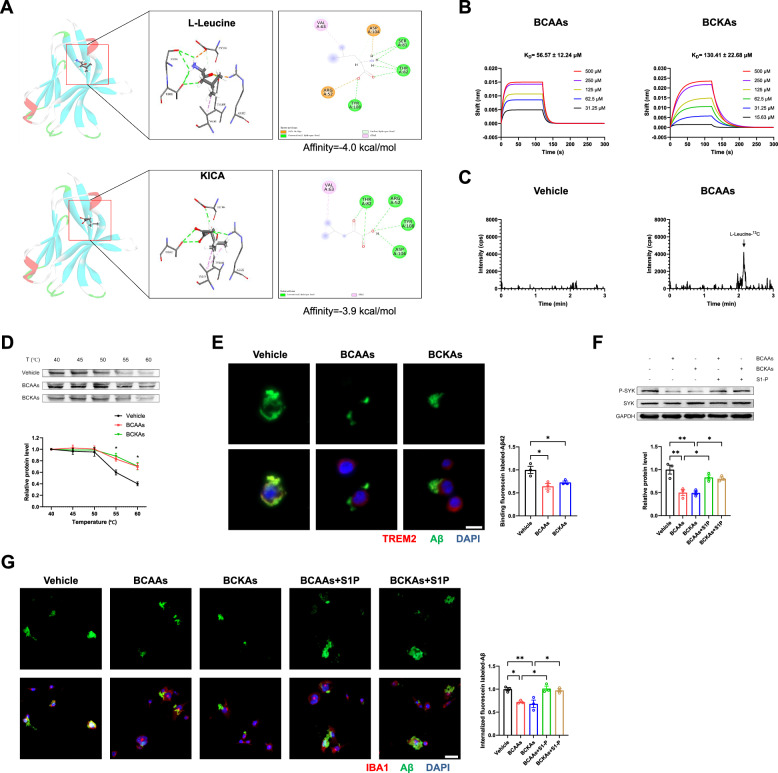
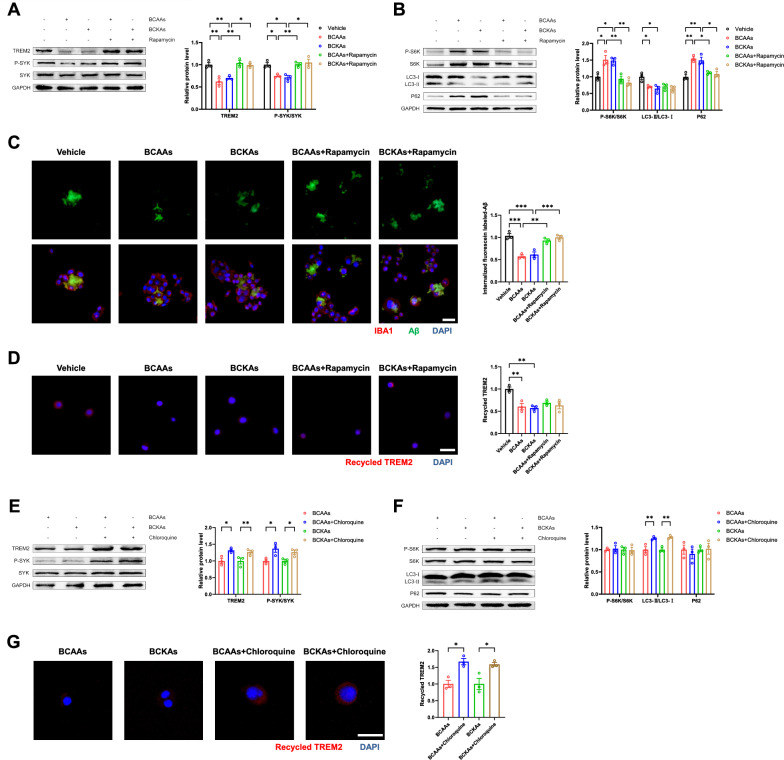
A high-fat diet (HFD) induces obesity and insulin resistance, which may exacerbate amyloid-β peptide (Aβ) pathology during Alzheimer's disease (AD) progression. Branched-chain amino acids (BCAAs) accumulate in obese or insulin-resistant patients and animal models. However, roles of accumulated BCAAs and their metabolites, branched-chain keto acids (BCKAs), in the HFD-induced deterioration of AD and the underlying mechanisms remains largely unclear. In this study, APPswe/PSEN1dE9 (APP/PS1) transgenic mice were fed a HFD for 6 months, and the BCAAs content of the HFD was adjusted to 200% or 50% to determine the effects of BCAAs. The HFD-fed APP/PS1 mice accumulated BCAAs and BCKAs in the serum and cortex, which was accompanied by more severe cognitive deficits and AD-related pathology. The additional or restricted intake of BCAAs aggravated or reversed these phenomena. Importantly, BCAAs and BCKAs repressed microglial phagocytosis of Aβ in vivo and in BV2 cells, which might be relevant for triggering receptor expressed on myeloid cells 2 (TREM2) dysfunction and autophagy deficiency. We found that BCAAs and BCKAs could bind to TREM2 in silico, in pure protein solutions and in the cellular environment. These molecules competed with Aβ for binding to TREM2 so that the response of TREM2 to Aβ was impaired. Moreover, BCAAs and BCKAs decreased TREM2 recycling in an mTOR-independent manner, which might also lead to TREM2 dysfunction. Our findings suggest that accumulated BCAAs and BCKAs contribute to the HFD-induced acceleration of AD progression through hypofunctional TREM2-mediated disturbances in Aβ clearance in microglia. Lowering BCAAs and BCKAs levels may become a potential dietary intervention for AD.

Keywords: Alzheimer’s disease; Amyloid-β; BCAAs; BCKAs; HFD; Insulin resistance; Microglia; TREM2.


Conflict of interest statement

Declarations. Ethics approval and consent to participate: All procedures of animals were approved by the Ethics Committee of Tongji Medical College of Huazhong University of Science and Technology (IACUC number: 2946), which complied with animal biomedical research principles formulated by the China Animal Care Committee and the Council of the International Medical Organization. Competing interests: The authors declare no competing interests.

Figures

Fig. 1
Fig. 1
HFD feeding induces insulin resistance and disruptes BCAAs catabolism in APP/PS1 mice. A Body weight of APP/PS1 mice during experiment period (n = 11 to 12). B Blood glucose levels in the glucose tolerance test (OGTT) and the area under the curve (AUC) of APP/PS1 mice (n = 8). C Fasting serum glucose and insulin levels, and corresponding HOMA-IR index of APP/PS1 mice (n = 8). D Heatmaps of the amino acid levels in serum of APP/PS1 mice in the indicated groups (n = 8). E Comparison of the levels of BCAAs and BCKAs in cerebral cortex (n = 8). F Heatmap analysis of the Spearman correlation of circulating and cortical levels of BCAAs and BCKAs. Western blot analysis of the levels of BCAAs catabolism-related protein in liver (G), skeletal muscle (H), and cerebral cortex (I), and the corresponding quantification results (n = 4–5). Data are means ± SEM. *P < 0.05,**P < 0.01 and ***P < 0.001, two-way or one-way ANOVA, followed by Tukey’s multiple comparisons test
Fig. 2
Fig. 2
BCAAs addition and restriction affect the development of cognitive deficits and AD-related pathology in HFD-fed APP/PS1 mice. A Escape latency to the platform during the training trails in a Morris water maze (n = 11 to 12). B Target (platform) entries in the probe test (n = 11 to 12). C Target quadrant entries in the probe test (n = 11 to 12). D Mean swimming speed of mice (n = 11 to 12). E Representative swimming tracks of mice in the probe test (n = 11 to 12). (F) Heatmap analysis of the Spearman correlation of cognitive function-related indexes and cortical levels of BCAAs and BCKAs (n = 8). G Western blot analysis of the protein levels of postsynaptic (PSD95) and presynaptic (synaptophysin) markers in cerebral cortex of mice, and the corresponding quantification results (n = 4). (H) Western blot analysis of the protein levels of Aβ secretase (BACE1) in cerebral cortex and the corresponding quantification results (n = 4). I Immunostainings of Aβ plaques by using specific antibody (6E10) in cortex and hippocampus (Scale bars, 200 μm), and quantitation of positive area rate (n = 3). Data are means ± SEM. *P < 0.05,**P < 0.01 and ***P < 0.001, two-way or one-way ANOVA, followed by Tukey’s multiple comparisons test
Fig. 3
Fig. 3
BCAAs and BCKAs contribute to microglial phagocytosis deficiency in HFD-fed APP/PS1 mice and BV2 cell. A Representative images of microglia (IBA1) staining in cortex and hippocampus of APP/PS1 mice (Scale bars, 100 μm), and corresponding quantitation of positive cell number (n = 3). B Western blot analysis of IBA1 levels in cortex, and the corresponding quantification results (n = 4). C Representative images of Aβ plaques (6E10) and microglia (IBA1) co-staining in cortex and hippocampus of APP/PS1 mice (Scale bars, 20 μm), and corresponding quantitation of positive cell number around plaque (n = 3). Microglial phagocytosis D and degradation E of fluorescein labeled-Aβ for the indicated time in BV2 cells in the presence or absence of BCAAs/ BCKAs (n = 3). Data are means ± SEM. *P < 0.05,**P < 0.01 and ***P < 0.001, one-way ANOVA, followed by Tukey’s multiple comparisons test
Fig. 4
Fig. 4
BCAAs and BCKAs impact the response of microglial TREM2 and autophagy to Aβ. A Western blot analysis of TREM2-related protein levels in cortex of APP/PS1 mice and the corresponding quantification results (n = 4). B Relative mRNA levels of DAP12 and CD68 in cortex (n = 5). C Western blot analysis of autophagy-related protein levels in cortex and the corresponding quantification results (n = 4). D Relative mRNA levels of BECLIN1 and LAMP1 in cortex (n = 5). Western blot analysis of TREM2-related E and autophagy-related F Protein levels in BV2 cell treated with or without BCAAs/ BCKAs for 4 h in the presence of Aβ and the corresponding quantification results (n = 3). Western blot analysis of TREM2-related G and autophagy-related H protein levels in BV2 cell treated with or without BCAAs/ BCKAs for 12 h in the presence of Aβ and the corresponding quantification results (n = 3). Data are means ± SEM. *P < 0.05,**P < 0.01 and ***P < 0.001, one-way ANOVA, followed by Tukey’s multiple comparisons test
Fig. 5
Fig. 5
BCAAs and BCKAs suppress TREM2 activation through binding to TREM2. A Molecular docking results of L-Leucine and KICA binding to TREM2 extracellular domain. B Biolayer interferometry (BLI) analysis of interaction of BCAAs or BCKAs with TREM2. BCAAs and BCKAs was titrated from 15.63 to 500 μM and 31.25 to 500 μM, respectively. C LC–MS/MS spectra of TREM2 immunoprecipitated L-Leucine-13C of BV2 cells after BCAAs isotope treatment for 1 h. D Thermal stabilization of TREM2 protein evaluated by cellular thermal shift assay (CETSA) after treating BV2 cells with BCAAs/ BCKAs for 4 h (n = 3). E Representative images of binding of fluorescein labeled-Aβ to cell surface TREM2 in BV2 cells after treatment of BCAAs/ BCKAs for 2 h (n = 3, Scale bars, 40 μm). F Representative images of microglial phagocytosis of fluorescein labeled-Aβ in BV2 cells after treatment of BCAAs/ BCKAs in the presence or absence of S1P for 4 h (n = 3, Scale bars, 40 μm). G Western blot analysis of phosphorylation levels of SYK in BV2 cell after treatment of BCAAs/ BCKAs in the presence or absence of sphingosine-1-phosphate (S1P) for 4 h (n = 3). Data in D, E, F and G are means ± SEM. *P < 0.05,**P < 0.01 and ***P < 0.001, one-way ANOVA, followed by Tukey’s multiple comparisons test
Fig. 6
Fig. 6
BCAAs and BCKAs reduce the expression and recycling of microglial TREM2 via inhibiting autophagy. Western blot analysis of TREM2-related A and autophagy-related B protein levels in BV2 cell after treatment of BCAAs/ BCKAs in the presence or absence of rapamycin for 12 h (n = 3). C Representative images of microglial phagocytosis of fluorescein labeled-Aβ in BV2 cells after treatment of BCAAs/ BCKAs in the presence or absence of rapamycin for 12 h (n = 3, Scale bars, 40 μm). D Representative images of TREM2 recycling in BV2 cells after treatment of BCAAs/ BCKAs in the presence or absence of rapamycin for 12 h (n = 3, Scale bars, 40 μm). Western blot analysis of TREM2-related E and autophagy-related F protein levels in BV2 cell after treatment of BCAAs/ BCKAs in the presence or absence of chloroquine for 12 h (n = 3). G Representative images of TREM2 recycling in BV2 cells after treatment of BCAAs/ BCKAs in the presence or absence of chloroquine for 12 h (n = 3, Scale bars, 40 μm). Data are means ± SEM. *P < 0.05,**P < 0.01 and ***P < 0.001, one-way ANOVA, followed by Tukey’s multiple comparisons test or Student’s t test

References

    1. Long JM, Holtzman DM. Alzheimer disease: an update on pathobiology and treatment strategies. Cell. 2019;179(2):312–39. - PMC - PubMed
    1. De Felice FG, Ferreira ST. Inflammation, defective insulin signaling, and mitochondrial dysfunction as common molecular denominators connecting type 2 diabetes to Alzheimer disease. Diabetes. 2014;63(7):2262–72. - PubMed
    1. Gudala K, Bansal D, Schifano F, Bhansali A. Diabetes mellitus and risk of dementia: a meta-analysis of prospective observational studies. J Diabetes Invest. 2013;4(6):640–50. - PMC - PubMed
    1. Selkoe DJ, Hardy J. The amyloid hypothesis of Alzheimer's disease at 25 years. EMBO Mol Med. 2016;8(6):595-608-08. - PMC - PubMed
    1. Guo Y, Wang Q, Chen S, Xu C. Functions of amyloid precursor protein in metabolic diseases. Metabolism. 2021;115: 154454. - PubMed

LinkOut - more resources