Comparative Study
. 2024 Dec 23;14(1):36.
doi: 10.1186/s13395-024-00368-w.

Comparative lipidomic and metabolomic profiling of mdx and severe mdx-apolipoprotein e-null mice

Affiliations
Comparative Study

Comparative lipidomic and metabolomic profiling of mdx and severe mdx-apolipoprotein e-null mice

Ram B Khattri et al. Skelet Muscle. .

Abstract

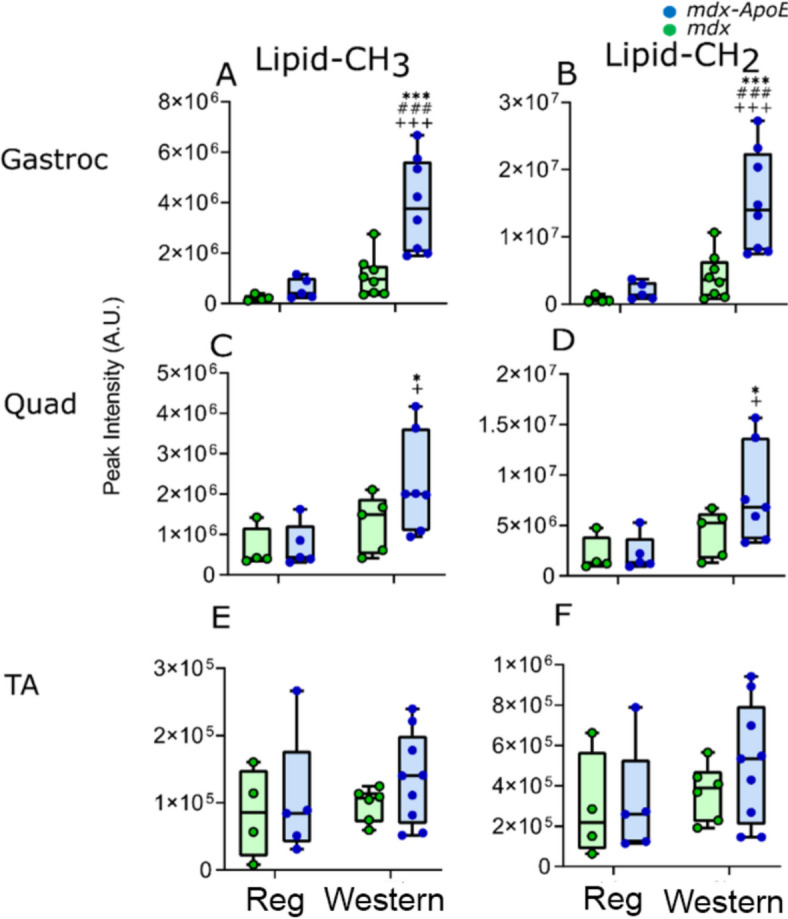
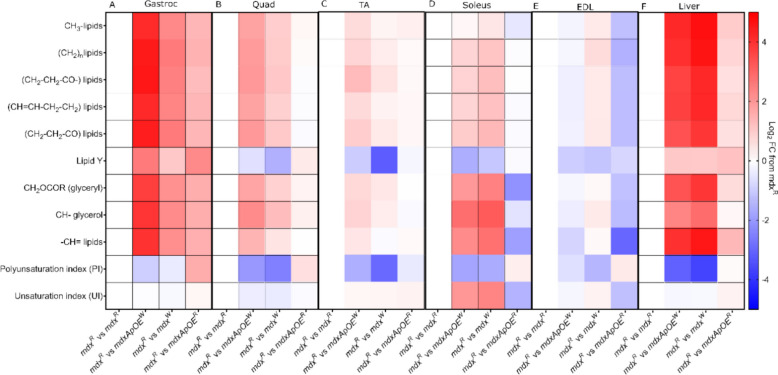
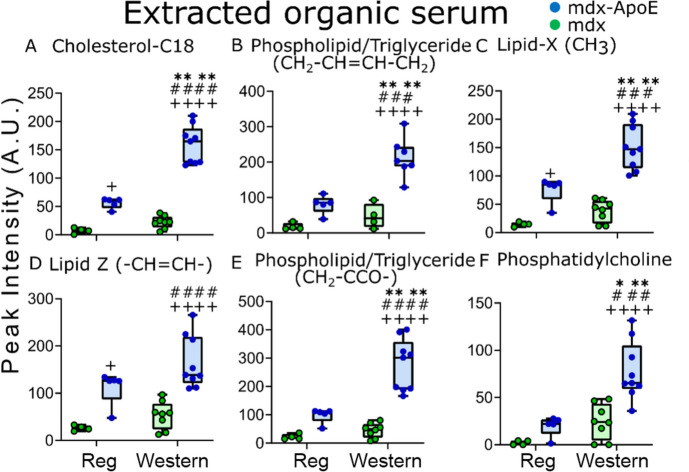
Despite its notoriously mild phenotype, the dystrophin-deficient mdx mouse is the most common model of Duchenne muscular dystrophy (DMD). By mimicking a human DMD-associated metabolic comorbidity, hyperlipidemia, in mdx mice by inactivating the apolipoprotein E gene (mdx-ApoE) we previously reported severe myofiber damage exacerbation via histology with large fibro-fatty infiltrates and phenotype humanization with ambulation dysfunction when fed a cholesterol- and triglyceride-rich Western diet (mdx-ApoEW). Herein, we performed comparative lipidomic and metabolomic analyses of muscle, liver and serum samples from mdx and mdx-ApoEW mice using solution and high-resolution-magic angle spinning (HR-MAS) 1H-NMR spectroscopy. Compared to mdx and regular chow-fed mdx-ApoE mice, we observed an order of magnitude increase in lipid deposition in gastrocnemius muscle of mdx-ApoEW mice including 11-fold elevations in -CH3 and -CH2 lipids, along with pronounced elevations in serum cholesterol, fatty acid, triglyceride and phospholipids. Hepatic lipids were also elevated but did not correlate with the extent of muscle lipid infiltration or differences in serum lipids. This study provides the first lipometabolomic signature of severe mdx lesions exacerbated by high circulating lipids and lends credence to claims that the liver, the main regulator of whole-body lipoprotein metabolism, may play only a minor role in this process.

Keywords: Duchenne; Fibrofatty infiltration; HR-MAS; Liver; Metabolism; Muscle; NMR.


Conflict of interest statement

Declarations. Ethics approval and consent to participate: This study was approved by the University of Florida (Gainesville, FL) and University of British Columbia Institutional Animal Care and Use Committees. Consent for publication: Not applicable. Competing interests: The authors declare no competing interests.

Figures

Fig. 1
Fig. 1
Representative Mason’s trichrome image of severely affected gastrocnemius muscle from Western diet (W)-fed mdx and mdx-ApoE KO mice, scale bar 1 mm. HR-MAS spectra for gastrocnemius, quadriceps and tibialis anterior muscle samples (aliphatic region) showing lipids and small metabolites resonance for four different groups: (1) mdx-ApoEW (brown; A, E, & I), (2) mdx-ApoER (blue; B, F, & J), (3) mdxR (black; C, G, & K), and (4) mdxW (green; D, H, & L)
Fig. 2
Fig. 2
Box and Whisker plots showing relative abundance of lipid CH3 and lipid CH2 in gastrocnemius (Gastroc), quadriceps(Quad), and tibialis anterior muscles (TA) via 1H HR-MAS spectra. Significance was determined by two way ANOVA with “p” = 0.05 − 0.01, “p” ≤ 0.05 is denoted with “*”/”#”/”+”, “p” between 0.01 − 0.001 is denoted with “**”/”##”/”++”, and “p” ≤ 0.001 is denoted with “***”/”###”/”+++”. “Asterisks” means significantly different within the same strain, “hash tag” means significantly different than the other strain within the regular (Reg) diet group, and “plus” means significantly different than the other high-fat Western diet strain. Numbers were mdx-ApoER (n = 5), mdx-ApoEW (n = 7–9), mdxR (n = 4), and mdxW (n = 5–8)
Fig. 3
Fig. 3
Heatmap representing the log2-transformed fold changes with respect to mdxR group for few lipid classes in six tissue samples obtained via 1H HR-MAS spectra. A Gastroc, B Quad, C TA, D Soleus, E EDL, and F Liver. The number of samples per group were as follows: mdx-ApoER (n = 5), mdx-ApoEW(n = 7–9), mdxR(n = 4), and mdxW(n = 5–8). Gastroc: gastrocnemius, quad: quadriceps, TA: tibialis anterior, EDL: extensor digitorum longus, and FC: fold-change
Fig. 4
Fig. 4
Representative Box and Whisker plots (with error bars) for lipid components obtained from 1H NMR spectra of organic phase extract of serum for four diet-dependent groups of mdx mice: A Cholesterol/cholesterol ester (CH3, C18), B Phospholipid/Triglyceride (-CH2-CH=CH-CH2), C Fatty acids (terminal CH3), D Fatty acids (-CH=CH-) E Phospholipid/Triglyceride (CH2-CCO-), and F Phosphatidylcholine (N+(CH3)3). Significance was determined by two way ANOVA with “p” = 0.05-0.01, “p” ≤ 0.05 is denoted with “*”/”#”/”+”, “p”≤ 0.001 is denoted with “***”/”###”/”+++”, and “p” ≤ 0.0001 is denoted with “****”/”####”/”++++”. “Asterisk/s” means significantly different within the same strain, “hash tag” means significantly different than the other strain within the regular diet group, and “plus” means significantly different than the other high-fat diet strain. The number of samples per group were as follows: -ApoER (n=5), mdx-ApoEW(n=9), mdxR(n=4), and mdxW(n=8)
Fig. 5
Fig. 5
1H NMR metabolomics profiles for four diet-dependent groups of mdx mice for organic phase sera samples obtained from: A principal component analysis B Partial least square discriminant analysis. mdx-ApoER (red), mdx-ApoEW(green), mdxR (blue), and mdxW (cyan). Number of samples per group were as follows: mdx-ApoER (n = 5), mdx-ApoEW(n = 9), mdxR(n = 4), and mdxW(n = 8). PC: principal component
Fig. 6
Fig. 6
Heat maps representing the log2-transformed fold changes compared with the mdxR group for organic and aqueous phase serum samples obtained via 1D 1H NOESY spectra. A organic phase, B aqueous phase. FC: fold-change

References

    1. Lee-McMullen B, Chrzanowski SM, Vohra R, Forbes SC, Vandenborne K, Edison AS, Walter GA. Age-dependent changes in metabolite profile and lipid saturation in dystrophic mice. NMR Biomed. 2019;32(5):e4075. - PMC - PubMed
    1. Perry C, Lawrence A. Hurdles in Basic Science Translation. Front Pharmacol. 2017;8:478. - PMC - PubMed
    1. McGreevy JW, Hakim CH, McIntosh MA, Duan D. Animal models of Duchenne muscular dystrophy: from basic mechanisms to gene therapy. Dis Model Mech. 2015;8(3):195–213. - PMC - PubMed
    1. Sicinski P, Geng Y, Ryder-Cook AS, Barnard EA, Darlison MG. Barnard P.J. The molecular basis of muscular dystrophy in the (mdx) mouse. A point mutation. Science. 1989;244:1578–80. - PubMed
    1. Townsend D, Yasuda S, Metzger J. Cardiomyopathy of Duchenne muscular dystrophy: pathogenesis and prospect of membrane sealants as a new therapeutic approach. Expert Rev Cardiovasc Ther. 2007;5(1):99–109. - PubMed

Publication types

MeSH terms

Substances

LinkOut - more resources