. 2025 Jun 28;17(1):mjae054.
doi: 10.1093/jmcb/mjae054.

Inhibition of EphA2 by syndecan-4 in wounded skin regulates clustering of fibroblasts

Affiliations

Inhibition of EphA2 by syndecan-4 in wounded skin regulates clustering of fibroblasts

Rebecca Brooks et al. J Mol Cell Biol. .

Abstract

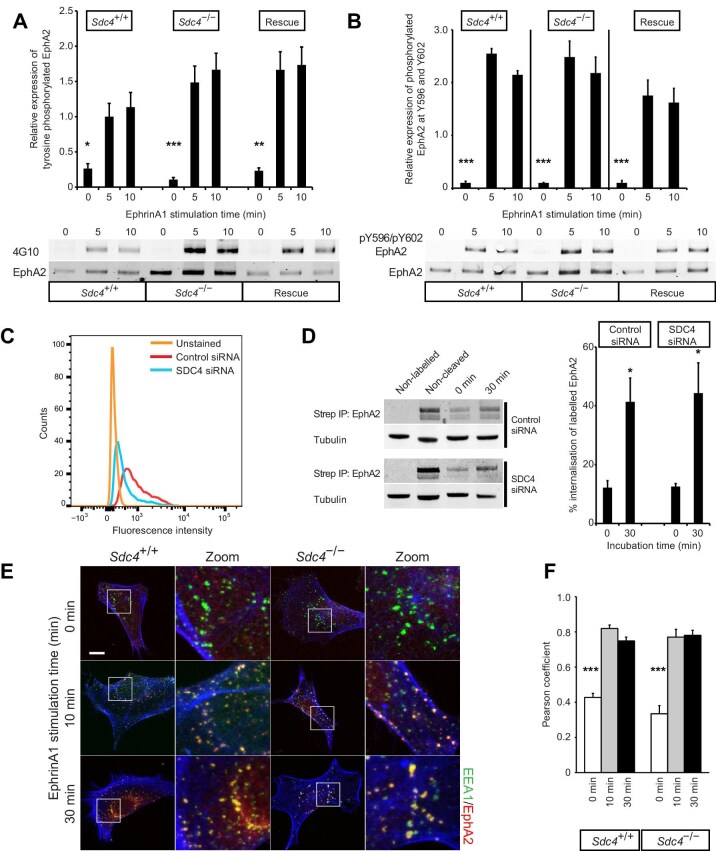
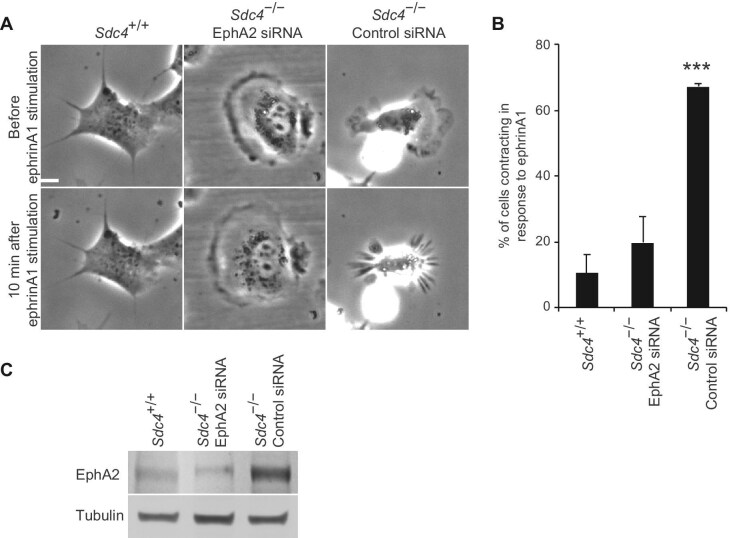
Upon injury, fibroblasts in the surrounding tissue become activated, migrating into the wound in a controlled manner. Once they arrive, they contract the wound and remodel the stroma. While certain cell surface receptors promote fibroblast migration, others cause repulsion between fibroblasts upon contact, seemingly opposing their clustering within the wound bed. Eph receptor-ephrin interactions on colliding cells trigger this repulsion, but how fibroblasts transition to clustering behaviour during healing remains unclear. Syndecan-4 modulates transmembrane receptors involved in wound healing, including receptors for the extracellular matrix and growth factors. As a result, Sdc4-/- mice experience delayed healing due to impaired fibroblast recruitment. In this study, we report that syndecan-4 also regulates fibroblast repulsion during wound healing. We discover that syndecan-4 inhibits the expression and signalling of EphA2 by activating PKCα. Changes in syndecan-4 expression, such as those observed during wound healing, alter fibroblast behaviour from repulsion to adhesion upon cell collision by modulating EphA2 levels. Moreover, we find that EphA2 expression is suppressed in wound bed fibroblasts in a syndecan-4-dependent manner, explaining how fibroblast clustering is achieved during wound healing.

Keywords: EphA2; cell migration; receptor crosstalk; syndecan-4; wound healing.


Figures

Figure 1
Figure 1
Expression of EphRs and cell repulsion are increased in the absence of SDC4. (A) Representative collisions between MEFs seeded on 5-μm fibronectin stripes (see Supplementary Videos S1 and S2). (B) Collisions were scored as ‘following’ if cells moved in the same direction after collision or ‘repulsion’ if cells moved in opposite directions (n = 29). (C) Collisions, in the presence of 20 ng/ml TGFβ, were scored (n = 34). (DF) qPCR analysis of EphR and ephrin expression levels. Histograms depict fold changes relative to Sdc4+/+ MEFs from a representative experiment, with n = 3 and experiments repeated up to 5 times. (GI) Western blot analysis of EphA2 (G, n = 3), EphA3 (H, n = 3), and EphA4 (I, n = 4) protein levels. (J and K) qPCR analysis of SDC4 and EphA2 mRNA levels (J, n = 8) and western blot analysis of EphA2 protein level (K, n = 3) in MEFs transfected with non-targeting (Control) or SDC4-targeting (SDC4) siRNA. Error bars represent standard error; significance tested by analysis of variance (ANOVA); *P < 0.05, **P < 0.005, ***P < 0.0005.
Figure 2
Figure 2
Reciprocal relationship between expression of SDC4 and surface expression of EphA2. (A and B) MEFs were surface-labelled with biotin before immunoprecipitating EphA2 and probing with fluorophore-conjugated streptavidin (A, n = 3) or precipitating biotinylated proteins and blotting for EphA2 (B, n = 7). (CE) SDC4 was overexpressed in MEFs via retroviral infection with the SDC4 cDNA, using empty vector as a negative control. (C) SDC4 expression in infected MEFs by flow cytometry. (D) Western blot analysis of EphA2 protein levels in cell lysates (n = 10). (E) Surface EphA2 protein levels by immunoprecipitating EphA2 from MEFs surface-labelled with biotin and probing with fluorophore-conjugated streptavidin (n = 5). Error bars represent standard error; significance tested by ANOVA; *P < 0.05, **P < 0.005, ***P < 0.0005.
Figure 3
Figure 3
Phosphorylation and endocytosis of EphA2 increase proportionally to expression. (A and B) MEFs were stimulated with 1 μg/ml clustered ephrinA1-Fc, followed by western blot analysis using antibody 4G10 for total phosphotyrosine (A, n = 4) or an antibody against EphA2 residues Y596 and Y602 (B, n = 4). Histograms represent phosphorylation levels normalised to EphA2. (C and D) EphA2 endocytosis in fibroblasts transfected with non-targeting (Control) or SDC4-targeting (SDC4) siRNA. (C) Flow cytometry analysis of SDC4 expression. (D) Fibroblasts were surface-labelled with biotin and stimulated with 1 μg/ml clustered ephrinA1-Fc. The internalised proteins were precipitated with streptavidin before blotting for EphA2 (n = 6). (E and F) MEFs were stimulated with 1 μg/ml clustered ephrinA1-Fc before fixation and staining (see also Supplementary Figure S1). (E) Representative images of MEFs stained for EEA1 (green), EphA2 (red), and counterstained with phalloidin (blue). Scale bar, 10 μm. (F) Pearson correlation analysis for colocalization between EphA2 and EEA1 (n = 10). Error bars represent standard error; significance tested by ANOVA; *P < 0.05, **P < 0.005, ***P < 0.0005.
Figure 4
Figure 4
Sdc4 –/– MEFs contract in response to ephrinA1. Sdc4+/+ and Sdc4–/– MEFs transfected with either non-targeting (Control) or EphA2-targeting (EphA2) siRNA were spread on 5 μg/ml fibronectin-coated dishes and stimulated with 1 μg/ml clustered ephrinA1-Fc. (A) Representative frames before and after the addition of ephrinA1-Fc (see Supplementary Videos S3–S5). Scale bar, 20 μm. (B) Percentage of cells that contracted upon the addition of ephrinA1-Fc. The histogram represents the average of 3 experiments, with a total of 47 cells of each type scored. (C) Western blot analysis of EphA2 expression in cells used for the contraction assay and subsequent migration assay. Error bars indicate standard error; significance tested by ANOVA; ***P < 0.0005.
Figure 5
Figure 5
SDC4 regulates EphA2 expression by activation of PKCα. (A) SDC4 cytodomain indicating the functions of residues to be tested. (BF) Western blot analysis of EphA2 protein levels in Sdc4+/+ MEFs, Sdc4–/– MEFs, and Sdc4–/– MEFs stably rescued with the indicated SDC4 cDNAs (B, n = 5), Sdc4+/+ (C, n = 10) and Sdc4–/– (D, n = 4) MEFs treated daily with indicated concentrations of PMA for 5 days, Sdc4+/+ MEFs treated daily with indicated concentrations of the PKCα inhibitor, BIM-1, for 5 days (E, n = 6), and Sdc4+/+ MEFs transfected with control or PKCα-targeting siRNA (F, n = 6). Error bars represent standard error; significance tested by ANOVA; *P < 0.05, **P < 0.005, ***P < 0.0005.
Figure 6
Figure 6
Homotypic repulsion of Sdc4–/– MEFs is due to high EphA2 expression. (A) Representative collisions between Sdc4+/+ (n = 93) and Sdc4–/– MEFs transfected with either non-targeting (Control, n = 78) or EphA2-targeting (EphA2, n = 14) siRNA (see Supplementary Videos S6–S8). (B) Collisions were scored as ‘following’ or ‘repulsion’. (C) Time before both nuclei made a retrograde step post-collision. Boxes indicate median and 1st and 3rd quartiles and whiskers indicate data range. Significance tested by ANOVA; *P < 0.05.
Figure 7
Figure 7
EphA2 expression in the fibroblasts of wounded skin is regulated by SDC4. (A and B) In mouse wound healing model, 4-mm full-thickness wounds were created on the backs of mice, and wound areas were recorded macroscopically. (CE) qPCR analysis of EphA2 mRNA expression levels, relative to 18S internal control, in the bed of full-thickness skin wounds. Shown are relative expression changes over time in Sdc4+/+ (C) and Sdc4–/– (D) mice and direct comparison between two genotypes at 72 h (E) or 0 h (F) post-wounding (n = 9). Error bars represent standard error; significance tested by ANOVA; *P < 0.05.

Similar articles

Cited by

References

    1. Astin J.W., Batson J., Kadir S. et al. (2010). Competition amongst Eph receptors regulates contact inhibition of locomotion and invasiveness in prostate cancer cells. Nat. Cell Biol. 12, 1194–1204. - PubMed
    1. Barrientos S., Brem H., Stojadinovic O. et al. (2014). Clinical application of growth factors and cytokines in wound healing. Wound Repair Regen. 22, 569–578. - PMC - PubMed
    1. Bass M.D., Morgan M.R., Roach K.A. et al. (2008). p190RhoGAP is the convergence point of adhesion signals from α5β1 integrin and syndecan-4. J. Cell Biol. 181, 1013–1026. - PMC - PubMed
    1. Bass M.D., Roach K.A., Morgan M.R. et al. (2007). Syndecan-4-dependent Rac1 regulation determines directional migration in response to the extracellular matrix. J. Cell Biol. 177, 527–538. - PMC - PubMed
    1. Bass M.D., Williamson R.C., Nunan R.D. et al. (2011). A syndecan-4 hair trigger initiates wound healing through caveolin- and RhoG-regulated integrin endocytosis. Dev. Cell 21, 681–693. - PMC - PubMed