. 2025 May 22;16(11):mjae056.
doi: 10.1093/jmcb/mjae056.

DNAJC12 downregulation induces neuroblastoma progression via increased histone H4K5 lactylation

Affiliations

DNAJC12 downregulation induces neuroblastoma progression via increased histone H4K5 lactylation

Yaqi Yang et al. J Mol Cell Biol. .

Abstract

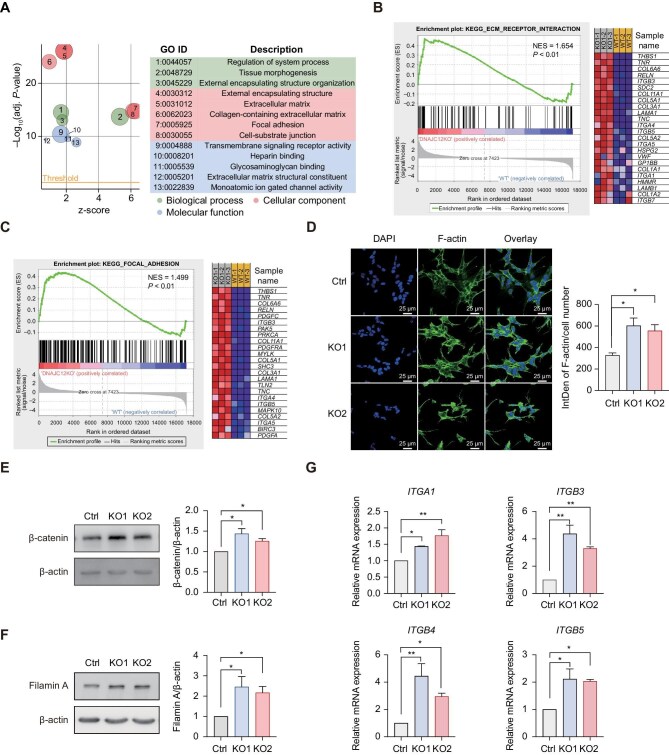
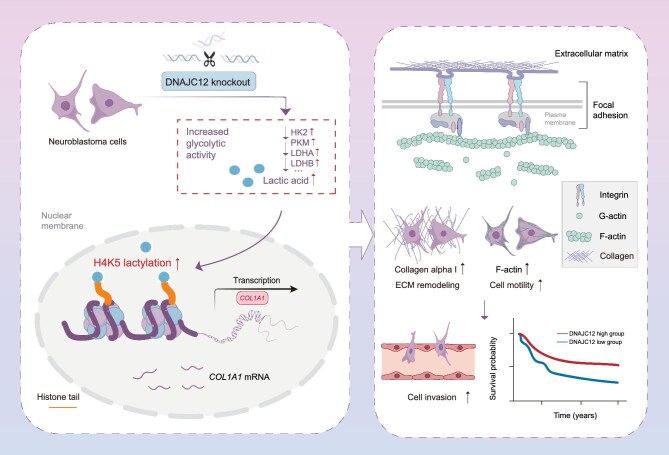
Neuroblastoma (NB) is the most common extracranial solid tumor in children. Despite treatment advances, the survival rates of high-risk NB patients remain low. This highlights the urgent need for a deeper understanding of the molecular mechanisms driving NB progression to support the development of new therapeutic strategies. In this study, we demonstrated that the reduced levels of DNAJC12, a protein involved in metabolic regulation, are associated with poor prognosis in NB patients. Our data indicate that low DNAJC12 expression activates glycolysis in NB cells, leading to increased lactic acid production and histone H4 lysine 5 lactylation (H4K5la). Elevated H4K5la upregulates the transcription of COL1A1, a gene implicated in cell metastasis. Immunohistochemistry staining of NB patient samples confirmed that high H4K5la levels correlate with poor clinical outcomes. Furthermore, we showed that inhibiting glycolysis, reducing H4K5la, or targeting COL1A1 can mitigate the invasive behavior of NB cells. These findings reveal a critical link between metabolic reprogramming and epigenetic modifications in the context of NB progression, suggesting that H4K5la could serve as a novel diagnostic and prognostic marker, and shed light on identifying new therapeutic targets within metabolic pathways for the treatment of this aggressive pediatric cancer.

Keywords: COL1A1; DNAJC12; biomechanical force; histone H4K5 lactylation; neuroblastoma.


Figures

Figure 1
Figure 1
Low DNAJC12 expression promotes NB cell proliferation and invasion, correlating with poor prognosis in NB patients. (A) Kaplan–Meier survival analysis of 279 NB patients from the TARGET database, stratified by DNAJC12 expression levels. Survival differences between high- and low-expression groups were analyzed using the log-rank test. (B) DNAJC12 KO SH-SY5Y cells were generated using CRISPR/Cas9, with complementation of DNAJC12 achieved via lentiviral transfection. DNAJC12 protein levels were assessed by immunoblotting, and the relative band intensity was quantified using ImageJ, normalized to that of β-actin, and expressed as the fold change relative to control (wild-type) cells. (C) Cell proliferation rates of DNAJC12 KO and complemented SH-SY5Y cells were measured via BrdU chemiluminescent assays and compared with those of control cells. (D) Cell invasion was assessed in DNAJC12 KO and complemented SH-SY5Y cells via Transwell assays, and the number of invaded cells was quantified. Scale bar, 10 μm. The data are presented as mean ± SEM from three independent experiments. Statistical significance was determined via two-tailed Student's t-test (*P < 0.05; **P < 0.01).
Figure 2
Figure 2
Low DNAJC12 expression enhances NB cell invasion by activating signaling related to biomechanical force. (A) GO analysis for pathways enriched in DNAJC12 KO1 SH-SY5Y cells. (B and C) GSEA of genes related to ECM receptor interaction (B) and focal adhesion (C) was performed on 3 independent RNA-seq datasets from control and DNAJC12 KO1 SH-SY5Y cells. (D) Immunofluorescence staining showing a significant increase in F-actin levels in DNAJC12 KO SH-SY5Y cells. The average fluorescence intensity per cell was quantified using ImageJ. Scale bar, 25 μm. (E and F) The protein levels of β-catenin and Filamin A, normalized to β-actin. (G) The mRNA levels of integrins involved in ECM receptor interaction and focal adhesion in control and DNAJC12 KO SH-SY5Y cells were quantified by qPCR. The data are presented as mean ± SEM from three independent experiments. Statistical significance was determined via two-tailed Student's t-test (*P < 0.05; **P < 0.01).
Figure 3
Figure 3
Low DNAJC12 expression enhances NB cell invasion and signaling related to biomechanical force through the activation of glycolysis. (A) Heatmap showing the metabolomic profiles of control and DNAJC12 KO1 SH-SY5Y cells, highlighting 17 metabolites with significantly altered abundance. (B) Lactic acid levels in control and DNAJC12 KO1 SH-SY5Y cells were measured via MS-based metabolomics. (C) Intracellular lactic acid concentrations were quantified via an L-lactic acid colorimetric assay. (D) GSEA of glycolysis-related genes was performed on three independent RNA-seq datasets from control and DNAJC12 KO1 cells. (E) The mRNA levels of key glycolytic enzymes (HK2, PKM, PFKM, LDHA, and LDHB) in control and DNAJC12 KO1 SH-SY5Y cells. (F) Intracellular lactic acid concentrations in DNAJC12 KO1 SH-SY5Y cells treated with DMSO or the LDHA inhibitor GNE-140 (10 μM). (G) Immunofluorescence staining of F-actin in DNAJC12 KO1 SH-SY5Y cells treated with or without GNE-140 (10 μM). Scale bar, 25 μm. (H) The invasion ability of DNAJC12 KO1 SH-SY5Y cells treated with or without GNE-140. Scale bar, 10 μm. The data are presented as mean ± SEM from three independent experiments. Statistical significance was determined via two-tailed Student's t-test (*P < 0.05; **P < 0.01; ***P < 0.001; ****P < 0.0001).
Figure 4
Figure 4
Low DNAJC12 expression enhances NB cell invasion via histone lactylation. (A) Pan-lactylation (Pan-Kla) levels in control and DNAJC12 KO SH-SY5Y cells, normalized to GAPDH. (B) H4K5la modification levels in control and DNAJC12 KO SH-SY5Y cells. (C) IHC staining of H4K5la modification in NB tumor tissues, with IHC scores and patient prognosis (n = 18) shown in the right panel. Scale bar, 100 μm. (D) IHC staining of H4K5la modification in primary tumor tissues and vascular metastasis tissues. Scale bar, 100 μm. The data are presented as mean ± SEM from three independent experiments. Statistical significance was determined using two-tailed Student's t-test (*P < 0.05; **P < 0.01; ****P < 0.0001).
Figure 5
Figure 5
Regulation of H4K5la modification by SIRT2 and p300/CBP in NB cells. (A) H4K5la modification levels in DNAJC12 KO1 SH-SY5Y cells with or without transient overexpression of wild-type (SIRT2OE) or mutant (SIRT2Q167A) SIRT2 plasmids, normalized to H4 and GAPDH. (B) Intracellular lactic acid concentrations in DNAJC12 KO1 SH-SY5Y cells with or without transient overexpression of SIRT2OE or SIRT2Q167A plasmids. (C) Cell proliferation rates in DNAJC12 KO1 SH-SY5Y cells with or without transient overexpression of SIRT2OE or SIRT2Q167A plasmids. (D) The invasion ability of DNAJC12 KO1 SH-SY5Y cells with or without transient overexpression of SIRT2OE or SIRT2Q167A plasmids. Scale bar, 10 μm. (EI) DNAJC12 KO1 SH-SY5Y cells were treated with the p300/CBP inhibitor anacardic acid (AA, 10 μM). H4K5la levels (E), intracellular lactic acid concentrations (F), cell proliferation rates (G), F-actin amounts (H; scale bar, 25 μm), and cell invasion capability (I; scale bar, 10 μm) were measured. The data are presented as mean ± SEM from three independent experiments. Statistical significance was determined using two-tailed Student's t-test (*P < 0.05; **P < 0.01; ns, not significant).
Figure 6
Figure 6
H4K5la modification activates COL1A1 gene transcription. (A) Venn diagram showing genes uniquely identified by the anti-H4K5la antibody in wild-type and DNAJC12 KO1 SH-SY5Y cells. (B) Donut chart illustrating the genomic distribution of peaks identified by the anti-H4K5la antibody in wild-type and DNAJC12 KO1 SH-SY5Y cells. Promoters are defined as regions ± 2 kb from the TSS (in the RefSeq database). (C) Anchor plot of H4K5la ChIP–seq signals around TSSs in wild-type and DNAJC12 KO1 SH-SY5Y cells. (D) GO analysis for the pathways enriched with genes significantly altered expression upon DNAJC12 knockout and were specifically recognized by the anti-H4K5la antibody in DNAJC12 KO1 SH-SY5Y cells. (E) Genome browser view of H4K5la signals in the COL1A1 gene promoter region in DNAJC12 KO1 SH-SY5Y cells. (F) ChIP–qPCR analysis of H4K5la occupancy at the COL1A1 promoter in control and DNAJC12 KO1 SH-SY5Y cells. (G) COL1A1 mRNA levels in control and DNAJC12 KO1 SH-SY5Y cells. The data represent mean ± SEM from three independent experiments. Statistical significance was determined via two-tailed Student's t-test (*P < 0.05).
Figure 7
Figure 7
H4K5la modification promotes NB cell invasion by activating COL1A1 transcription. (A) The viability of DNAJC12 KO1 SH-SY5Y cells transfected with or without COL1A1 siRNA. (B) COL1A1 mRNA levels in DNAJC12 KO1 SH-SY5Y cells transfected with or without COL1A1 siRNA. (C and D) Type I collagen α1 chain protein (C) and H4K5la (D) levels in DNAJC12 KO1 SH-SY5Y cells transfected with or without COL1A1 siRNA, normalized to β-actin. (E) The invasion ability of DNAJC12 KO1 SH-SY5Y cells transfected with or without COL1A1 siRNA. Scale bar, 10 μm. (F) The viability of DNAJC12 KO1 cells treated with DMSO or the type I collagen inhibitor halofuginone (100 nM). (G) COL1A1 mRNA levels in DNAJC12 KO1 cells treated with or without Halofuginone (100 nM). (H and I) Type I collagen α1 chain protein (H) and H4K5la (I) levels in DNAJC12 KO1 SH-SY5Y cells treated with or without halofuginone (100 nM), normalized to β-actin. (J) Invasion ability of DNAJC12 KO1 SH-SY5Y cells treated with or without halofuginone (100 nM). Scale bar, 10 μm. The data are presented as mean ± SEM from three independent experiments. Statistical significance was determined via two-tailed Student's t-test (*P < 0.05; **P < 0.01; ****P < 0.0001; ns, not significant).
Figure 8
Figure 8
Schematic presentation of the DNAJC12’s role in driving NB progression via metabolic and epigenetic regulation. DNAJC12 downregulation in NB cells enhances glycolysis, subsequently increasing lactate production and histone H4K5la modification. This modification upregulates COL1A1 expression, which promotes metastatic potential by activating biomechanical force.

Similar articles

Cited by

References

    1. Acun T., Doberstein N., Habermann J.K. et al. (2017). HLJ1 (DNAJB4) gene is a novel biomarker candidate in breast cancer. OMICS 21, 257–265. - PMC - PubMed
    1. Anikster Y., Haack T.B., Vilboux T. et al. (2017). Biallelic mutations in DNAJC12 cause hyperphenylalaninemia, dystonia, and intellectual disability. Am. J. Hum. Genet. 100, 257–266. - PMC - PubMed
    1. Bresler S.C., Wood A.C., Haglund E.A. et al. (2011). Differential inhibitor sensitivity of anaplastic lymphoma kinase variants found in neuroblastoma. Sci. Transl. Med. 3, 108ra114. - PMC - PubMed
    1. Chung C., Sweha S.R., Pratt D. et al. (2020). Integrated metabolic and epigenomic reprograming by H3K27M mutations in diffuse intrinsic pontine gliomas. Cancer Cell 38, 334–349.e9. - PMC - PubMed
    1. Comba A., Faisal S.M., Dunn P.J. et al. (2022). Spatiotemporal analysis of glioma heterogeneity reveals COL1A1 as an actionable target to disrupt tumor progression. Nat. Commun. 13, 3606. - PMC - PubMed