. 2025 Feb;301(2):108119.
doi: 10.1016/j.jbc.2024.108119. Epub 2024 Dec 22.

ID3 promotes erythroid differentiation and is repressed by a TAL1-PRMT6 complex

Affiliations

ID3 promotes erythroid differentiation and is repressed by a TAL1-PRMT6 complex

Vivien Heller et al. J Biol Chem. 2025 Feb.

Abstract

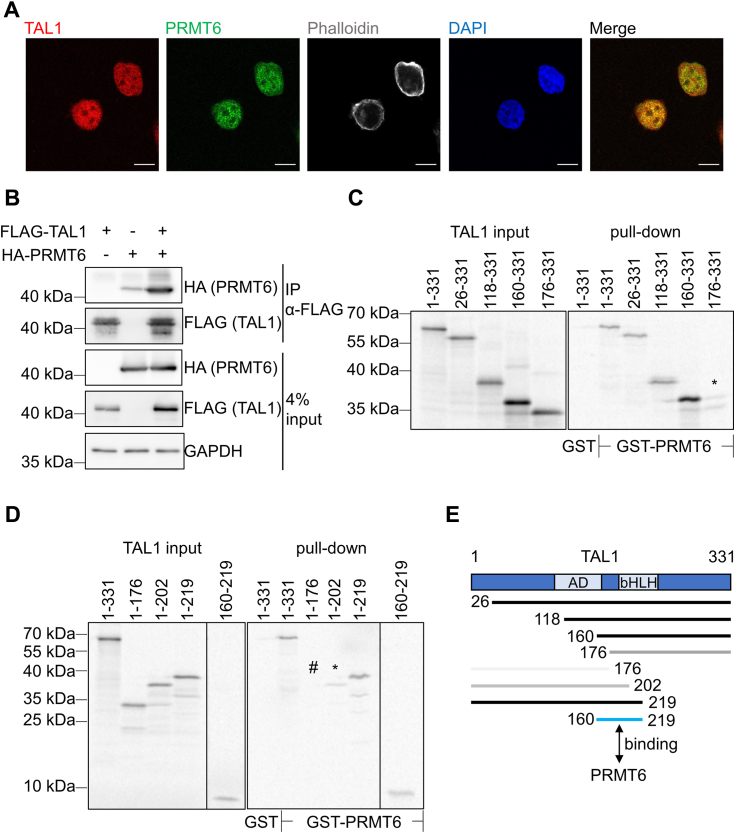
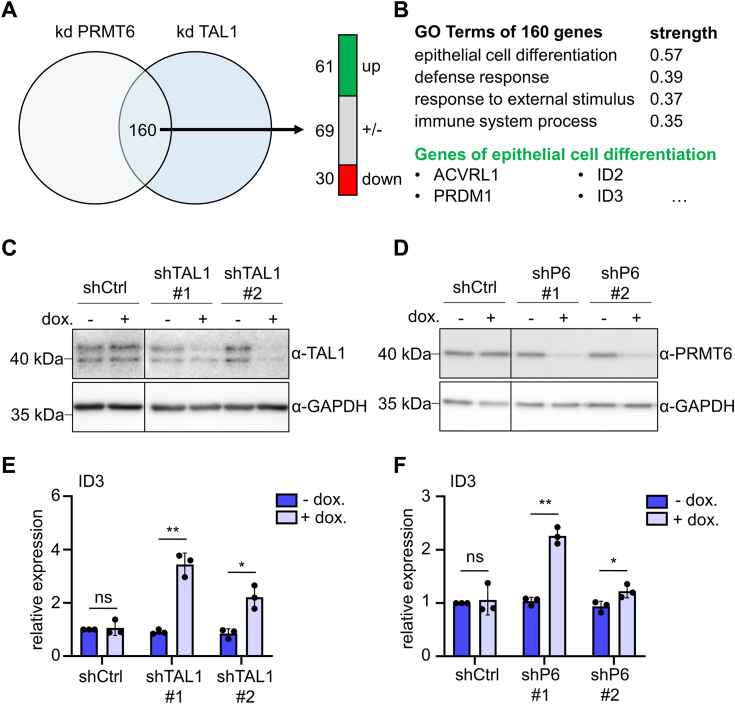
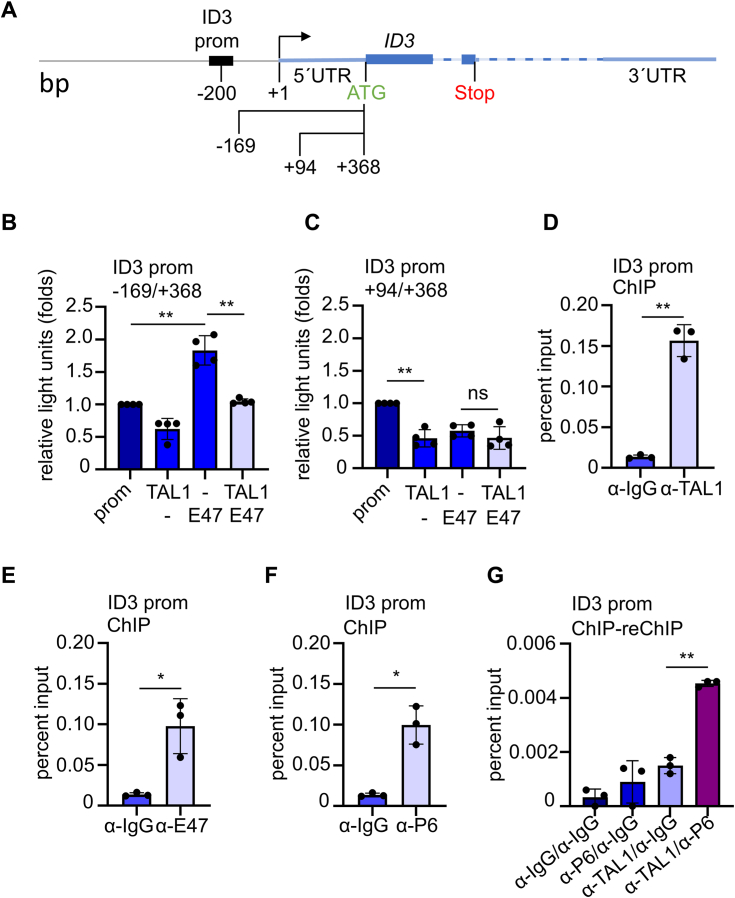
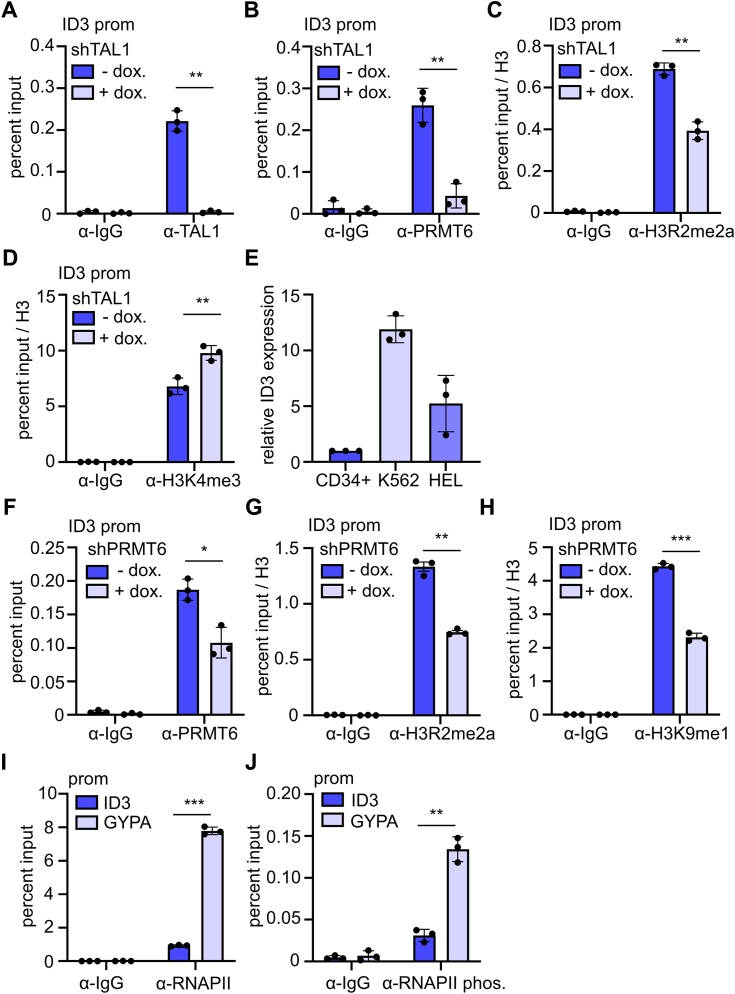
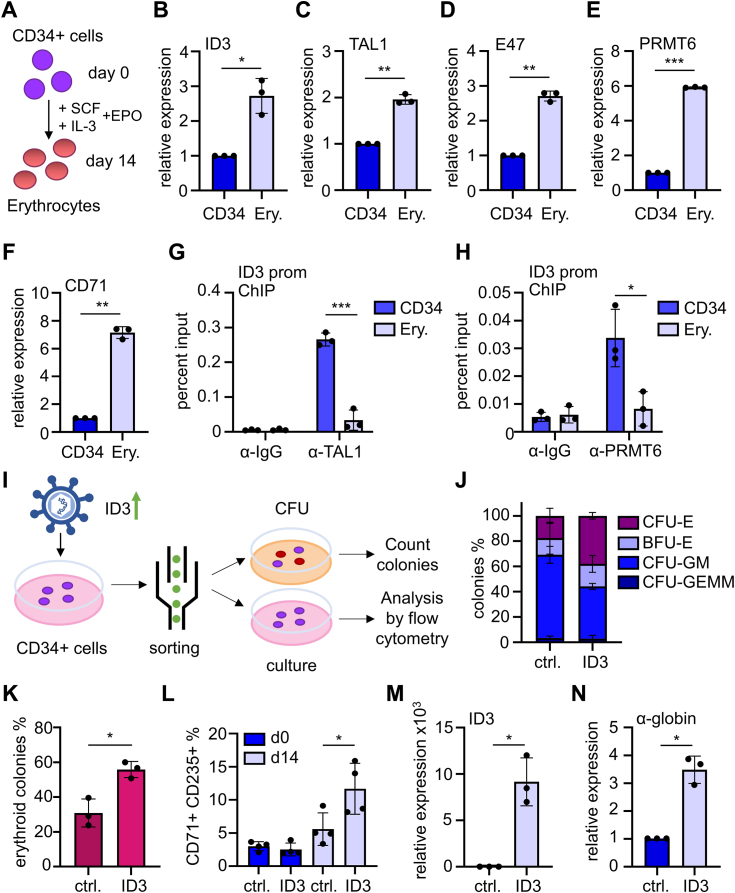
Erythropoiesis is controlled by transcription factors that recruit epigenetic cofactors to establish and maintain erythrocyte-specific gene expression patterns while repressing alternative lineage commitment. The transcription factor TAL1 (T-cell acute lymphocytic leukemia 1) is critical for establishing erythroid gene expression. It acts as an activator or repressor of genes, depending on associated epigenetic cofactors. Understanding the epigenetic function of TAL1 during erythropoiesis is key to improving in vitro erythroid differentiation and understanding pathological erythropoiesis. Therefore, the regulatory mechanisms that control the function of TAL1 during erythropoiesis are under intense investigation. Here, we show that TAL1 interacts with protein-arginine-methyltransferase-6 (PRMT6) on the ID3 (inhibitor-of-DNA-binding-3) gene in K562 and hCD34+ cells. The ID protein family is a critical transcriptional regulator of hematopoietic cell differentiation. We show that TAL1 and PRMT6 are present at the ID3 promoter, and that TAL1 is involved in the recruitment of PRMT6. Here, PRMT6 epigenetically regulates ID3 expression by mediating dimethylation of histone 3 at arginine 2. Thus, TAL1-PRMT6 epigenetically represses ID3 expression in progenitors, which is relieved upon erythroid differentiation, leading to increased expression. Overexpression of ID3 in primary hCD34+ cells enhances erythropoiesis. Our results show that a TAL1-PRMT6 complex regulates genes important for erythropoiesis, such as ID3. Manipulation of ID3 expression may be a way to promote in vitro differentiation of hCD34+ cells into erythrocytes.

Keywords: basic helix–loop–helix transcription factor; cell differentiation; epigenetics; erythropoiesis; histone methylation; transcription corepressor; transcription regulation.


Conflict of interest statement

Conflict of interest The authors declare that they have no conflicts of interest with the contents of this article.

Figures

Figure 1
Figure 1
TAL1 interacts with PRMT6.A, localization of TAL1 and PRMT6 in K562 cells with specific primary antibodies and AlexaFluor (488, 647)-labeled secondary antibodies. F-Actin-specific immunostainings plus nuclear counterstain (DAPI). Images are maximum intensity projections of several confocal sections. Scale bars represent 10 μm. B, coimmunoprecipitation of overexpressed HA-tagged PRMT6 and FLAG-tagged TAL1 in HEK293T cells. C and D, TAL1 and PRMT6 interact in vitro. GST pull-down with recombinant GST-PRMT6 and in vitro translated 35S-labeled full-length TAL1 (1–331) or smaller TAL1 fragments. E, schematic representation of TAL1 and PRMT6. Regions involved in interaction are marked as black bars, weak interaction marked as gray bar, blue bar represents amino acids 160 to 219 of TAL1 interacting with PRTM6. Numbers refer to amino acid (aa) numbers. AD, activation domain; bHLH, basic helix loop helix; DAPI, 4′,6-diamidino-2-phenylindole; GST, glutathione-S-transferase; HEK293T, human embryonic kidney 293T cell line; PRMT6, protein–arginine–methyltransferase-6; TAL1, T-cell acute lymphocytic leukemia 1.
Figure 2
Figure 2
TAL1 and PRMT6 have common target genes.A, analysis of gene expression after TAL1 or PRMT6 knockdown in K562 cells. Seven days upon knockdown, gene expression was determined and altered genes compared. About 160 genes are altered in both datasets. B, Gene Ontology (GO) term analysis of those 160 genes using the webtool “string” with default settings. Examples of annotated genes are given. C and D, stable inducible TAL1 (C) and PRMT6 (D) knockdown was established. Western blot shows knockdown of TAL1 (C) and PRMT6 (D) in K562 upon induction with 1 μM doxycycline for 7 days. GAPDH serves as loading control. shP6 = shPRMT6. E and F, ID3 expression was augmented upon TAL1 (E) or PRMT6 (F) knockdown. ID3 expression was determined by RT–quantitative PCR and normalized to GAPDH expression. Graphs show the means ± SD of four independent experiments (n = 4). p Values were calculated using Student's t test (∗p < 0.05; ∗∗p < 0.01). ID3, inhibitor-of-DNA-binding-3; ns, not significant; PRMT6, protein–arginine–methyltransferase-6; TAL1, T-cell acute lymphocytic leukemia 1.
Figure 3
Figure 3
TAL1, E47, and PRMT6 bind to the ID3 promoter in K562 cells.A, schematic representation of the ID3 locus. ID3 promoter constructs are shown relative to the transcriptional start site. ChIP-Primer allow coverage of the proximal promoter area of ID3. B and C, TAL1 and E47 influence ID3 promoter activity in a reporter gene assay. E47 activates the ID3 promoter. TAL1 cotransfection decreased ID3 activity. Normalized values are given as relative light units, and the values gathered upon transfection of the promoter only are set as one. Graphs show the means ± SD of four independent experiments (n = 4). DF, TAL1, E47, and PRMT6 bind to the ID3 promoter in K562 cells. G, ChIP–reChIP analysis of TAL1 and PRMT6 in K562 cells. ChIP assays were quantified via quantitative PCR with specific oligos for the ID3 promoter. The regions to which the oligos bind are shown relative to the transcriptional start site. Data are given as percent input. Graphs show the means ± SD of three independent experiments (n = 3). p Values were calculated using Student's t test (∗p < 0.05; ∗∗p < 0.01). ATG, start codon; bp, base pairs; +1 transcription start point; ChIP, chromatin immunoprecipitation; ID3, inhibitor-of-DNA-binding-3; PRMT6, protein–arginine–methyltransferase-6; Stop, stop codon; TAL1, T-cell acute lymphocytic leukemia 1.
Figure 4
Figure 4
TAL1 recruits PRMT6 to the ID3 promoter in K562 cells.A, decreased enrichment of TAL1 at the ID3 promoter in K562 cells upon TAL1 knockdown. B, decreased enrichment of PRMT6 at the ID3 promoter after TAL1 knockdown. C, H3R2me2a was reduced after TAL1 knockdown. D, H3K4me3 was increased after TAL1 knockdown. ChIP assays were performed after TAL1 knockdown for 7 days. E, high expression of ID3 in K562 and HEL cells compared with hCD34+ cells. ID3 expression was determined by RT–quantitative PCR and normalized to GAPDH expression. Graphs show the means ± SD of three independent experiments (n = 3). Relative expression of hCD34+ cells is set as one. F, decreased enrichment of PRMT6 at the ID3 promoter in K562 cells after a doxycycline-induced PRMT6 knockdown for 7 days. G, H3R2me2a was reduced after PRMT6 knockdown. H, H3K9me1 was reduced after PRMT6 knockdown. I, RNA polymerase II (RNAPII) was more enriched at glycophorin A (GYPA) promoter than at the ID3 promoter in K562 cells. J, phosphorylated RNA polymerase II (RNAPII phos.) was more enriched at GYPA promoter than at the ID3 promoter. Quantitative PCR values are shown as percent input. Values gathered for histone H3 modifications were normalized with a ChIP against unmodified histone H3. Graphs show the means ± SD of three independent experiments (n = 3). p Values were calculated using Student's t test (∗p < 0.05; ∗∗p < 0.01; and ∗∗∗p < 0.001). ChIP, chromatin immunoprecipitation; H3K4me3, trimethylation of lysine 4 on histone 3; H3R2me2a, dimethylation of histone 3 at arginine 2; ID3, inhibitor-of-DNA-binding-3; PRMT6, protein–arginine–methyltransferase-6; TAL1, T-cell acute lymphocytic leukemia 1.
Figure 5
Figure 5
ID3 overexpression augmented erythroid differentiation.A, primary human CD34+ cells were differentiated to erythrocytes. Expression of (B) ID3, (C) TAL1, (D) E47, (E) PRMT6, and (F) CD71 was measured on the mRNA level by RT–quantitative PCR. Expression was normalized to GAPDH expression, and the expression of undifferentiated hCD34+ cells was set as one. Graphs show the means ± SD of three independent experiments (n = 3). Decreased enrichment of (G) TAL1 and (H) PRMT6 at the ID3 promoter in hCD34+ cells differentiated to erythroid cells compared with undifferentiated hCD34+ cells. ChIP assays were quantified via quantitative PCR with specific oligos for the ID3 promoter. Graphs show the means ± SD of three independent experiments (n = 3). p Values were calculated using Student's t test (∗∗∗p < 0.001; ∗p < 0.05). I, scheme of the strategy to determine the influence of ID3 on differentiation. Transduced ID3-overexpressing cells were sorted for GFP-positive cells and subjected to colony-forming unit (CFU) assay or liquid culture (culture) in expansion medium for 14 days. As control (ctrl.), hCD34+ cells were transduced with an empty vector construct. J, ID3 overexpression led to an increase in erythroid colonies in CFU assay. K, representation of only erythroid colonies in CFU assay. Graphs show the means ± SD of three independent experiments (n = 3). L, overexpression of ID3 in hCD34+ cells led to increased number of CD71+ and CD235+ double-positive erythroid cells. Graphs show the means ± SD of four independent experiments (n = 4). p Values were calculated using Student's t test (∗p < 0.05). Expression of (M) ID3 and (N) α-globin in ID3-overexpressing hCD34+ cells. Expression levels were determined by RT–quantitative PCR and normalized to GAPDH expression. Graphs show the means ± SD of three independent experiments (n = 3). Relative expression of control hCD34+ cells (ctrl.) is set as one. p Values were calculated using Student's t test (∗p < 0.05). BFU-E, burst-forming unit-erythroid; CFU-E, colony-forming unit-erythroid; CFU-GEMM, common myeloid progenitor; CFU-GM, granulocyte-macrophage progenitor; ChIP, chromatin immunoprecipitation; ID3, inhibitor-of-DNA-binding-3.

Similar articles

References

    1. Goode D.K., Obier N., Vijayabaskar M.S., Florkowska M., Patel R., Challinor M., et al. Dynamic gene regulatory networks drive hematopoietic specification and differentiation. Dev. Cell. 2016;36:572–587. - PMC - PubMed
    1. Orkin S.H., Zon L.I. Hematopoiesis: an evolving paradigm for stem cell biology. Cell. 2008;132:631–644. - PMC - PubMed
    1. Orkin S.H. Diversification of haematopoietic stem cells to specific lineages. Nat. Rev. Genet. 2000;1:57–64. - PubMed
    1. Cantor A.B., Orkin S.H. Transcriptional regulation of erythropoiesis: an affair involving multiple partners. Oncogene. 2002;21:3368–3376. - PubMed
    1. Cantor A.B., Orkin S.H. Hematopoietic development: a balancing act. Curr. Opin. Genet. Dev. 2001;11:513–519. - PubMed

MeSH terms

Substances

LinkOut - more resources