. 2025 Feb;12(6):e2410273.
doi: 10.1002/advs.202410273. Epub 2024 Dec 23.

Microglia-Derived Vitamin D Binding Protein Mediates Synaptic Damage and Induces Depression by Binding to the Neuronal Receptor Megalin

Affiliations

Microglia-Derived Vitamin D Binding Protein Mediates Synaptic Damage and Induces Depression by Binding to the Neuronal Receptor Megalin

Yan Kong et al. Adv Sci (Weinh). 2025 Feb.

Abstract

Vitamin D binding protein (VDBP) is a potential biomarker of major depressive disorder (MDD). This study demonstrates for the first time that VDBP is highly expressed in core emotion-related brain regions of mice susceptible to chronic unpredictable mild stress (CUMS). Specifically, the overexpression of microglia (MG)-derived VDBP in the prelimbic leads to depression-like behavior and aggravates CUMS-induced depressive phenotypes in mice, whereas conditional knockout of MG-derived VDBP can reverse both neuronal damage and depression-like behaviors. Mechanistically, the binding of MG-derived VDBP with the neuronal receptor megalin mediates the downstream SRC signaling pathway, leading to neuronal and synaptic damage and depression-like behaviors. These events may be caused by biased activation of inhibitory neurons and excitatory-inhibitory imbalance. Importantly, this study has effectively identified MG-derived VDBP as a pivotal mediator in the interplay between microglia and neurons via its interaction with the neuronal receptor megalin and intricate downstream impacts on neuronal functions, thus offering a promising therapeutic target for MDD.

Keywords: depression; megalin; microglia; neuron damage; vitamin D binding protein.


Conflict of interest statement

The authors declare no conflict of interest.

Figures
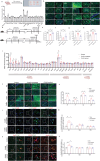
Figure 1
Figure 1
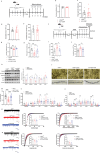
Whole‐brain expression analysis of VDBP mRNA or protein in wild‐type, CUMS‐susceptible, and CUMS‐resilient mice. a) C57BL/6J mouse brains (male mice 6–8 weeks old) were serially sectioned into 30 µm slices and immunostained with VDBP antibody. b) Representative immunofluorescence images of VDBP protein expression in various brain regions. Green: VDBP. Blue: DAPI. Scale bar = 20 or 100 µm. c) Fluorescence intensity of VDBP in each brain area of wild‐type mice. n = 4 mice per group. d) Experimental timeline for CUMS paradigm, behavioral tests, and preparation of brain sections. e–h) Behavioral test results for control and CUMS mice. CUMS susceptible mice showed lower sucrose preference (e), a decreased central zone duration time in the OFT (f), and increased immobility time in the TST (g) and FST (h). CUMS resilient mice behaved indistinguishably from control nonstressed mice (n = 10 mice per group). i) Fluorescence intensity of VDBP in each brain area of susceptible and resilient mice after the CUMS paradigm (n = 4 mice per group). j) Representative immunofluorescence images of VDBP protein expression in emotion‐related brain regions in control, CUMS‐susceptible, and CUMS‐resilient mice. Scale bar = 100 µm (left) and 20 µm (right). k) Fluorescence intensity of VDBP in emotion‐related brain regions in control, CUMS‐susceptible, and CUMS‐resilient mice (n = 4 mice per group). l,m) Representative confocal images and quantification of VDBP RNAscope signal colocalized with cell‐specific markers for neurons (NeuN), astrocytes (GFAP), and microglia (Iba1) in the PrL of control, CUMS‐susceptible, and CUMS‐resilient mice. n = 4 mice. Scale bar = µm 20 (left) and 10 µm (right). n,o) Representative confocal images (n) and quantification (o) of VDBP protein colocalized with cell‐specific markers for neurons (NeuN), astrocytes (GFAP), and microglia (Iba1) in the PrL of control, CUMS‐susceptible, and CUMS‐resilient mice. n = 4 mice. Scale bar = 20 µm (left) and 10 µm (right). Data represent the mean ± SEM. For comparisons among groups, one‐way analysis of variance (ANOVA) followed by Bonferroni post hoc tests was used. *p < 0.05, **p < 0.01, ***p < 0.001.
Figure 2
Figure 2
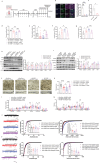
Effects of specific overexpression of MG‐derived VDBP in the PrL region on CUMS‐induced depressive‐like behavior and neuronal synapses in mice. a) Schematic of the experimental design. TAM, tamoxifen. b) Immunofluorescent assay showed the efficient infection of MG in mouse PrL. Red: mCherry. Blue: DAPI. Purple: Iba‐1. Scale bar: left 50 µm, right 20 µm. c) Immunostaining and quantification results showed MG‐specific overexpression of VDBP in PrL MG cells. Blue: DAPI. Green: cell type marker. Red: mCherry. n = 3 mice per group. Scale bar = 20 µm. d) Western blotting with quantification of VDBP protein levels in the PrL of mice administered AAV–VDBP or AAV–mCherry by stereotactic injection. n = 4 biological replicates. Data were analyzed by the two‐tailed unpaired t‐test. e–h) Behavioral test scores of mice treated with AAV–VDBP or AAV–mCherry. Depressive behaviors were observed in sucrose preference (e) or immobility time in the TST (g) and FST (h). AAV–VDBP mice also demonstrated a decreased central zone duration time in the OFT (f). n = 7 mice for AAV–mCherry, n = 6 for AAV–VDBP. i) Schematic of the experimental design of mice treated with AAV–VDBP or AAV–mCherry and stressed by CUMS. j–m) Behavior tests of CUMS‐stressed AAV–VDBP or AAV–mCherry mice. CUMS‐stressed AAV–VDBP mice showed a decreased sucrose preference (j) and central zone duration time (k), and increased immobility time in the TST (l) and FST (m) compared with CUMS‐stressed AAV–mCherry mice. n = 7 mice per group for SPT, OFT, and TST. n = 6 for FST. n) Western blotting with quantification of synaptic protein levels in the PrL of AAV–mCherry and AAV–VDBP mice after CUMS. n = 3–6 mice per group. o–r) Golgi‐Cox‐stained dendritic spines and spine density quantification in the PrL of AAV–mCherry and AAV–VDBP mice after CUMS. n = 38–40 neurons from 5 mice per group. Filopodia spines are >2 µm in length; the maximum width of stubby spines is less than their length; long thin spines are 1–2 µm in length; thin spines are <1 µm in length; mushroom spines have a head/neck diameter ratio > 1 (q, r). Scale bar = 2 µm. s) Schematic of the experimental design. t–w) Behavioral test results for C57bl/6j mice that underwent stereotactic injection of VDBP protein into the PrL. VDBP‐treated mice showed a decreased sucrose preference (t) and central zone duration (u). Immobility time in the TST (v) and FST (w) also increased. n = 8 mice per group. Data represent the mean ± SEM. Student's t‐test was used for statistical comparisons between two groups. For comparisons among groups, one‐way ANOVA followed by Bonferroni post hoc tests was used. *p < 0.05, **p < 0.01, ***p < 0.001.
Figure 3
Figure 3
Construction and validation of MG‐derived VDBP conditional knockout mice. a) Schematic of construction of VDBPfl/fl mice using the CRISPR‐Cas9 technique. The strategy for KO‐VDBP and subsequent behavioral studies is also shown. b) Southern blot of DNA from tails of F1 mice. DNA was digested using the restriction enzymes NcoI and AseI. The 3′ probe was used to detect recombination. The left homology arm (LR) probe was used to rule out random incorporation. WT: wildtype control. VDBPfl/+ F1 mice: 001, 007, 009, and 012. c) PCR validation of Cx3cr1‐CreER/+; VDBPfl/fl mice by PCR primers for 5′loxp, 3′loxp, and Cre. A1, A3, A4, A6, A7, A9, A10, A12, and A13 are the mice with the genotype Cx3cr1‐CreER/+; VDBPfl/fl. d) Immunofluorescence of VDBP in different cell types of the PrL in TAM‐treated VDBPfl/fl and KO‐VDBP mice. Blue: DAPI. Green: VDBP. Red: cell type marker (neuron: NeuN, microglia: Iba1, astrocyte: GFAP). Scale bar = 20 µm. n = 3 mice. e) Fluorescence‐activated cell sorting of microglia, neurons, astrocytes, and endothelial cells from mouse brains. f) Reverse transcriptase (RT)‐quantitative polymerase chain reaction (qPCR) of VDBP expression in different brain cell types after fluorescence‐activated cell sorting. Data were analyzed by the two‐tailed unpaired t‐test and expressed as the mean ± SEM, n = 3 mice. Student's t‐test was used for statistical comparisons between two groups. *p < 0.05, **p < 0.01, ***p < 0.001.
Figure 4
Figure 4
Resistance to CUMS‐induced depressive‐like behavior in mice with microglia VDBP‐conditioned knockout mice. a) Schematic of the experimental design. TAM, tamoxifen. b–e) Behavior test results for VDBPfl/fl and Cx3cr1‐CreER/+; VDBPfl/fl mice. No significant differences were observed in sucrose preference (b), central zone duration (c), or immobility time in the TST (d) and FST (e). n = 10 mice per group. f) Schematic of the experimental design of VDBPfl/fl and KO‐VDBP mice stressed by CUMS. g–j) Behavioral test results for CUMS‐stressed VDBPfl/fl and KO‐VDBP mice. CUMS‐stressed KO‐VDBP mice showed an increased sucrose preference (g) and central zone duration time (h) and decreased immobility time in the TST (i) and FST (j) compared with CUMS‐stressed VDBPfl/f mice. n = 10 mice per group. k) Western blotting with quantification of synaptic protein levels in the PrL of VDBPfl/fl and KO‐VDBP mice after CUMS. n = 6 biological replicates. l–o) Golgi‐Cox stained dendritic spines and spine density quantification in the PrL of VDBPfl/fl and KO‐VDBP mice after CUMS. n = 38–40 neurons from five mice per group. Filopodia spines are >2 µm in length; the maximum width of stubby spines is less than the length; long thin spines are 1–2 µm in length; thin spines are <1 µm in length; mushroom spines have a head/neck diameter ratio > 1 (n, o). Scale bar = 2 µm. p) Representative mEPSC traces. Scale bar = 10 pA, 2 s (left). Cumulative distribution plot and bar graph showing the mEPSC amplitude of PrL pyramidal neurons from VDBPfl/fl + control, VDBPfl/fl + CUMS, and KO‐VDBP + CUMS mice (middle). Cumulative distribution plot of the mEPSC interevent interval and bar graph of mEPSC frequency of PrL pyramidal neurons from VDBPfl/fl + control, VDBPfl/fl + CUMS, and KO‐VDBP + CUMS mice (right). Data were expressed as the mean ± SEM, n = 3 mice/10 cells per group. q) Representative mIPSC traces. Scale bar = 20 pA, 2 s (left). Cumulative distribution plot and bar graph showing the mIPSC amplitude of PrL pyramidal neurons from VDBPfl/fl + control, VDBPfl/fl + CUMS, and KO‐VDBP + CUMS mice (middle). Cumulative distribution plot of the mEPSC interevent interval and bar graph of the mIPSC frequency of PrL pyramidal neurons from VDBPfl/fl + control, VDBPfl/fl + CUMS, and KO‐VDBP + CUMS mice (right). Data were expressed as the mean ± SEM. n = 3 mice/10 cells per group. Student's t‐test was used for statistical comparisons between two groups. For comparisons among groups, one‐way ANOVA followed by Bonferroni post hoc tests was used. *p < 0.05, **p < 0.01, ***p < 0.001.
Figure 5
Figure 5
MG‐derived VDBP binds to the neuronal receptor megalin and regulates SRC downstream signaling pathways, leading to neuronal synaptic damage and depressive‐like behaviors. a) Schematic of the experimental design. TAM, tamoxifen. b) Immuofluorescent assay showed that AAV–siMegalin infected neurons specifically. Scale bar 20µm. c) RT‐qPCR showed VDBP mRNA was efficiently knocked‐down in AAV–siMegalin‐infected mice. n = 3 biological replicates. d–g) Behavioral test results for AAV–mCherry + AAV–EGFP + Control, AAV–mCherry + AAV–EGFP + CUMS, AAV–VDBP + AAV–EGFP + CUMS, and AAV–VDBP + AAV–siMegalin + CUMS mice. Megalin knockdown in neurons rescued behavioral alterations in SPT, OFT, TST, and FST induced by VDBP overexpression in microglia of the PrL. n = 10 mice per group. h) Western blotting of megalin downstream signaling molecules in the above four groups of mice. n = 3 biological replicates. i) Western blotting with quantification of synaptic protein levels in the PrL of the above four groups of mice. n = 6 biological replicates per group. j–m) Golgi‐Cox‐stained dendritic spines (j) and spine density quantification (k–m) in the PrL of the above four groups of mice. n = 38–40 neurons from five mice per group. Filopodia spines are >2 µm in length; the maximum width of stubby spines is less than the length; long thin spines are 1–2 µm in length; thin spines are <1 µm in length; mushroom spines have a head/neck diameter ratio > 1. Scale bar = 2 µm. n) Representative mEPSC traces. Scale bar = 10 pA, 2 s (left). Cumulative distribution plot and bar graph showing the mEPSC amplitude of PrL pyramidal neurons from AAV–mCherry + AAV–EGFP + Control, AAV–mCherry + AAV–EGFP + CUMS, AAV–VDBP + AAV–EGFP + CUMS, and AAV–VDBP + AAV–siMegalin + CUMS mice (middle). Cumulative distribution plot of the mEPSC interevent interval and bar graph of mEPSC frequency of PrL pyramidal neurons from the above four groups of mice (right). Data were expressed as the mean ± SEM. n = 3 animals/10 cells per group. o) Representative mIPSC traces. Scale bar = 20 pA, 2 s (left). Cumulative distribution plot and bar graph showing the mIPSC amplitude of PrL pyramidal neurons from AAV–mCherry + AAV–EGFP + Control, AAV–mCherry + AAV–EGFP + CUMS, AAV–VDBP + AAV–EGFP + CUMS, and AAV–VDBP + AAV–siMegalin + CUMS mice (middle). Cumulative distribution plot of the mIPSC interevent interval and bar graph of mIPSC frequency of PrL pyramidal neurons from AAV–mCherry + AAV–EGFP + Control, AAV–mCherry + AAV–EGFP + CUMS, AAV–VDBP + AAV–EGFP + CUMS, and AAV–VDBP + AAV–siMegalin + CUMS mice (right). Data were expressed as the mean ± SEM. n = 3 animals/10 cells per group. Student's t‐test was used for statistical comparisons between two groups. For comparisons among groups, one‐way ANOVA followed by Bonferroni post hoc tests was used. *p < 0.05, **p < 0.01, ***p < 0.001.
Figure 6
Figure 6
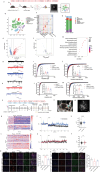
Specificity of MG‐derived VDBP action on neuronal subtypes related to depression. a) Overview of the experimental design for single‐nucleus sequencing of AAV–mCherry and AAV–VDBP mice (n = 3 mice per condition). b) TSNE plot of single‐nucleus sequencing of AAV–mCherry and AAV–VDBP mice. c) Average scaled expression levels of selected signature genes for different cell types. d) Stacked barplot comparing the cell‐type compositions between AAV–mCherry and AAV–VDBP mice. e) Volcano plot showing DEGs for GABAergic neurons in AAV–VDBP versus AAV–mCherry mice. Upregulated genes are highlighted in red, while downregulated genes are highlighted in blue. f) Volcano plot showing DEGs for glutamatergic neurons in AAV–VDBP versus AAV–mCherry mice. Upregulated genes are highlighted in red, while downregulated genes are highlighted in blue. g) KEGG enrichment analysis of DEGs in GABAergic neurons in AAV–VDBP versus AAV–mCherry mice. h) Sample traces of sEPSCs recorded from pyramidal neurons in VDBPfl/fl, VDBPfl/fl + CUMS, and KO‐VDBP + CUMS mice. Scale bar = 20 pA, 2 s. i) Cumulative probability distribution for sEPSC amplitude and the mean sEPSC amplitude. j) Cumulative probability distribution of sEPSC interevent intervals and the mean sEPSC frequency. n = 3 mice/10 cells per group. k) Sample traces of sIPSCs recorded from pyramidal neurons in VDBPfl/fl, VDBPfl/fl + CUMS, and KO‐VDBP + CUMS mice. Scale bar = 100 pA, 2 s. l) Cumulative probability distribution for sIPSC amplitude and the mean sIPSC amplitude. m) Cumulative probability distribution of sIPSC interevent intervals and the mean sIPSC frequency. n = 3 mice/10 cells per group. n) Schematic diagram showing the workflow of the head‐mounted miniature two‐photon microscope. o) Photographs of a miniature two‐photon microscope (FHIRM‐TPM V2.0) on a fingertip and mounted to the head of a mouse. Scale bar 10 mm. p) GCaMP6f imaging was taken by miniatured two‐photon microscopy, and neuronal somas were automatically identified using MATLAB script and checked manually. Scale bar: 15 mm. q) Representative heatmap of ΔF/F traces showing neuronal activity in 30 neurons from the PrL of VDBPfl/fl + control mice (Pre‐Interv) and 20 neurons from the PrL of VDBPfl/fl + CUMS mice (Post‐Interv) during TST. r) Example ΔF/F time‐series traces from imaging fields from VDBPfl/fl + control (Pre‐Interv) and VDBPfl/fl + CUMS mice (Post‐Interv) during TST. s) Average ΔF/F in neurons from VDBPfl/fl + control (Pre‐Interv) and VDBPfl/fl + CUMS mice (Post‐Interv) was calculated (n = 91 cells from 4 mice). t) Representative heatmap of ΔF/F traces showing neuronal activity in 23 neurons from the PrL of KO‐VDBP + control mice (Pre‐Interv) and 20 neurons from the PrL of KO‐VDBP + CUMS mice (Post‐Interv) during TST. u) Example ΔF/F time‐series traces from imaging fields from KO‐VDBP + control (Pre‐Interv) and KO‐VDBP + CUMS (Post‐Interv) mice during TST. v) Average ΔF/F in neurons from KO‐VDBP + control (Pre‐Interv) and KO‐VDBP + CUMS mice (Post‐Interv) was calculated (n = 76 cells from 3 mice). w) Immunofluorescence assay and quantification of VDBP and megalin protein expression in GABAergic neurons in the PrL of VDBPfl/fl + Control, VDBPfl/fl + CUMS, and KO‐VDBP + CUMS mice. n = 5 in the VDBPfl/fl + Control group, n = 6 in the VDBPfl/fl + CUMS group, n = 5 in the KO‐VDBP + CUMS group. Scale bar = 50 mm. x) Immunofluorescence assay and quantification of VDBP and megalin protein expression in glutamatergic neurons in the PrL of VDBPfl/fl + Control, VDBPfl/fl + CUMS, and KO‐VDBP + CUMS mice. n = 6 in the VDBPfl/fl + Control group, n = 5 in the VDBPfl/fl + CUMS group, n = 5 in the KO‐VDBP + CUMS group. Scale bar = 50 mm. Data are presented as the mean ± SEM. For comparisons among groups, one‐way ANOVA followed by Bonferroni post hoc tests was used. *p < 0.05, **p < 0.01, ***p < 0.001.

Similar articles

Cited by

References

    1. GBD 2019 Mental Disorders Collaborators , Lancet Psychiatry 2022, 9, 137. - PMC - PubMed
    1. Hasin D. S., Sarvet A. L., Meyers J. L., Saha T. D., Ruan W. J., Stohl M., Grant B. F., JAMA Psychiatry 2018, 75, 336. - PMC - PubMed
    1. Shi Y., Song R., Wang L., Qi Y., Zhang H., Zhu J., Zhang X., Tang X., Zhan Q., Zhao Y., Swaab D. F., Bao A.‐M., Zhang Z., J. Affective Disord. 2020, 277, 620. - PubMed
    1. Zhang G., Li L., Kong Y., Xu D., Bao Y., Zhang Z., Liao Z., Jiao J., Fan D., Long X., Dai J., Xie C., Meng Z., Zhang Z., Genes Dis. 2024, 11, 1009. - PMC - PubMed
    1. Bouillon R., Schuit F., Antonio L., Rastinejad F., Front. Endocrinol. 2019, 10, 910. - PMC - PubMed

MeSH terms

Substances

LinkOut - more resources