. 2025 Feb;12(6):e2409250.
doi: 10.1002/advs.202409250. Epub 2024 Dec 24.

TTK Inhibition Alleviates Postinjury Neointimal Formation and Atherosclerosis

Affiliations

TTK Inhibition Alleviates Postinjury Neointimal Formation and Atherosclerosis

Jie-Hong Wu et al. Adv Sci (Weinh). 2025 Feb.

Abstract

Atherosclerosis and its associated cardio-cerebrovascular complications remain the leading causes of mortality worldwide. Current lipid-lowering therapies reduce only approximately one-third of the cardiovascular risk. Furthermore, vascular restenosis and thrombotic events following surgical interventions for severe vascular stenosis significantly contribute to treatment failure. This highlights the urgent need for novel therapeutic targets to manage atherosclerosis and prevent restenosis and thrombosis after vascular injury. This study identifies TTK protein kinase (TTK) as a key regulator of vascular smooth muscle cell (VSMC) phenotypic switching in the context of postinjury neointimal formation and atherosclerosis. Mechanistically, TTK upregulation in VSMCs phosphorylates p120-catenin, leading to β-catenin nuclear accumulation and dissociation of the myocardin (MYOCD)/serum response factor (SRF) complex. Deletion of TTK specifically in VSMCs reduces postinjury neointimal formation in vascular injury models and attenuates atherosclerotic lesions in ApoE-/- mice. Notably, oral administration of the TTK inhibitor CFI-402257 mitigated neointimal formation without impairing reendothelialization and reduced atherosclerotic lesions in ApoE-/- mice without altering lipid levels. These findings suggest that targeting TTK, through inhibitors or alternative strategies, represents a promising approach to simultaneously prevent postinjury restenosis and treat atherosclerosis.

Keywords: TTK; atherosclerosis; p120‐catenin; restenosis; vascular smooth muscle cells.


Conflict of interest statement

The authors declare no conflict of interest.

Figures

Figure 1
Figure 1
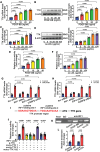
TTK is upregulated during neointima formation in vascular injury and atherosclerosis. A) Venn diagram of the differentially expressed genes (DEGs) in four Gene Expression Omnibus (GEO) datasets was used to identify novel molecules involved in the phenotypic switching of VSMCs under different pathological conditions. B) Quantitative real‐time polymerase chain reaction (qRT‐PCR) validation of the expression of novel VSMC phenotype‐related genes in sham‐operated or wire‐injured carotid arteries of C57 mice on day 28 post‐surgery (n = 6). C) qRT‐PCR validation of the expression of novel VSMC phenotype‐related genes in sham‐operated or ligated carotid arteries of C57 mice on day 28 post‐surgery (n = 6). D) qRT‐PCR analysis of the relative mRNA level of TTK, ACTA2, TAGLN, and CNN1 in VSMCs transfected with scrambled siRNA or TTK‐specific siRNA (n = 6). E) Representative hematoxylin and eosin (HE) staining (left) and immunofluorescence (right) staining of TTK (green) and tdTomato (red) in the sham‐operated or wire‐injured carotid sections of Myh11‐CreERT2 /Rosa26tdTomato mice on days 14 and 28 post‐surgery. IgG was used as a negative control. Nuclei were stained with 4′,6‐diamidino‐2‐phenylindole (DAPI) (blue). Scale bar = 50 µm (left) or 10 µm (right). F) The percentage of TTK‐positive, tdTomato‐positive VSMCs in the neointima (n = 14). G) Analysis of the correlation between the neointima area and the percentage of TTK‐positive, tdTomato‐positive VSMCs in neointima (n = 28). H) Representative immunofluorescence staining of TTK (green) and tdTomato (red) in the aortic root sections of Myh11‐CreERT2 /Rosa26tdTomato /ApoE−/− mice fed on a high‐fat diet (HFD) for 0, 8, and 16 weeks. Nuclei were stained with DAPI (blue). Scale bar = 50 µm. I) The percentage of TTK‐positive, tdTomato‐positive VSMCs in atherosclerotic plaques (n = 14). J) Analysis of the correlation between plaque area and the percentage of TTK‐positive, tdTomato‐positive VSMCs in atherosclerotic plaques (n = 28). Data are presented as the mean ± SEM; unpaired t‐test, one‐way ANOVA.
Figure 2
Figure 2
IRF1 upregulates TTK transcription in VSMCs upon pathological stimulation. A,B) Relative levels of TTK mRNA A) and protein B) in VSMCs stimulated with platelet‐derived growth factor‐BB (PDGF‐BB) (0, 5, 10, 20, and 40 ng mL−1) for 24 h (n = 6). C,D) Relative levels of TTK mRNA C) and protein D) in VSMCs stimulated with oxidized low‐density lipoprotein (ox‐LDL) (0, 5, 10, 25, 50, and 100 µg mL−1) for 24 h (n = 6). E) TTK promoter activity in MOVAS cells treated with PDGF‐BB (0, 5, 10, 20, and 40 ng mL−1) for 24 h (n = 6). F) TTK promoter activity in MOVAS cells treated with ox‐LDL (0, 5, 10, 25, 50, and 100 µg mL−1) for 24 h (n = 6). G) qRT‐PCR analysis of the relative mRNA level of TTK in VSMCs transfected with scrambled, IRF1, E2F4, or C/EBPβ‐specific siRNAs in the presence or absence of 20 ng mL−1 PDGF‐BB (n = 6). H) qRT‐PCR analysis of the relative mRNA level of TTK in VSMCs transfected with scrambled, IRF1, E2F4, or C/EBPβ‐specific siRNAs in the presence or absence of 20 ng mL−1 ox‐LDL (n = 6). I) Schematic illustration of putative IRF1 binding sequences in the TTK promoter region. J) Luciferase reporters of TTK promoter with native (p‐TTK), mutated IRF1binding site 1 (mut‐p‐TTK 1), mutated IRF1binding site 2 (mut‐p‐TTK 2), or mutated IRF1binding site 1 and 2 (mut‐p‐TTK 1&2) were cloned and co‐transfected with IRF1overexpressing vector into MOVAS cells for 48 h (n = 10). K,L) Chromatin immunoprecipitation (ChIP) assay K) and quantification L) demonstrated that PDGF‐BB and ox‐LDL promoted the binding of IRF1 to the TTK promoter (n = 6). IgG lane: negative control. Data are presented as the mean ± SEM; unpaired t‐test, one‐way ANOVA, two‐way ANOVA.
Figure 3
Figure 3
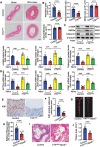
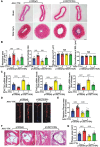
Smooth muscle cell (SMC)‐specific TTK deficiency suppresses neointima and plaque formation in vivo. A) Representative hematoxylin and eosin (HE)‐stained sections of sham‐operated and wire‐injured carotid arteries of control and TtkΔSMC mice on day 28 post‐surgery. Scale bar = 50 µm. B) Quantitative analysis of the neointima area, neointima‐to‐media ratio, media area, and external elastic lamina (EEL) circumference in the histological sections of wire‐injured carotid arteries (n = 12). C) Representative western blotting and quantification of α‐SMA, SM22α, and calponin1 in carotid arteries of control and TtkΔSMC mice on day 28 post‐sham or wire injury operations (n = 6). D) Relative mRNA levels of ACTA2, TAGLN, and CNN1 in carotid arteries of control and TtkΔSMC mice on day 28 post‐sham or wire injury operations (n = 6). E,F) Representative images of Ki67 immunohistochemical staining E) and corresponding quantification of Ki67‐positive cells in the neointima F) in the wire‐injured carotid artery sections of control and TtkΔSMC mice on day 28 post‐surgery (n = 12). Scale bar = 20 µm. G) Representative images of Oil Red O‐stained sections of whole aortas of control and TtkΔSMC /ApoE−/− mice fed on a high‐fat diet (HFD) for 16 weeks. Scale bar = 5 mm. H) Quantification of the plaque area in the whole aorta (n = 12). I) Representative HE‐stained sections of aortic root from control and TtkΔSMC /ApoE−/− mice fed on HFD for 16 weeks. Scale bar = 250 µm. J) Quantification of the plaque area in the aortic sinuses (n = 8). Data are presented as the mean ± SEM; unpaired t‐test, one‐way ANOVA.
Figure 4
Figure 4
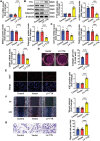
TTK overexpression promotes the phenotypic switching of VSMCs in vitro. A) VSMCs were transfected with empty vector or lentivirus encoding TTK overexpression construct (LV‐TTK). qRT‐PCR analysis of the relative mRNA level of TTK in VSMCs transfected with empty vector or LV‐TTK (n = 6). B) Representative western blotting and quantification of TTK, α‐SMA, SM22α, and calponin1 in VSMCs transfected with empty vector or LV‐TTK (n = 6). C) Relative mRNA levels of ACTA2, TAGLN, and CNN1 in VSMCs transfected with empty vector or LV‐TTK (n = 6). D), Representative images and quantification of collagen gel contraction containing VSMCs transfected with empty vector or LV‐TTK (n = 6). E) VSMCs were subjected to Ki67 immunohistochemical staining (red) and DAPI (blue) staining after transfection with empty vector or LV‐TTK. Representative immunofluorescence images and corresponding quantification of Ki67‐positive VSMCs are shown (n = 6). Scale bar = 20 µm. F,G) The migration ability of VSMCs transfected with empty vector or LV‐TTK was assessed using the wound healing F) and transwell assays G). Representative images and corresponding quantification of migration areas and migrated cells are shown (n = 6). Scale bar = 100 µm (upper) or 50 µm (lower). Data are presented as the mean ± SEM; unpaired t‐test, one‐way ANOVA.
Figure 5
Figure 5
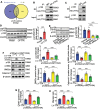
TTK promotes VSMCs phenotypic switching by phosphorylating p120‐catenin at T310. A) Overlapping analysis of the upregulating phosphorylation proteins in hemagglutinin (HA)‐tagged TTK construct‐transfected group in phosphorylated proteomics and interacting proteins of TTK. B) Lysates of VSMCs transfected with the hemagglutinin (HA)‐tagged TTK lentivirus were immunoprecipitated with anti‐HA antibodies, and the precipitates were analyzed using immunoblotting with anti‐p120 antibodies. C) Lysates of VSMCs transfected with the HA‐tagged TTK lentivirus were immunoprecipitated with anti‐p120 antibodies, and the precipitates were analyzed using immunoblotting with anti‐HA antibodies. D) Representative western blotting and quantification of p120 phosphorylated at T310 in VSMCs transfected with empty vector or LV‐TTK (n = 6). E) Representative western blotting and quantification of p120 phosphorylated at T310 in VSMCs transfected with scramble small interfering RNA (siRNA) or TTK‐specific siRNAs (n = 6). F) Representative western blotting and quantification of p120 phosphorylated at T310, α‐SMA, SM22α, and calponin1 in VSMCs co‐transfected with vector or LV‐TTK and wild‐type p120 (p120‐wt) or mutant p120 (p120‐T310A) (n = 6). G,H) Quantification of Ki67 immunofluorescence staining G) and transwell assay results H) of VSMCs co‐transfected with empty vector or LV‐TTK and p120‐wt or p120‐T310A vector (n = 6). Data are presented as the mean ± SEM; unpaired t‐test, one‐way ANOVA.
Figure 6
Figure 6
TTK induces postinjury neointima formation and atherosclerosis through the phosphorylation of p120‐catenin at T310 in vivo. A–C) Myh11‐CreERT2 mice were intraperitoneally injected with tamoxifen for five consecutive days to induce Cre expression. On day 7 post‐final injection, the mice were intravenously injected with different virus. Carotid artery wire injury was induced on day 10 post‐virus injection. The mice were euthanized, and the carotid arteries were harvested on day 14 post‐surgery. A) Representative hematoxylin and eosin (HE)‐stained carotid sections showing the neointima on day 14 post‐carotid artery wire injury. Scale bar = 50 µm. B) Quantitative analysis of the neointima area, neointima‐to‐media ratio, media area, and EEL circumference in carotid sections of different groups (n = 12). C) Relative mRNA levels of ACTA2, TAGLN, and CNN1 in carotid arteries of different groups (n = 6). D–G) Myh11‐CreERT2 /ApoE−/− mice were intraperitoneally injected with tamoxifen for five consecutive days to induce Cre expression. On day 7 post‐final injection, the mice were intravenously injected with different virus. High‐fat diet (HFD) was fed on day 10 post‐virus injection. The mice were euthanized at week 12 post‐HFD feeding for subsequent experiments. D,E) Representative image and quantification of the plaque area in Oil Red O‐stained whole aortas (n = 12). F,G) Representative hematoxylin and eosin (HE) staining and quantification of the plaque area in aortic root sections. Scale bar = 250 µm (n = 8). Data are presented as the mean ± SEM; one‐way ANOVA. NS, non‐significant.
Figure 7
Figure 7
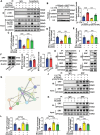
TTK‐induced phenotypic switching of VSMCs is dependent on β‐catenin nuclear accumulation and the subsequent myocardin/SRF complex dissociation. A) VSMCs were co‐transfected with empty vector or lentivirus encoding TTK overexpression construct (LV‐TTK and wild‐type p120 (p120‐wt) or mutant p120 (p120‐T310A) constructs. The cell lysates were immunoprecipitated with anti‐N‐cadherin antibodies. B) Representative western blotting and quantification of nuclear p120 and β‐catenin protein levels in VSMCs co‐transfected with empty vector or LV‐TTK and p120‐wt or p120‐T310A. Protein levels were normalized to H3 levels (n = 6). C–E) Relative mRNA levels of ACTA2 C), TAGLN D), and CNN1 E) in VSMCs transfected with vector or LV‐TTK and treated with or without 40 nm BC2059 (n = 6). F) Representative western blotting and quantification of SRF and MYOCD in VSMCs transfected with empty vector or LV‐TTK (n = 6). G) STRING database predicted that CTNNB1 (β‐catenin) interacts with MYOCD and SRF. H) Lysates of VSMCs were immunoprecipitated with anti‐β‐catenin antibodies. I)Lysates of VSMCs were immunoprecipitated with anti‐SRF antibodies. J) VSMCs were co‐transfected with empty vector or LV‐TTK and p120‐wt or p120‐T310A. The cell lysates were immunoprecipitated with anti‐SRF antibodies. K) VSMCs were transfected with empty vector or LV‐TTK in the presence or absence of 40 nm BC2059. The cell lysates were immunoprecipitated with anti‐SRF antibodies. L) ChIP analyzing the binding of SRF to promoters of ACTA2, TAGLN, and CNN1 in VSMCs transfected with vector or LV‐TTK and treated with or without 40 nm BC2059 (n = 6). Data are presented as the mean ± SEM; unpaired t‐test, one‐way ANOVA.
Figure 8
Figure 8
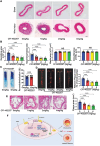
Effects of TTK inhibitor on postinjury neointima formation and atherosclerosis in vivo. A) Representative HE‐stained sections of sham‐operated and wire‐injured carotid arteries from C57 mice administered with CFI‐402257 (1, 2, or 4 mg kg−1 body weight) on day 28 post‐surgery. Scale bar = 50 µm. B) Quantitative analysis of the neointima area, neointima‐to‐media ratio, media area, and EEL circumference in the histological sections of wire‐injured carotid arteries from C57 mice administered with CFI‐402257 on day 28 post‐surgery (n = 12). C) Representative images of en face Evans blue‐stained carotid arteries from the C57 mice administered with vehicle or CFI‐402257 (4 mg kg−1 body weight) at 5 days after wire injuries. Scale bar = 1 mm. Quantification of re‐endothelialization in the injured carotid arteries (n = 12). D) Representative images of en face Oil Red O‐stained whole aorta sections from ApoE−/− mice administered with CFI‐402257 (1, 2, or 4 mg kg−1 body weight) and fed on a high‐fat diet (HFD) for 12 weeks. Scale bar = 5 mm. Quantification of the plaque area in the whole aorta (n = 8). E) Representative HE‐stained aortic root sections from ApoE−/− mice administered with CFI‐402257 and fed on an HFD for 12 weeks. Scale bar = 250 µm. Quantification of the plaque area in the aortic root sections (n = 8). F) Schematic illustration of TTK‐induced phenotypic switching of VSMCs to promote postinjury neointima formation and atherosclerosis. Data are presented as the mean ± SEM; unpaired t‐test, one‐way ANOVA. NS, non‐significant.

References

    1. Diseases G. B. D., Injuries C., Lancet 2020, 396, 1204. - PMC - PubMed
    1. Libby P., Nature 2021, 592, 524. - PubMed
    1. Crea F., Eur. Heart J. 2023, 44, 1287. - PubMed
    1. Borovac J. A., D'Amario D., Vergallo R., Porto I., Bisignani A., Galli M., Annibali G., Montone R. A., Leone A. M., Niccoli G., Crea F., Eur. Heart J. Cardiovasc. Pharmacother. 2019, 5, 105. - PubMed
    1. Ma Z., Mao C., Chen X., Yang S., Qiu Z., Yu B., Jia Y., Wu C., Wang Y., Wang Y., Gu R., Yu F., Yin Y., Wang X., Xu Q., Liu C., Liao Y., Zheng J., Fu Y., Kong W., Circulation 2023, 147, 728. - PubMed

MeSH terms

Substances

LinkOut - more resources