. 2025 Feb;12(7):e2413525.
doi: 10.1002/advs.202413525. Epub 2024 Dec 24.

FGF19-Activated Hepatic Stellate Cells Release ANGPTL4 that Promotes Colorectal Cancer Liver Metastasis

Affiliations

FGF19-Activated Hepatic Stellate Cells Release ANGPTL4 that Promotes Colorectal Cancer Liver Metastasis

Xueying Fan et al. Adv Sci (Weinh). 2025 Feb.

Abstract

Liver and lung are the most common metastatic sites in colorectal cancer (CRC), where the tumor microenvironment (TME) plays a crucial role in the progression and metastasis of CRC. Understanding the interactions between various types of cells in the TME can suggest innovative therapeutic strategies. Using single-cell RNA sequencing (scRNA-Seq) and clinical samples, fibroblast growth factor-19 (FGF19, rodent FGF15) is found to mediate a significant interaction between CRC cells and cancer-associated fibroblasts (CAFs), activating the hepatic stellate cells (HSCs)-to-CAFs differentiation. In various CRC metastatic mouse models, it is shown that FGF15 has a more pronounced effect on liver metastasis compared to pulmonary metastasis. More importantly, the differentially expressed genes (DEGs) are also identified from the RNA-Seq dataset upon the activation of HSCs by FGF19 and compared the DEGs in matched primary and metastatic mRNA samples from patients with CRC liver metastasis (CRCLM), it is found that the ANGPTL4 gene is significantly associated with HSCs activation. Different mouse models also demonstrated the impact of the FGF19/ANGPTL4 axis on the severity of CRCLM. Importantly, disruption of this axis significantly inhibits CRCLM in vivo. This study is among the first to demonstrate the impact of the FGF19/ANGPTL4 axis on CRCLM, offering a novel therapeutic strategy.

Keywords: ANGPTL4; FGF19; cancer‐associated fibroblasts; colorectal cancer liver metastasis; tumor microenvironment.


Conflict of interest statement

The authors declare no conflict of interest.

Figures

Figure 1
Figure 1
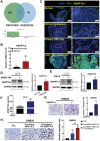
FGF19 is associated with CRC liver metastasis (CRCLM) and poor prognosis in CRC patients. A) Seventeen cell subsets were identified by analysis of the scRNA‐Seq data from 6 patients with CRCLM. B) Analysis of the cellular communication in tumor samples from patients with CRCLM. C) The Venn diagram illustrating the overlap of interacting genes between CRC cells and CAFs, as well as the highly expressed genes in CRC from the TCGA database. D) Volcano plot showing the differential expression of genes, and nine of the interacting genes exhibited a marked increase in expression. E) Correlation analysis between FGF19 expression and CRC patient survival (n = 597). F) The FGF19 expression in colon adenocarcinoma (COAD) patients from the TCGA database (Normal, n = 41; Primary tumor, n = 286). G) Representative images of the luminance signals from the CRC (nonmetastasis), CRCLM, and CRC pulmanary metastasis (CRCPM) animal models. CT26‐luciference‐expressing (CT26‐luc) cells were injected into the caecum, spleen, and tail vein of mice to establish the CRC (CRC‐no metastasis), CRCLM, and CRCPM animal models, respectively. The luminance signals were detected by using the IVIS Lumina XRMS Series III instrument at the end of the experiment. H) Representative images and the luminance signals of the colon, lung, and liver tissues of the mice in CTL (n = 7), CRC (CRC‐no metastasis) (n = 6), CRCPM (n = 7), and CRCLM (n = 7) animal models. I) The levels of FGF15 in the serum of CRC, CRCLM, or CRCPM model mice were detected using the ELISA assay (CTL, n = 7; CRC, n = 6; CRCPM, n = 7; CRCLM, n = 7). J) IF staining showing the expression of FGF19 in the clinical samples using the microarray assay (n = 42). Data are shown as Mean ± SD. For I, **p< 0.01, versus CTL.
Figure 2
Figure 2
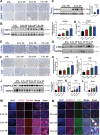
CRC cells release FGF19 (FGF15) which activates HSCs and promotes HSCs‐to‐CAFs differentiation. A) The experimental setup for the control (upper panel) and experimental (lower panel) conditions for the conditioned medium (CM) systems. B) Experimental setup for the control (upper panel) and experimental (lower panel) coculture systems. C,D) The protein levels of α‐SMA and FAP in the CM system (C) and SW620‐LX‐2 coculture system (D) were determined by the Western blotting; and the quantitative results are shown in the right panel. E,F) The protein levels of α‐SMA and FAP in the CM system (E) and CT26‐JS1 coculture system (F) were determined by the Western blotting; and the quantitative results are shown in the right panel. G) Effects of the recombinant FGF19 protein on the protein levels of FAP and α‐SMA in LX‐2 cells. H) Effects of FGF15 recombinant protein on the protein levels of FAP and α‐SMA in JS1 cells. I,J) Effects of infigratinib, a FGFR inhibitor on the protein levels of FAP and α‐SMA in SW620 CM system (I) or CT26 CM system (J). Data are shown as Mean ± SD, n = 3. For C, E: *p < 0.05, **p < 0.01 versus HSCs CM. For D, F‐H: *p < 0.05, **p < 0.01 versus the corresponding CTL. For I‐J: *p < 0.05, **p < 0.01 versus HSCs CM; #p < 0.05, ##p < 0.01 versus CRC CM.
Figure 3
Figure 3
FGF‐activated HSCs increase CRC cells migration. A,B) Representative images of SW620 (A) and CT26 (B) cells migration in the CRC cells‐HSCs coculture system (left panel); and the quantitative data were analyzed using Image J software (right panel). Photographs were taken 24 h after treatment. C) Representative images of cell migration in the SW620, SW620‐LX‐2 coculture, and FGF19‐treated coculture systems (left panel); and the quantitative data were analyzed using Image J software (right panel). D) Representative images of cell migration in the CT26, CT26‐JS1 coculture, or FGF15 treated coculture system (left panel); and quantitative results were analyzed using Image J software (right panel). E) Representative images of cell migration in SW620, SW620‐LX‐2 coculture, and infigratinib‐treated coculture system (left panel); and quantitative results were analyzed using Image J software (right panel). F) Representative images of cell migration in the CT26, CT26‐JS1 coculture, and infigratinib‐treated coculture systems (left panel). All the quantitative results were analyzed using Image J software (right panel). Data are shown as Mean ± SD from three independent experiments, n = 3. For A‐D: * p < 0.05, ** p < 0.01 versus the corresponding CTL. For E‐F: * p < 0.05, ** p < 0.01 versus the corresponding CTL; # p < 0.05, ## p < 0.01 versus CRC cells‐HSCs coculture group.
Figure 4
Figure 4
Activated HSCs secrete ANGPTL4 to promote CRC cells migration. A) Venn diagram showing the intersection between two datasets including GSE215882 and GSE224235, with ANGPTL4 was highlighted in the overlapping section. B) The mRNA levels of ANGPTL4 in tissues of the colorectal primary site and liver metastasis site were determined by spatially resolved transcriptomics (colorectal primary site, n = 9; Liver metastasis site, n = 8). C) The ANGPTL4 and FAP expression were simultaneously stained in the clinical sample tissues by using the microarray assay (n = 42). DAPI: blue color; FAP: green color; ANGPTL4: yellow color. D) The protein levels of ANGPTL4 in SW620 CM‐treated LX‐2 were determined by Western blotting (n = 3). E) Protein levels of ANGPTL4 after treated by the recombinant protein FGF19 were determined by Western blotting (n = 3). F) Levels of ANGPTL4 in the recombinant protein FGF19‐treated LX‐2 cell system (n = 4). G) Effect of the recombinant ANGPTL4 protein on the migration of SW620 cells (n = 3). H) Effect of coculture LX‐2 cells overexpressing ANGPTL4 with CRC cells on the migration ability of SW620 cells (n = 3). Data are shown as Mean ±SD from three independent experiments. For B, **p < 0.01 versus the colorectal primary group. For D, *p < 0.05 versus HSCs CM. For E‐G: *p < 0.05, **p < 0.01 versus the corresponding CTL. For H: **p < 0.01 versus the corresponding CTL; ## p < 0.01 versus SW620‐LX‐2 coculture group.
Figure 5
Figure 5
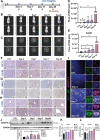
Effects of FGF15 and ANGPTL4 in mouse models of different degrees of CRCLM. A) Expression levels of MMP2 and MMP9 in the liver tissues of each group were detected by IHC staining. B,C) Protein levels of FGF15 in the liver tissues (B) and tumor sites (C) were determined by Western blotting. D) The serum level of FGF15 was determined by the ELISA assay. E) Expression of FGFR4, a FGF15 receptor in the liver tissues of each group was detected by IHC staining. F) Expression levels of α‐SMA and FAP in the liver tissues of each group were detected by IHC staining. G,H) Protein levels of α‐SMA in the liver tissues with tumors were determined by using Western blotting (G), and quantitative results were analyzed using Image J software (H). I) mRNA levels of FAP in the liver tissues with tumors were determined using RT‐qPCR analysis. J) Protein levels of ANGPTL4 in the liver tissues were determined by Western blotting (left panel), and the quantitative data were analyzed using Image J software (right panel). K,L) The liver tissue homogenates (K) and the serum (L) levels of ANGPTL4 were determined by the ELISA assay. M) Localization of FGF15 in CTCs within the liver of CRCLM mice by using the mIF analysis. N) Localization of ANGPTL4 in the liver tissue CAFs in CRCLM mouse model determined using the mIF analysis. Data are shown as Mean ± SD, n = 6. For B, D, H‐L, *p < 0.05, **p < 0.01 versus CTL. For C, **p < 0.01 versus 5.0 × 105 group.
Figure 6
Figure 6
The effects of FGF15 and ANGPTL4 in CRCLM mouse models with different time points. A) Timeline for the establishment of the mouse CRCLM model. CT26‐luc cells were injected into the spleens of BALB/c mice, then the mice were sacrificed at different time points. B) Representative images of live tumor‐bearing mice with tumors. C) Representative fluorescence signal imaging of the liver tissues. D,E) Quantitative results of the mice fluorescence intensity (D) and the liver fluorescence intensity (E) were analyzed using the Living Image software 4.4. F–H) Representative IHC staining of FGF15 and FGFR4 (F) MMP2 and MMP9 (G), α‐SMA, and FAP (H) in the liver tissues of mice in each group. I) Localization of ANGPTL4 in CAFs of liver tissues in CRCLM mouse model by using the mIF analysis. J) Protein levels of ANGPTL4 in the liver tissues with tumors were determined by using Western blotting (upper panel); and quantitative results were quantified and analyzed using Image J software (lower panel). K,L) Liver tissue homogenates (K) and the serum (L) levels of ANGPTL4 were determined by the ELISA assay. Data are shown as Mean ± SD. n = 6. *p < 0.05, **p < 0.01 versus CTL.
Figure 7
Figure 7
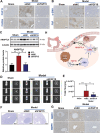
The FGF15/ANGPTL4 axis is involved in the progression of CRCLM. A,B) Representative images of IHC staining for FGF15 and FGFR4 (A), and for α‐SMA and FAP (B) in the liver tissues of mice in each group. C) The protein levels of ANGPTL4 in tumor‐bearing liver tissues were determined by using Western blotting (upper panel); and quantitative results were analyzed using Image J software (lower panel). D) Representative live‐animal imaging images of mice with tumors. CT26‐luc‐shNC cells and CT26‐luc‐shFGF15 cells were inoculated into the hepatic portal vein of BALB/c mice, respectively. Mice were randomly divided into 3 groups, including the sham, shNC, and shFGF15 groups. E) Quantitative results of the fluorescence intensity were analyzed using Living Image software 4.4. F) Representative H&E‐stained images of liver tissues in each group of mice. G) Representative images of IHC for MMP2 and MMP9 in mouse liver tissues from each group. H) Diagram showing that the FGF19/ANGPTL4 axis mediates the interaction between CRC cells and HSCs, and promotes CRC liver metastasis. Data are shown as Mean ± SD, n = 6. **p < 0.01 versus Sham; #p < 0.05, ##p < 0.01 versus shNC.

Similar articles

Cited by

References

    1. Beckers P., Berzenji L., Yogeswaran S. K., Lauwers P., Bilotta G., Shkarpa N., Hendriks J., Van Schil P. E., J. Thora. Dis. 2021, 13, 2628. - PMC - PubMed
    1. Zhou H., Liu Z., Wang Y., Wen X., Amador E. H., Yuan L., Ran X., Xiong L., Ran Y., Chen W., Wen Y., Signal Transduction Targeted Ther. 2022, 7, 70. - PMC - PubMed
    1. van der Geest L. G. M., Lam‐Boer J., Koopman M., Verhoef C., Elferink M. A. G., de Wilt J. H. W., Clin. Exp. Metastasis 2015, 32, 457. - PubMed
    1. Wang H., Li X. M., Peng R., Wang Y. X., Wang J. J., Semin. Cancer Biol. 2021, 71, 21. - PubMed
    1. Kow A. W. C., J. Gastrointest. Oncol. 2019, 10, 1274. - PMC - PubMed

MeSH terms

LinkOut - more resources