. 2025 Feb;12(7):e2409398.
doi: 10.1002/advs.202409398. Epub 2024 Dec 24.

Senescent Fibroblasts Drive FAP/OLN Imbalance Through mTOR Signaling to Exacerbate Inflammation and Bone Resorption in Periodontitis

Affiliations

Senescent Fibroblasts Drive FAP/OLN Imbalance Through mTOR Signaling to Exacerbate Inflammation and Bone Resorption in Periodontitis

Chenghu Yin et al. Adv Sci (Weinh). 2025 Feb.

Abstract

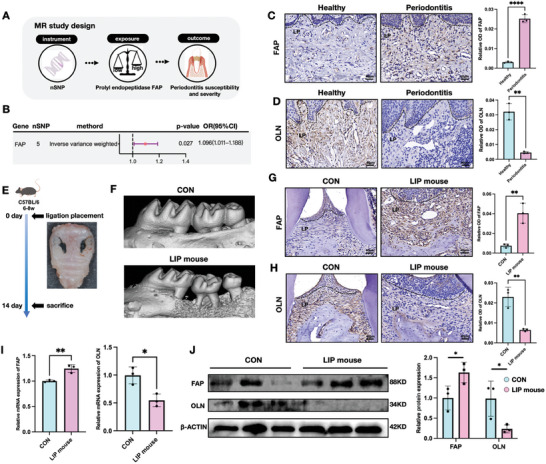
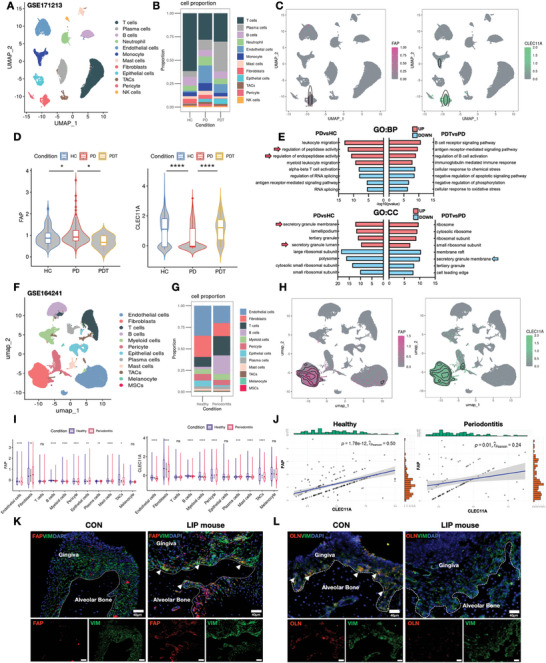
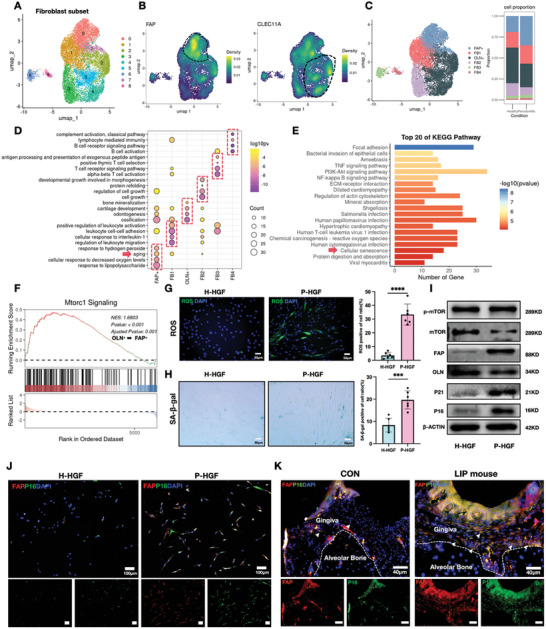
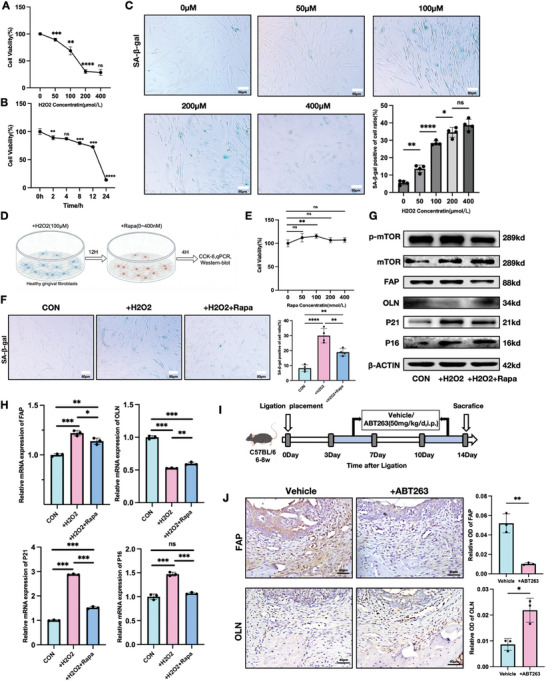
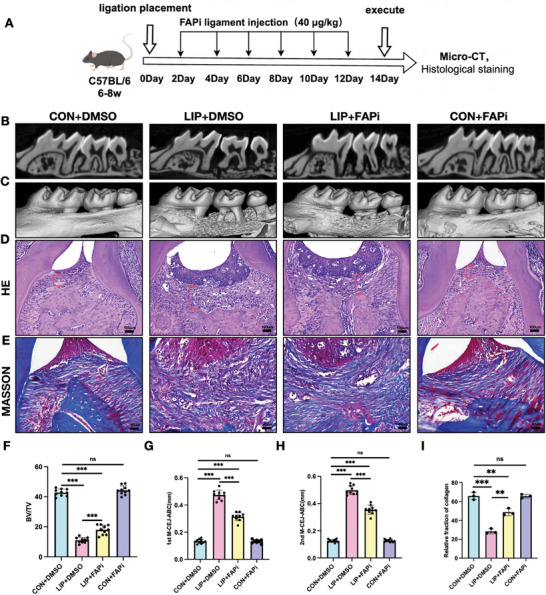
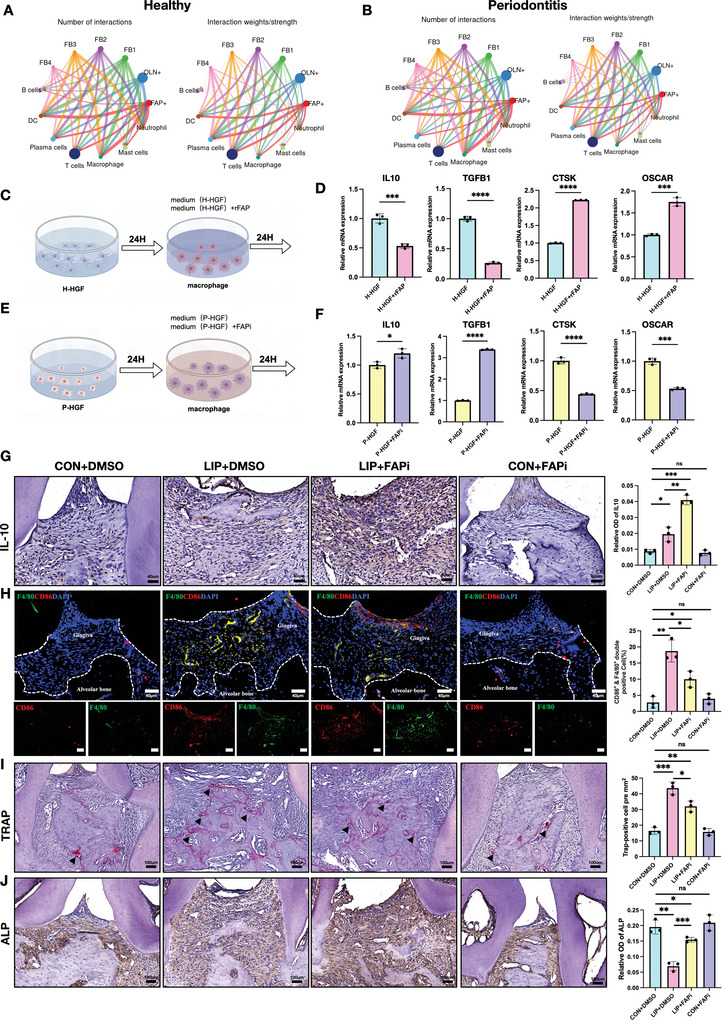
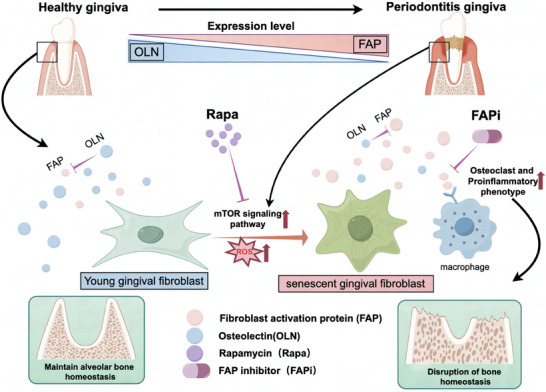
Fibroblast activation protein (FAP), predominantly expressed in activated fibroblasts, plays a key role in inflammatory bone diseases, but its role in periodontitis remains unclear. Accordingly, this study identified a positive association between FAP levels and periodontitis susceptibility using Mendelian randomization analysis. Human and mouse periodontitis tissues show elevated FAP and reduced osteolectin (OLN), an endogenous FAP inhibitor, indicating a FAP/OLN imbalance. Single-cell RNA sequencing revealed gingival fibroblasts (GFs) as the primary FAP and OLN source, with periodontitis-associated GFs showing increased reactive oxygen species, cellular senescence, and mTOR pathway activation. Rapamycin treatment restored the FAP/OLN balance in GFs. Recombinant FAP increased pro-inflammatory cytokine secretion and osteoclast differentiation in macrophages, exacerbating periodontal damage, whereas FAP inhibition reduced macrophage inflammation, collagen degradation, and bone resorption in experimental periodontitis. Therefore, senescent fibroblasts drive the FAP/OLN imbalance through mTOR activation, contributing to periodontitis progression. Consequently, targeting FAP may offer a promising therapeutic strategy for periodontitis.

Keywords: cellular senescence; fibroblast activation protein; macrophage; osteolectin; periodontitis.


Conflict of interest statement

The authors declare no conflict of interest.

Figures

Figure 1
Figure 1
FAP/OLN balance was interrupted in the human gingiva and mouse model of the periodontitis. A). Study design of Mendelian randomization (MR). B) MR results of the validation phase, which revealed that elevated FAP levels were significantly associated with periodontitis. C,D) Representative IHC staining and MOD values of FAP and OLN in healthy and periodontitis patient gingiva. A significant increase of FAP expression and a notable decrease of OLN expression within the gingival connective tissue (lamina propria) of periodontitis patients compared with healthy gingiva. Scale bar: 40 µm; LP: lamina propria. E) Strategy of ligature‐induced periodontitis (LIP) mouse model. F) Micro‐CT images and 3‐D visualization of the maxilla. G,H) Representative IHC staining and MOD values of FAP and OLN in control wild and Ligature induced periodontitis (LIP) mouse model. Elevated FAP expression and reduced OLN expression were found in LIP mouse model than the control model. Scale bar: 40 µm. I) RT‐PCR analysis quantified relative gene expression of Fap and Oln normalized to β‐actin. J) Western blot images and semi‐quantification of FAP and OLN protein levels in control and LIP mouse gingiva. Values are shown as the means±SD; n = 3; * p < 0.05; ** p < 0.01; *** p < 0.001; and **** p < 0.0001; MOD: mean optical density.
Figure 2
Figure 2
FAP/OLN balance is restored with periodontitis regression and gingival fibroblasts are the main source of FAP and OLN. A) UMAP diagram of single‐cell annotation for healthy control (HC), periodontitis (PD), and periodontitis after treatment (PDT) patients from sc‐RNA data GSE171213, which included 12 identified cell types. B) Histogram of gingival tissue cell ratio in HC, PD, and PDT patients. C) FAP and CLEC11A (encoding OLN gene) were mainly expressed in the fibroblasts cluster. D) Expression levels of FAP and CLEC11A in fibroblasts with HC, PD, and PDT patients, which suggested that FAP and OLN expression were disrupted in periodontitis and could be reversed after inflammation resolution. E) Gene Ontology of biological process and cellular component with differentially expressed genes in fibroblasts in PD versus HC or PDT versus PD, which indicated significant upregulation of inflammation‐related pathways as well as the endopeptidase pathway in periodontitis fibroblasts and increased enrichment of secreted proteins in periodontitis fibroblasts labeled by the red arrow while notably decreased following periodontal therapy indicated by the blue arrow. F) UMAP diagram of single‐cell annotation for the healthy and periodontitis samples from sc‐RNA data GSE164241. G) Histogram of gingival tissue cell ratio in healthy and periodontitis patients. H) FAP and CLEC11A (encoding OLN gene) were also mainly expressed in the fibroblasts cluster. I) The violin plot showing expression levels of FAP and CLEC11A in each cell type with healthy and periodontitis patients, which suggested that higher expression of FAP and lower expression of CLEC11A in periodontitis fibroblasts than that in healthy fibroblasts inconsistent with results from Figure 2D. J) Correlation analysis showing expression correlations of FAP with OLN in the healthy and periodontitis gingiva fibroblasts, which suggested a disrupted co‐expression pattern in periodontitis. K,L) IF staining of FAP or OLN (red), VIM (green, a typical fibroblast marker), and nuclei (blue) in control and LIP mouse gingiva, which suggested that FAP+ fibroblasts rather than OLN+ fibroblasts predominated in the gingiva of periodontitis mice; white arrows indicate double positive cells. Scale bar: 40 µm.Values are shown as the means±SD; * p < 0.05; ** p < 0.01; *** p < 0.001; and **** p < 0.0001.
Figure 3
Figure 3
Cell senescence contributes to the imbalance of FAP/OLN expression in gingival fibroblasts in periodontitis. A) UMAP diagram illustrates the cell sub‐clusters of fibroblasts from GSE164241. B) Density map of FAP and CLEC11A (encoding OLN gene) expression in the UMAP diagram. C) UMAP diagram of single‐cell annotation of fibroblasts subsets and histogram of ratio in healthy and periodontitis patients. D) GO enrichment analysis of fibroblasts subclusters. The red arrow indicates the aging process is enriched in FAP+ fibroblasts. E) The top 20 of KEGG enrichment analysis in FAP+ fibroblasts. The red arrow indicates the cellular senescence process is enriched in FAP+ fibroblasts. F) GSEA enrichment analysis suggested that mTOR signaling pathway is enriched in FAP+ fibroblasts compared to OLN+ fibroblasts. G) ROS activity of H‐HGF and P‐HGF from human samples was observed using DCFH‐DA fluorescent probe, which indicated that P‐HGF exhibited higher level of ROS activity compared with H‐HGF. Green: ROS. Scale bar: 50 µm. H) Staining and quantitative analysis of SA‐β‐gal in H‐HGF and P‐HGF. Scale bar: 50 µm. I) Western blot showing cell senescence specific markers, p‐MTOR, MTOR, P16, P21, FAP, and OLN in H‐HGF and P‐HGF. J) IF staining of FAP (red), P16(green), and nuclei (blue) in H‐HGF and P‐HGF, which suggested that higher FAP and P16 proteins were in P‐HGF rather than H‐HGF. Scale bar: 100 µm. K) IF staining of FAP (red), P16 (green), and nuclei (blue) in control and LIP mouse gingiva, which suggested that more FAP and P16 double‐positive cells gathered in LIP mouse gingiva; white arrows indicate double‐positive cells. Scale bar = 40 µm.Values are shown as the means ± SD; * p < 0.05, ** p < 0.01, *** p < 0.001, and **** p < 0.0001. H‐HGF: gingival fibroblasts from healthy gingiva; P‐HGF: gingival fibroblasts from periodontitis patient's gingiva.
Figure 4
Figure 4
Inhibiting the cell senescence of fibroblast rebalances the expression of FAP and OLN. A) Cell viability detected by the CCK‐8 assay at different concentrations of H2O2 after 12 h of stimulation; n = 4. B) Cell viability of H‐HGF at concentration of 100 µm H2O2 for different stimulation time; n = 4. C) Staining and quantitative analysis of SA‐β‐gal of H‐HGF stimulated by different concentrations of H2O2. Scale bar = 50 µm. D) Experimental design of the following imageE‐H. H‐HGF was stimulated with 100 µm H2O2 for 12 h, and continued to culture for 12 h, then added different concentrations of Rapamycin (Rapa) for 4 h. E) Cell viability at different concentrations of Rapa after 4 h of stimulation; n = 4. F) Staining and quantitative analysis of SA‐β‐gal of H2O2‐stimulated H‐HGF with or without Rapa. Scale bar = 50 µm. G) Western blot image of p‐MTOR, MTOR, p16, P21, FAP, and OLN protein levels of H2O2‐stimulated H‐HGF with or without Rapa. H) RT‐PCR was used to quantify the relative gene expression levels of P16, P21, FAP, and OLN normalized to β‐ACTIN in H2O2‐stimulated H‐HGF with or without Rapa. I) The strategy of establishment of the mouse model of periodontitis treated with senolytic drug ABT263. J) Representative IHC staining and MOD values of FAP and OLN in vehicle and treatment with ABT263 groups, which suggested senolytic therapy could alleviate FAP/OLN imbalance in periodontits; n = 3; scale bar: 40 µm. Values are shown as the means±SD; * p < 0.05, ** p < 0.01, *** p < 0.001, and **** p < 0.0001.MOD: mean optical density.
Figure 5
Figure 5
Periodontal injection of FAP inhibitor alleviates periodontal tissue damage in murine periodontitis. A) the strategy establishment of a mouse model of periodontitis treated with FAPi. B,C) Micro‐CT images and 3‐D visualization of the maxilla. D) Representative images of H&E‐stained section. The red line indicates the width of the lamina propria. Scale bar: 100 µm. E) Representative images of the Masson staining section. Scale bar: 40 µm. F–H) Maxilla alveolar bone was quantified by the BV/TV ratio and the cement‐to‐enamel junction to alveolar bone crest (CEJ‐ABC) distance. I) Collagen degradation was quantified by collagen volume fraction. Values are shown as the means ± SD; n = 3; ** p < 0.01, *** p < 0.001, and **** p < 0.0001.
Figure 6
Figure 6
FAPi inhibits macrophage pro‐inflammatory phenotype and osteoclast‐oriented differentiation phenotype. A) The number and strength of signals for different fibroblasts clusters with immune cell clusters in healthy gingiva sample; the color represents the cell clusters, and the width of the wires represents the relative strength and number of interactions. B) The number and strength of signals for different fibroblasts clusters with immune cell clusters in periodontitis gingiva sample. The number of interactions between FAP+ fibroblasts with dendritic cells and macrophages exhibited markedly increased in periodontitis condition. C) Experimental design of image D, the supernatant of H‐HGF added with rFAP (100ng mL−1) and was used to stimulate macrophages for 24 h followed by qPCR analysis. D) RT‐PCR analysis of anti‐inflammation genes IL10, TGFB1, and osteoclast differentiation genes CTSK and OSCAR in macrophages. E) Experimental design of image F, the supernatant of P‐HGF added with FAPi (5ug mL−1) and was used to stimulate macrophages for 24 h followed by qPCR analysis. F) RT‐PCR analysis of anti‐inflammation genes IL10, TGFB1, and osteoclast differentiation genes CTSK and OSCAR in macrophages. G) Representative images of IHC staining and MOD values of IL10, which indicated that FAPi promotes anti‐inflammatory cytokine IL‐10 expression in LIP gingival tissues. Scale bar: 40 µm (H) IF staining of CD86 (red), F4/80 (green), and nuclei (blue) and quantification of double‐positive cells, which suggested that FAPi reduced the number of pro‐inflammatory macrophages in LIP gingival tissues. Scale bar: 40 µm. I) Representative images of TRAP staining and quantification of TRAP‐positive stains were presented as number of TRAP positive areas/mm2, decreased number of the osteoclasts in LIP m treated by FAPi compared with LIP group. Black arrows indicated the TRAP‐positive osteoclast cells. Scale bar: 100 µm. J) Representative images of IHC staining and MOD values of alkaline phosphatase (ALP), which demonstrated higher osteogenic activity in LIP treated by FAPi. Scale bar: 100 µm. n = 3; * p < 0.05; ** p < 0.01; *** p < 0.001; and **** p < 0.0001. MOD: mean optical density.
Figure 7
Figure 7
Schematic diagram of the mechanism by which the imbalance of FAP and OLN expression in fibroblasts promotes the progression of periodontitis. The elevated ROS in periodontitis causes excessive activation of the mTOR signaling pathway in fibroblasts, accelerating cellular senescence. Senescent fibroblasts are featured by overexpression of FAP and decreased expression of OLN, which promote macrophages to obtain pro‐inflammatory and osteoclast phenotypes, thereby exacerbating bone resorption in periodontitis.

Similar articles

Cited by

References

    1. Kinane D. F., Stathopoulou P. G., Papapanou P. N., Nat. Rev. Dis. Primers 2017, 3, 17038. - PubMed
    1. Nibali L., Farias B. C., Vajgel A., Tu Y. K., Donos N., J. Dent. Res. 2013, 92, 868. - PubMed
    1. Caffesse R. G., Echeverría J. J., Periodontol 2000 2019, 79, 7. - PubMed
    1. Kornman K. S., J Periodontol 2008, 79, 1560. - PubMed
    1. Sanz M., Herrera D., Kebschull M., Chapple I., Jepsen S., Berglundh T., Sculean A., Tonetti M. S., E. W. P. and M. Consultants , J. Clin. Periodontol. 2020, 47, 4. - PubMed

MeSH terms

LinkOut - more resources