. 2025 Feb;12(7):e2412010.
doi: 10.1002/advs.202412010. Epub 2024 Dec 24.

Microphysiological System-Generated Physiological Shear Forces Reduce TNF-α-Mediated Cartilage Damage in a 3D Model of Arthritis

Affiliations

Microphysiological System-Generated Physiological Shear Forces Reduce TNF-α-Mediated Cartilage Damage in a 3D Model of Arthritis

Alexandra Damerau et al. Adv Sci (Weinh). 2025 Feb.

Abstract

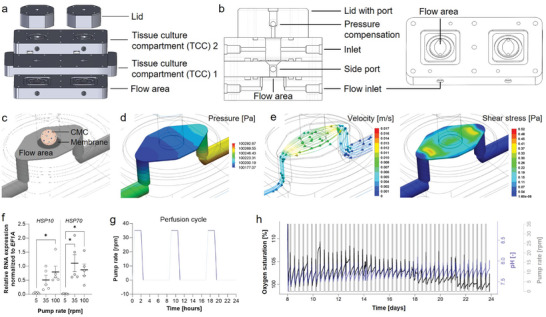
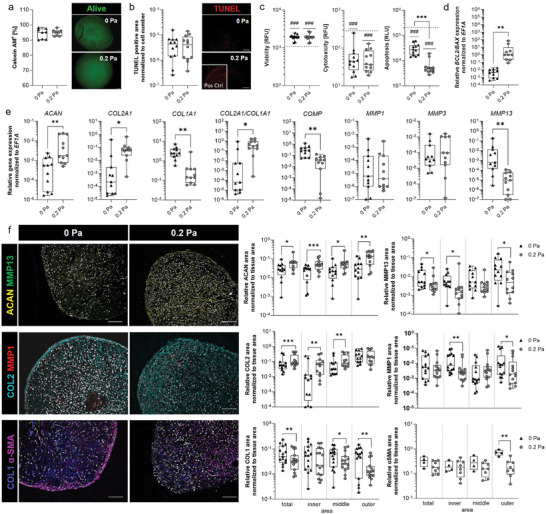
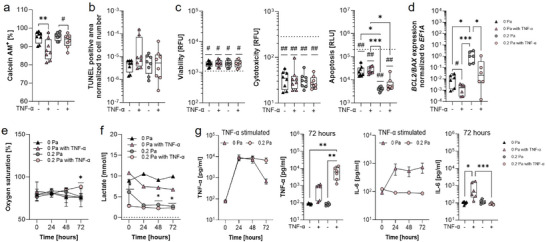
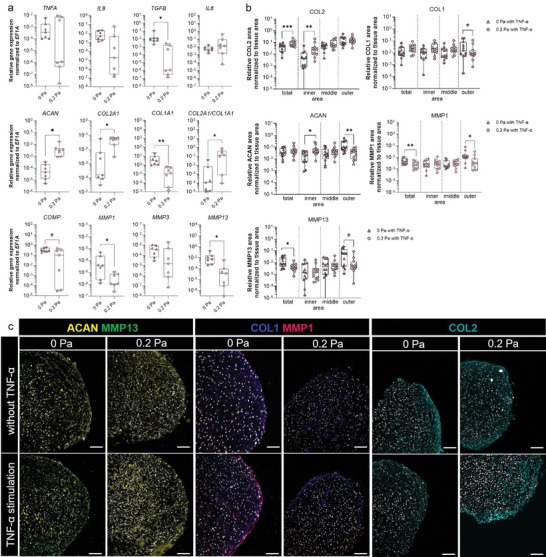
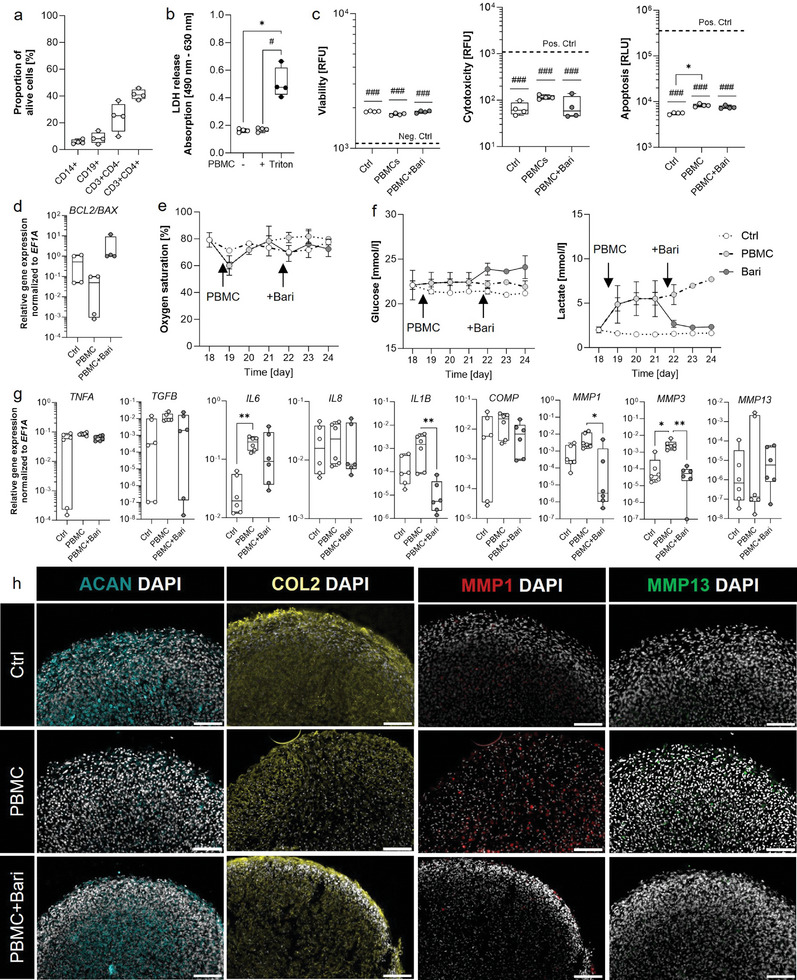
Osteoarthritis (OA) is a leading cause of disability, often resulting from overuse or injury, but inactivity can also contribute to cartilage degeneration. Conventional in vivo models struggle to isolate and study the specific effects of mechanical stress on cartilage health. To address this limitation, a microphysiological system (MPS) is established to examine how varying levels of shear stress impact cartilage homeostasis. The system allows for the cultivation of 3D chondrogenic microconstructs (CMCs) derived from human mesenchymal stromal cells, simulating both physiological and pathophysiological shear stress. Inflammation is induced via TNF-α or activated peripheral blood mononuclear cells to model cartilage damage, enabling the evaluation of therapeutic interventions. The study demonstrates the development of an arthritis-like phenotype and successful restoration of cartilage conditions through a JAK inhibitor under physiological shear stress. Physiological shear stress is identified as a critical factor in maintaining cartilage integrity. This MPS offers a standardized method to study shear stress, replicate cytokine-induced cartilage damage, and simulate key features of arthritis, providing a valuable alternative to animal models.

Keywords: TNF‐α; articular cartilage breakdown; chondrogenic 3D model; immune cells; matrix degeneration; mesenchymal stromal cell; microfluidic system; pro‐inflammatory cytokine.


Conflict of interest statement

M. Herrmann and T. Leeuw are employees of Sanofi‐Aventis Deutschland GmbH, which partly supported the study. The other authors declare that the research was conducted in the absence of any commercial or financial relationships that could be construed as a potential conflict of interest.

Figures

Figure 1
Figure 1
Design of the MPS to apply defined fluidic shear stress on CMCs. a) The MPS consists of dual‐compartment chambers based on polysulfone, featuring configurable geometries and separated by a polycarbonate membrane. b) Both compartments have channels for medium in‐ and out‐flow (inlets) and an integrated port‐lid‐system to withdraw medium or apply substances. Cross section and side view (left) and lower compartment in top view (right). c) Visualization of the CMC placed in the TCC1 cylinder on top of the membrane above the flow area. d) The pressure in Pa is shown with a pump rate of 35 rpm and shows a pressure difference of ≈100 Pa between the entrance of the flow chamber and the end. e) During the perfusion phase, a defined mechanical shear stress of ≈0.205 Pa is applied to the surface of the lower culture compartment as simulated with SolidWorks with a pump rate of 35 rpm. Fluid velocity is shown by lines with arrows with a medium velocity of ≈0.008 m −1s. f) CMCs were cultivated with pump rates of 5, 35, and 100 rpm for a perfusion phase of 1.5 h. Relative gene expression of heat shock protein 10 (HSP10) and HSP70 was normalized to the housekeeping gene elongation factor 1‐alpha 1 (EF1A). Statistical analysis was performed using the Friedman Test with Dunn's multiple comparison test g) Schematic overview of the intermittent perfusion cycle for 1.5 h three times daily representing the human locomotion and rest phase (6.5 h between cycles). h) Process monitoring of pump speed, pH, and oxygen saturation exemplary for one bioreactor run. pH is regulated by gassing with air and CO2 in regulated amounts. Process data were provided from the cloud web user interface of the OSPIN GmbH.
Figure 2
Figure 2
14 days of physiologic fluidic shear stress protects CMCs against cell apoptosis and matrix degradation resulting in mature 3D CMCs. a) Calcein‐AM staining was quantified using ImageJ (n = 8). b) TUNEL staining was performed to quantify apoptotic cells normalized to the cell number (DAPI staining) using ImageJ (n = 12). c) ApoTox‐Glo™ assay analyzing cell viability, cytotoxicity, and apoptosis level for n = 12. Dotted line for viability: 100 µg ml−1 Digitonin; cytotoxicity: 4% Triton X‐100; apoptosis: 0.1 mM Camptothecin. d) Relative expression of BCL2/BAX and e) cartilage‐related anabolic and catabolic marker genes normalized to the housekeeper EF1A (n = 11). f) Exemplary images for ACAN (yellow), MMP13 (green), COL2 (cyan), MMP1 (red), COL1 (blue), α‐SMA (magenta), and DAPI (gray) are shown. Scale bars represent 100 µm. Image quantification was performed to determine the stained area normalized to the tissue area (duplicates per data point) using ImageJ (n = 12; n = 4‐8 for αSMA). Data are shown as box plots (center line, median; box limits, upper and lower quartiles; whiskers, maximum and minimum values; all data points). Statistical analysis was performed using the Wilcoxon matched‐pairs signed rank test a–f), Mann‐Whitney U Test (f; αSMA) with *p < 0.05, **p < 0.01, ***p < 0.001, and Wilcoxon Signed Rank Test (c) with ### p < 0.001.
Figure 3
Figure 3
Short‐term exposure of 100 ng ml−1 TNF‐α for three days induced programmed cell death in CMCs. a) Calcein‐AM staining was performed after 21 days and quantified using ImageJ (n = 8). b) TUNEL staining was performed to quantify apoptotic cells normalized to the cell number (DAPI staining) using ImageJ (n = 8). c) ApoTox‐Glo™ assay analyzing cell viability, cytotoxicity, and apoptosis level for n = 8. Dotted line for viability: 100 µg ml−1 Digitonin; cytotoxicity: 4% Triton X‐100; apoptosis: 0.1 mM Camptothecin. d) Gene expression of BCL2 and BAX normalized to the housekeeping gene EF1A (n = 6). e) Daily measurement of oxygen consumption using a Clark electrode (n = 6). f) Lactate concentration [mmol/l] within the supernatant was measured using the Biosen C‐line analyzer (n = 6). The control (dotted line: mean lactate = 0.24 mmol l−1) shows lactate concentration within the cell‐free culture medium. g) Quantification of the cytokine levels of TNF‐α and soluble IL‐6, comparing 0 Pa and 0.2 Pa shear stress and the unstimulated and TNFα stimulated CMCs (n = 6). Data a‐d are shown in box plots (centerline, median; box limits, upper and lower quartiles; whiskers, maximum and minimum values) and e‐h are shown in symbols with mean and SEM. Statistical analysis was performed using the Friedman test with Dunn's multiple comparisons test (a–d; g) and the Mixed‐effects model with the Geisser‐Greenhouse correction and Tukey's multiple comparisons test (e–g). P‐values are indicated in the graphs with # p < 0.1, *p < 0.05, **p < 0.01, ***p < 0.001. Wilcoxon Signed Rank Test was performed to the control (c). P‐values are indicated in the graph with # p < 0.05, ## p < 0.01.
Figure 4
Figure 4
Physiological shear stress protects against TNF‐mediated CMC damage maintaining CMC homeostasis while hypophysiological shear stress supports TNF‐mediated CMC damage. a) Gene expression of inflammatory, anabolic, and catabolic marker genes was performed after total RNA extraction using SYBR Green and normalized to the housekeeping gene EF1A (n = 7). b) Image quantification was performed to determine the stained area normalized to the tissue area (duplicates per data point) using ImageJ (n = 11). c) Exemplary images for ACAN (yellow), MMP13 (green), COL1 (blue), MMP1 (magenta), COL2 (cyan), and DAPI (gray). Scale bars represent 100 µm. Data are shown as box plots (center line, median; box limits, upper and lower quartiles; whiskers, maximum and minimum values; all data points). Statistical analysis was performed using Wilcoxon matched‐pairs signed rank test with #p < 0.1, *p < 0.05, **p < 0.01, ***p < 0.001.
Figure 5
Figure 5
Activated PBMCs induce humoral‐mediated CMC damage, inflammatory mediators, and MMPs, which were attenuated by subsequent JAK inhibition. a) Proportion of alive PBMCs and composition of PBMCs (n = 4). b) Stimulation of the CMCs by activated PBMCs. LDH cytotoxicity assay was conducted from the supernatant after 24 h to analyze the cytotoxicity. High ctrl = 4% TritonTM X100 for 24 h (n = 4). c) ApoTox‐Glo™ assay analyzing cell viability, cytotoxicity, and apoptosis level for n = 4. Dotted line for viability: 100 µg ml−1 Digitonin; cytotoxicity: 4% Triton X‐100; apoptosis: 0.1 mM Camptothecin. d) Relative expression of BCL2‐BAX ratio and normalized to the housekeeper EF1A (n = 4). e) Daily measurement of oxygen consumption using a Clark electrode (n = 4‐8). f) Glucose and lactate concentration [mmol/l] within the supernatant was measured using the Biosen C‐line analyzer (n = 4–8). g) Relative expression of cartilage‐related anabolic and catabolic marker genes normalized to the housekeeper EF1A (n = 6). h) Exemplary images for ACAN (cyan), COL2 (yellow), MMP1 (red), MMP13 (green), and DAPI (gray) are shown (n = 4). Scale bars represent 100 µm. Data (a–d, g) are shown as box plots (center line, median; box limits, upper and lower quartiles; whiskers, maximum and minimum values; all data points) and e‐f are shown in symbols with mean and SEM. Statistical analysis was performed using the Friedman test (b,c), Kruskal‐Wallis test with Dunn's multiple comparisons test (d,g), and Mixed‐effects analysis applying the Geisser‐Greenhouse correction along with Tukey's multiple comparison test performed to the control (e,f). P‐values are indicated in the graphs with # p < 0.1, *p < 0.05, **p < 0.01. Wilcoxon Signed Rank Test was performed to the control (c). P‐values are indicated in the graph with ### p < 0.001.

Similar articles

References

    1. a) Burmester G. R., Feist E., Dorner T., Nat. Rev. Rheumatol. 2014, 10, 77; - PubMed
    2. b) Smolen J. S., Aletaha D., Barton A., Burmester G. R., Emery P., Firestein G. S., Kavanaugh A., McInnes I. B., Solomon D. H., Strand V., Yamamoto K., Nat. Rev. Dis. Primers 2018, 4, 18001; - PubMed
    3. c) Iannone F., Lapadula G., Aging Clin. Exp. Res. 2003, 15, 364. - PubMed
    1. a) Martel‐Pelletier J., Barr A. J., Cicuttini F. M., Conaghan P. G., Cooper C., Goldring M. B., Goldring S. R., Jones G., Teichtahl A. J., Pelletier J. P., Nat. Rev. Dis. Primers 2016, 2, 16072; - PubMed
    2. b) Hunter D. J., Bierma‐Zeinstra S., Lancet 2019, 393, 1745. - PubMed
    1. a) Firestein G. S., McInnes I. B., Immunity 2017, 46, 183; - PMC - PubMed
    2. b) Sanchez‐Lopez E., Coras R., Torres A., Lane N. E., Guma M., Nat. Rev. Rheumatol. 2022, 18, 258; - PMC - PubMed
    3. c) Glyn‐Jones S., Palmer A. J., Agricola R., Price A. J., Vincent T. L., Weinans H., Carr A. J., Lancet 2015, 386, 376. - PubMed
    1. Maglaviceanu A., Wu B., Kapoor M., Wound Repair Regen. 2021, 29, 642. - PubMed
    1. Vincent T. L., Curr. Opin. Pharmacol. 2013, 13, 449. - PubMed

MeSH terms

Substances

LinkOut - more resources