. 2025 Feb;12(7):e2410545.
doi: 10.1002/advs.202410545. Epub 2024 Dec 24.

Co-Delivery of aPD-L1 and CD73 Inhibitor Using Calcium Phosphate Nanoparticles for Enhanced Melanoma Immunotherapy with Reduced Toxicity

Affiliations

Co-Delivery of aPD-L1 and CD73 Inhibitor Using Calcium Phosphate Nanoparticles for Enhanced Melanoma Immunotherapy with Reduced Toxicity

Peng Liu et al. Adv Sci (Weinh). 2025 Feb.

Abstract

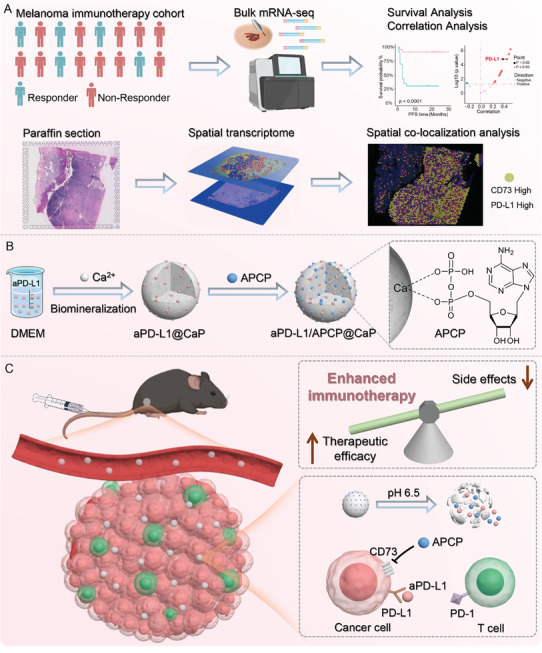
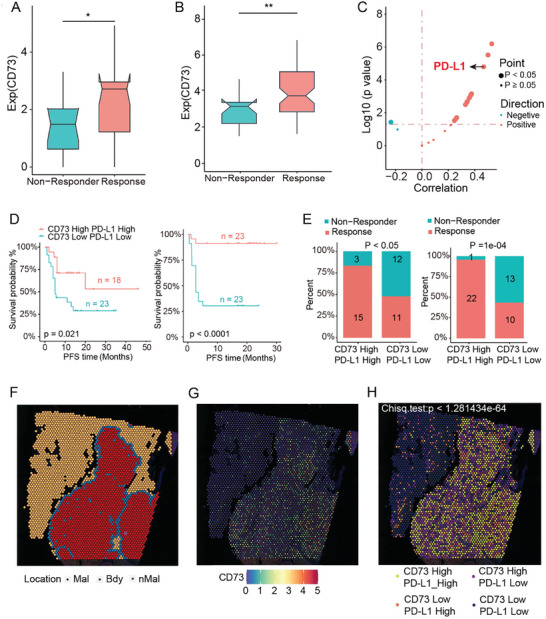
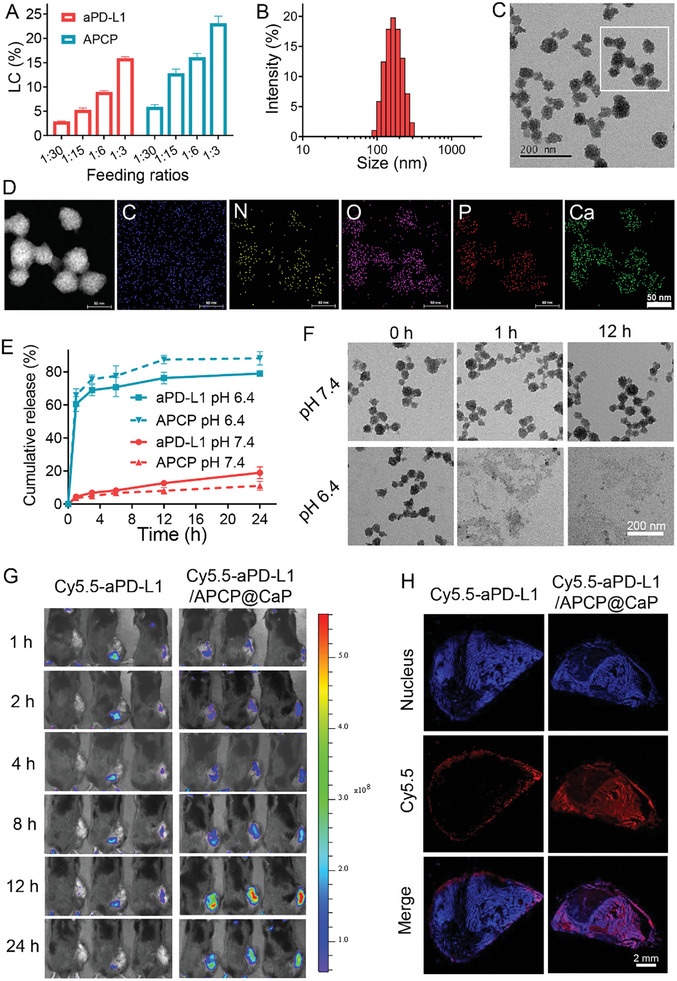
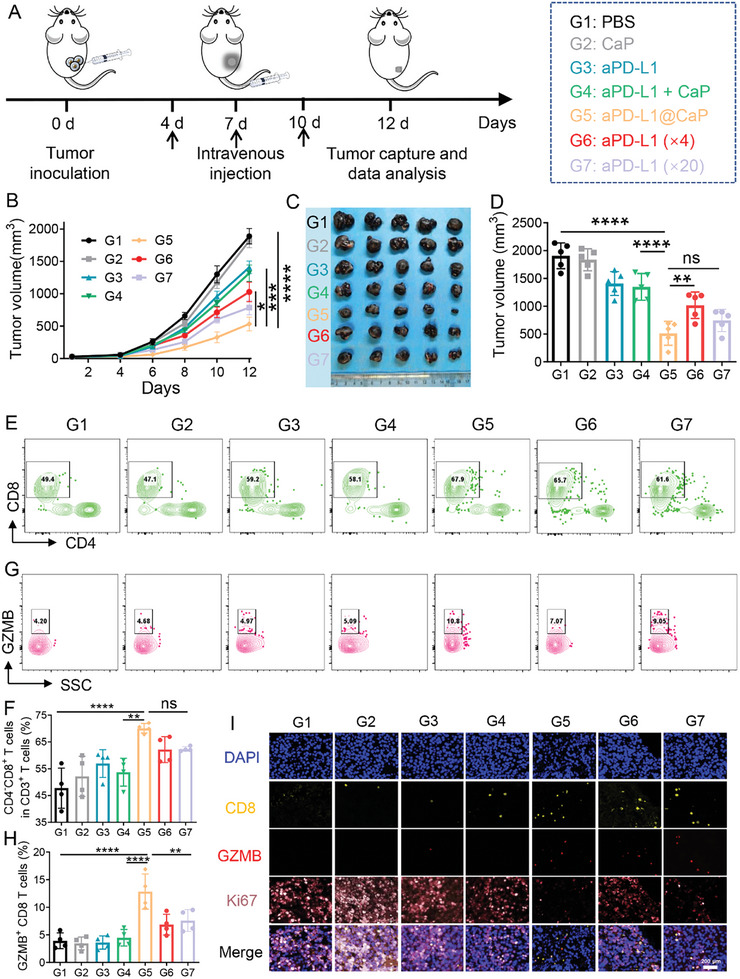
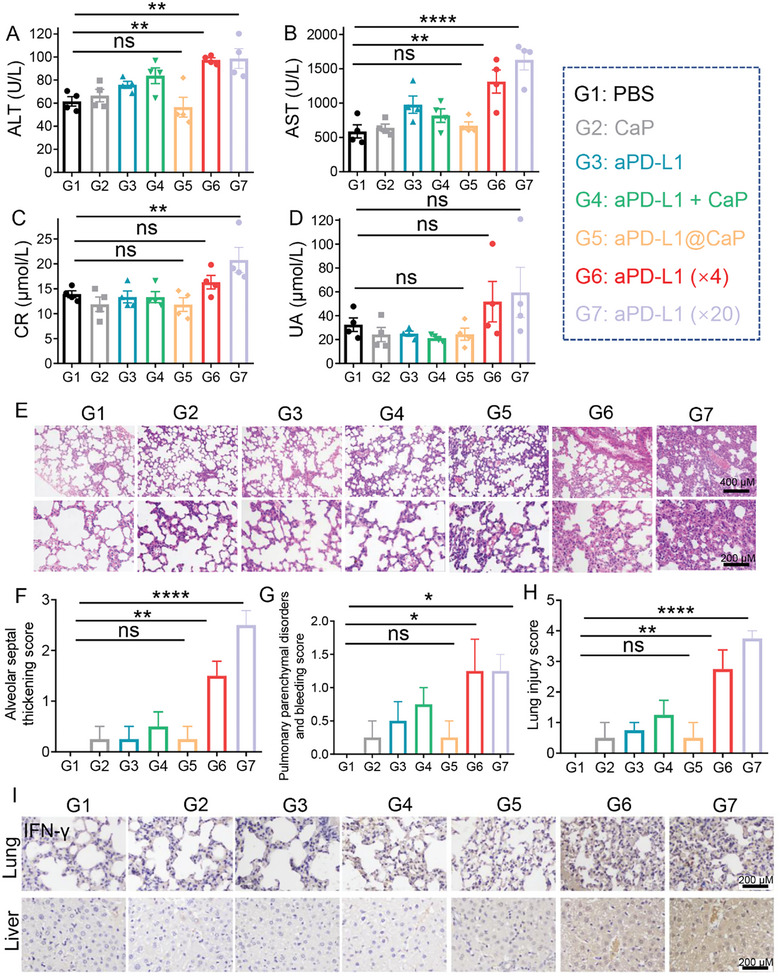
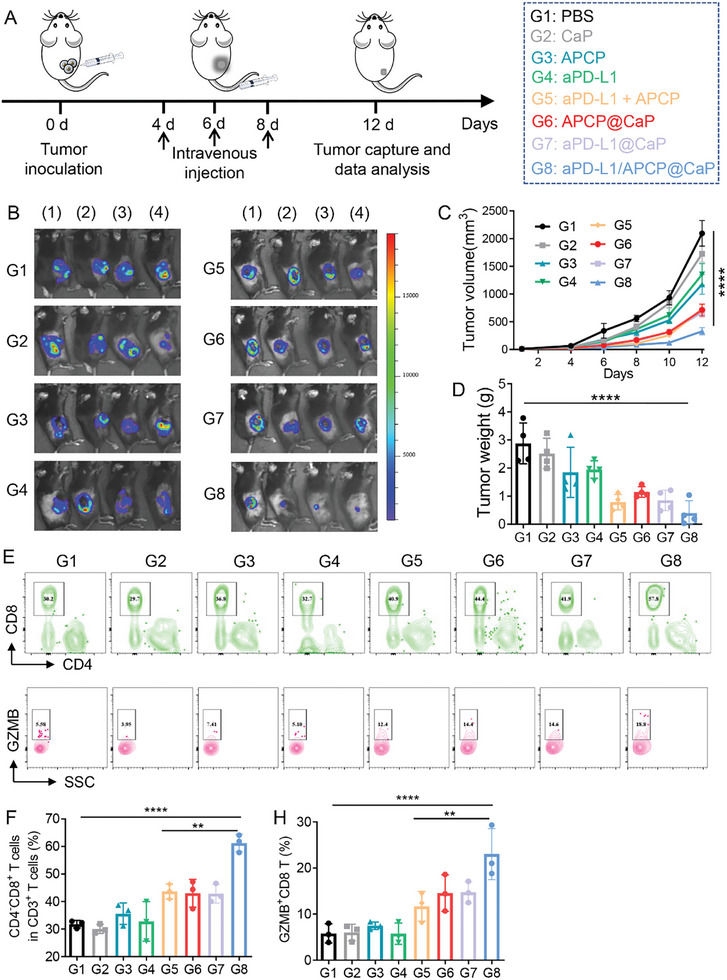
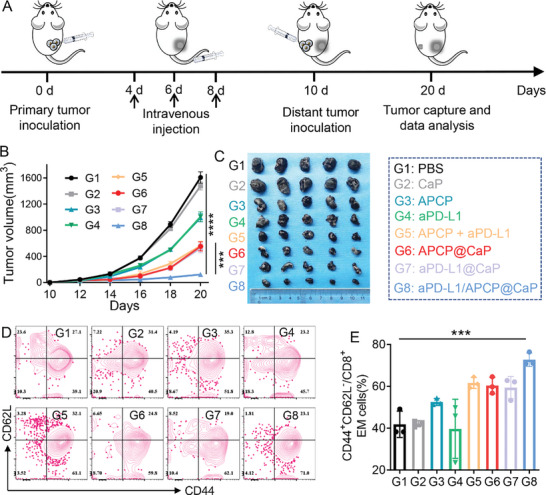
Melanoma, a malignant skin tumor, presents significant treatment challenges, particularly in unresectable and metastatic cases. While immune checkpoint inhibitors (ICIs) targeting PD-1/PD-L1 have brought new hope, their efficacy is limited by low response rates and significant immune-mediated adverse events (irAEs). Through multi-omics data analysis, it is discovered that the spatial co-localization of CD73 and PD-L1 in melanoma correlates with improved progression-free survival (PFS), suggesting a synergistic potential of their inhibitors. Building on these insights, a novel therapeutic strategy using calcium phosphate (CaP) nanoparticles is developed for the co-delivery of aPD-L1 and APCP, a CD73 inhibitor. These nanoparticles, constructed via a biomineralization method, exhibit high drug-loading capacity and pH-responsive drug release. Compared to free aPD-L1, the CaP-delivered aPD-L1 effectively avoids systemic side effects while significantly enhancing anti-tumor efficacy, surpassing even a 20-fold dose of free aPD-L1. Furthermore, the co-delivery of aPD-L1 and APCP via CaP nanoparticles demonstrates a synergistic anti-tumor effect, with substantial immune activation and prevention of tumor recurrence through immune memory effects. These findings suggest that the co-delivery of aPD-L1 and APCP using CaP nanoparticles is a promising approach for improving melanoma immunotherapy, achieving enhanced efficacy and reduced toxicity.

Keywords: biomineralization; drug delivery; immune checkpoint inhibitors; melanoma; synergistic therapy; tumor targeting.


Conflict of interest statement

The authors declare no conflict of interest.

Figures

Scheme 1
Scheme 1
A) Illustration showing the experimental workflow for multi‐omics data analysis. B) Schematic illustration of the fabrication process of aPD‐L1/APCP@CaP and C) its in vivo performance for synergistic immunotherapy of melanoma with reduced irAEs.
Figure 1
Figure 1
A) The Wilcoxon signed‐rank test was used to evaluate the difference in CD73 expression between response (n = 39) and non‐response (n = 29) groups in the Xiangya immunotherapy cohort. B) The Wilcoxon signed‐rank test was used to evaluate the difference in CD73 expression between response (n = 67) and non‐response (n = 21) groups in the public melanoma immunotherapy transcriptome data (PRJEB23709). C) Spearman correlation analysis of CD73 and immune checkpoint expression. D) Kaplan–Meier curves illustrating the synergistic effect on progression‐free survival (PFS) for patients stratified by CD73 and PD‐L1 expression levels in the Xiangya immunotherapy cohort (left panel) and the public melanoma immunotherapy transcriptome data (PRJEB23709) (right panel). p‐values were determined by the log‐rank test. E) The proportion of patients with different responses to immunotherapy in the Xiangya immunotherapy cohort (left panel) and the public melanoma immunotherapy transcriptome data (PRJEB23709) (right panel). p‐values were determined by Fisher's exact test. F) Four clusters identified corresponding to original histopathological annotations. G) Spatial feature map of CD73 gene expression. H) Distribution of groupings based on CD73 and PD‐L1 expression in the spatial transcriptome of melanoma. *p < 0.05, **p < 0.01.
Figure 2
Figure 2
A) Drug loading capacity of aPD‐L1/APCP@CaP nanoparticles at various aPD‐L1 and APCP feeding ratios. B) DLS analysis and C) TEM image of aPD‐L1/APCP@CaP nanoparticles. D) Elemental mapping analysis showing the distribution of C, N, O, P, and Ca in aPD‐L1/APCP@CaP nanoparticles. E) In vitro release profile of aPD‐L1 and APCP from nanoparticles under neutral (pH 7.4) and acidic (pH 6.4) conditions (n = 3). F) TEM images depicting structural changes of aPD‐L1/APCP@CaP nanoparticles under neutral and acidic conditions over time. G) In vivo fluorescence imaging of Cy5.5‐aPD‐L1/APCP@CaP and Cy5.5‐aPD‐L1 in B16F10 tumor‐bearing mice within 24 h post‐injection. H) Distribution of Cy5.5 fluorescence in tumor tissue sections from mice treated with Cy5.5‐aPD‐L1/APCP@CaP, indicating deeper penetration compared to free Cy5.5‐aPD‐L1.
Figure 3
Figure 3
A) Schematic representation of treatments administered to mice with subcutaneous B16F10 tumors. Various formulations were intravenously injected on days 4, 7 and 10. B) Tumor growth curves of mice receiving different treatments. C) Photographs of tumors post‐treatment. D) Tumor weights of treated mice (n = 5). E) Flow cytometry plots and F) statistical analysis of the proportions of CD3⁺CD8⁺ T cells in B16F10 tumors. G) Flow cytometry plots and H) statistical analysis of GZMB⁺CD8⁺ T cells in B16F10 tumors (n = 4). I) Immunofluorescence staining of CD8, GZMB, and Ki67 expression in tumor tissues following different treatments. *p < 0.05, **p < 0.01, ***p < 0.001, ****p < 0.0001.
Figure 4
Figure 4
A) Serum levels of ALT and B) AST, and C) CR and D) UA after various treatments (n = 4). E) Representative H&E‐stained lung sections for lung injury. Scale bar: 400 µm. F) Alveolar septal thickening scores, G) pulmonary parenchymal disorders and bleeding scores, and H) total lung injury scores after various treatments (n = 4). I) IFN‐γ immunohistochemical staining of lung and liver tissues from mice receiving different treatments. Scale bar: 100 µm. **p < 0.01, ***p < 0.001, ****p < 0.0001.
Figure 5
Figure 5
A) Schematic representation of treatments administered to mice with subcutaneous B16F10 tumors. PBS, CaP, APCP, aPD‐L1, APCP + aPD‐L1, APCP@CaP, aPD‐L1@CaP, and aPD‐L1/APCP@CaP were intravenously injected into B16‐F10 tumor‐bearing mice on days 4, 6, and 8. B) Whole‐body fluorescence imaging of tumor volume. C) Tumor growth curves. D) Tumor weights of tumor‐bearing mice receiving different treatments (n = 4). E) Flow cytometry plots and F) statistical analysis of the proportions of CD3⁺CD8⁺ T cells. G) Flow cytometry plots and H) statistical analysis of GZMB⁺CD8⁺ T cells in B16F10 tumors of mice receiving various treatments (n = 3). *p < 0.05, **p < 0.01, ***p < 0.001, ****p < 0.0001.
Figure 6
Figure 6
A) Schematic representation of the establishment of a bilateral B16F10 tumor model and the therapeutic regimen. PBS, CaP, APCP, aPD‐L1, APCP + aPD‐L1, APCP@CaP, aPD‐L1@CaP, and aPD‐L1/APCP@CaP were injected on days 4, 6, and 8 into mice with primary tumors on the right flank. A secondary distal tumor was inoculated on day 10, and distal tumor growth was monitored for 20 d. B) Distal tumor growth curves and C) tumor photographs of tumor‐bearing mice receiving various treatments (n = 5). D) Flow cytometric histograms and E) quantification showing the presence of TEM cells in distal tumors (n = 3). *p < 0.05, **p < 0.01, ***p < 0.001, ****p < 0.0001.

Similar articles

Cited by

References

    1. a) Chen Y., Zhu J., Ding J., Zhou W., Chin. Chem. Lett. 2024, 35, 108706;
    2. b) Long G. V., Swetter S. M., Menzies A. M., Gershenwald J. E., Scolyer R. A., Lancet 2023, 402, 485. - PubMed
    1. a) Guo J., Liu P., Wei B., Peng Y., Ding J., Zhang H., Zhang G., Su J., Liu H., Zhou W., Chen X., Nano Today 2023, 48, 101722;
    2. b) Brahmer J. R., Tykodi S. S., Chow L. Q., Hwu W. J., Topalian S. L., Hwu P., Drake C. G., Camacho L. H., Kauh J., Odunsi K., Pitot H. C., Hamid O., Bhatia S., Martins R., Eaton K., Chen S., Salay T. M., Alaparthy S., Grosso J. F., Korman A. J., Parker S. M., Agrawal S., Goldberg S. M., Pardoll D. M., Gupta A., Wigginton J. M., N. Engl. J. Med. 2012, 366, 2455; - PMC - PubMed
    3. c) Hsu J. C., Liu P., Song Y., Song W., Saladin R. J., Peng Y., Hu S., Lan X., Cai W., Chem. Soc. Rev. 2024, 53, 7657. - PMC - PubMed
    1. a) Sun C., Mezzadra R., Schumacher T. N., Immunity 2018, 48, 434; - PMC - PubMed
    2. b) Yarchoan M., Hopkins A., Jaffee E. M., N. Engl. J. Med. 2017, 377, 2500; - PMC - PubMed
    3. c) Li Z., Wu X., Zhao Y., Xiao Y., Zhao Y., Zhang T., Li H., Sha F., Wang Y., Deng L., Ma X., MedComm 2021, 2, 60. - PMC - PubMed
    1. a) Baxi S., Yang A., Gennarelli R. L., Khan N., Wang Z., Boyce L., Korenstein D., BMJ 2018, 360, k793; - PMC - PubMed
    2. b) Ao Y.‐Q., Gao J., Wang S., Jiang J.‐H., Deng J., Wang H.‐K., Xu B., Ding J.‐Y., Mol. Cancer 2023, 22, 70. - PMC - PubMed
    1. Deng R., Bumbaca D., Pastuskovas C. V., Boswell C. A., West D., Cowan K. J., Chiu H., McBride J., Johnson C., Xin Y., Koeppen H., Leabman M., Iyer S., mAbs 2016, 8, 593. - PMC - PubMed

LinkOut - more resources