. 2025 Feb;12(7):e2410107.
doi: 10.1002/advs.202410107. Epub 2024 Dec 24.

Metabolic Reprogramming of Macrophages by Biomimetic Melatonin-Loaded Liposomes Effectively Attenuates Acute Gouty Arthritis in a Mouse Model

Affiliations

Metabolic Reprogramming of Macrophages by Biomimetic Melatonin-Loaded Liposomes Effectively Attenuates Acute Gouty Arthritis in a Mouse Model

Chuchu Ma et al. Adv Sci (Weinh). 2025 Feb.

Abstract

Gouty arthritis is characterized by an acute inflammatory response triggered by monosodium urate (MSU) crystals deposited in the joints and periarticular tissues. Current treatments bring little effects owing to serious side effects, necessitating the exploration of new and safer therapeutic options. Macrophages play a critical role in the initiation, progression, and resolution of acute gout, with the cellular profiles closely linked to their activation and polarization. This suggests that metabolic regulation can be of significance in managing gouty inflammation. In this study, it is demonstrated that melatonin, a natural hormone, modulates the metabolic remodeling of inflammatory macrophages by shifting their metabolism from glycolysis to oxidative phosphorylation, further altering functions of the pathogenic macrophage. To improve melatonin delivery to the inflamed sites, macrophage membrane-coated melatonin-loaded liposomes (MLT-MLP) are developed. Benefiting from the inflammation-homing characteristic of macrophage membrane, such engineered liposomes effectively target the inflamed site and demonstrate potent anti-inflammatory effects, achieving an enhanced amelioration of acute gouty arthritis. In conclusion, this study proposes a novel strategy aimed at metabolic reprogramming of macrophages to attenuate the pathological injuries in acute gout, providing a potential therapeutic strategy of gout-associated diseases, especially gouty arthritis.

Keywords: acute gout; biomimetic; macrophage; melatonin; metabolic reprogramming.


Conflict of interest statement

The authors declare no conflict of interest.

Figures

Scheme 1
Scheme 1
Schematic illustration of the MLT‐MLP delivery system against acute gouty arthritis. A) Preparation of MLT‐MLP. B) Illustration of the targeting mechanism of MLT‐MLP. C) Illustration of pathological condition of gouty arthritis and the therapeutic effect of MLT‐MLP. D) The mechanism of action of MLT‐MLP on macrophages.
Figure 1
Figure 1
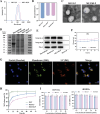
Characterization of MLT‐MLP. A) Size distribution of MLT‐LP and MLT‐MLP. B) Zeta potentials of MLT‐LP, MLT‐MLP, and macrophage membrane (Membrane). C) TEM images showing the morphology of MLT‐LP and MLT‐MLP. Scale bar, 100 nm. D) Protein composition of macrophage, membrane, MLT‐MLP, and MLT‐LP analyzed by Coomassie staining. E) Western blotting analysis showing the representative membrane protein of macrophage, membrane, MLT‐MLP, and MLT‐LP. F) The stability of MLT‐LP and MLT‐MLP in PBS. G) CLSM images of the colocalization of the nuclei (blue), membrane (green), and LP (red). Scale bar, 10 µm. H) Release profiles of MLT, MLT‐LP, and MLT‐MLP in PBS at 37 °C. I) Assessing cytotoxicity in iBMDMs and HUVECs. In all experiments, data are presented as mean ± SD for n = 3 biological replicates.
Figure 2
Figure 2
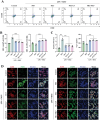
The targeting capability of MLT‐MLP. A) Uptake of DiI‐labeled MLT‐LP and MLT‐MLP (red) by RAW264.7 cells (blue). Scale bar, 100 µm. B) Fluorescence intensity quantitation of nanoparticles (MLT‐LP, MLT‐MLP) corresponding to (A). C) Uptake of different DiI‐labeled nanoparticles by HUVECs with or without TNF‐α stimulation. Scale bar, 100 µm. D) Fluorescence intensity quantitation of different nanoparticles (MLT‐LP, MLT‐MLP and Blocked MLT‐MLP) corresponding to (C). E) Flow cytometry analysis of ICAM‐1 and VCAM‐1 on HUVECs with or without TNF‐α stimulation. F) Quantification of the mean fluorescence intensity of the flow cytometry results corresponding to (E). G) In vivo fluorescence imaging of gout mice after intravenous injection of free DiR, DiR‐labeled MLT‐LP and DiR‐labeled MLT‐MLP. H) Distribution of MLT‐MLP in various organs compared with free DiR and DiR‐labeled MLT‐LP. I) Fluorescence intensity quantitation results corresponding to (H). J) Fluorescence images and intensity of MLT‐MLP (red), ICAM‐1, and VCAM‐1 (green) in normal or gout paws. In all experiments, data are presented as mean ± SD for n = 3 biological replicates. * p < 0.05, *** p < 0.001; ns, not significant.
Figure 3
Figure 3
Anti‐inflammatory effect of MLT‐MLP in vitro. A) Uptake of DiI‐labeled MLT‐MLP (red) by iBMDMs (blue). Scale bar, 100 µm. B) Fluorescence imaging of LPS+MSU stimulated iBMDMs stained with the DCFH‐DA probe (green) and quantitative analysis of ROS levels under different treatment conditions. Scale bar, 200 µm. C, D) Quantitative analysis of intracellular ROS levels in iBMDMs using flow cytometry. E) Detection of inflammatory cytokines (TNF‐α, IL‐6, and IL‐1β) produced from BMDMs stimulated with LPS+MSU or not, with different treatments. F) Immunoblot analysis of proteins from the supernatant (SN) and whole cell lysates (WCL) of BMDMs stimulated with LPS+MSU or not, with different treatments.G) Western blot analysis of ASC oligomerization in BMDMs with different treatments. In all experiments, data are presented as mean ± SD for n = 3 biological replicates. ** p < 0.01, *** p < 0.001; ns, not significant.
Figure 4
Figure 4
Effect of MLT‐MLP on the polarization of iBMDMs stimulated with LPS+MSU or not, with different treatments.A) Flow cytometry assay of iBMDMs polarization. M1 and M2 phenotypes are distinguished by the presence of CD80 and CD206. B) Quantification of the mean fluorescence intensity of the flow cytometry results corresponding to (A). C) Detection of iNOS and Arg‐1 expressed in iBMDMs with different treatments by ELISA assay. D) Immunofluorescence staining of F4/80 (red, pan‐macrophage marker), iNOS (M1 marker, green) or CD206 (M2 marker, green), and nuclei (blue) on iBMDMs. Scale bar, 50 µm. In all experiments, data are represented mean ± SD for n = 3 biological replicates. *** p < 0.001.
Figure 5
Figure 5
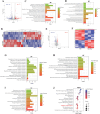
Transcriptomic and proteomic analyses. A) Volcano plots showing DEGs in PBS and MLT‐MLP groups (fold change ≥ 2 and p value < 0.05). B) Heatmap analysis of DEGs in PBS group and MLT‐MLP groups. C‐D) GO enrichment analysis of DEGs for BP (C) and MF (D). E) Volcano plots showing DEPs in PBS and MLT‐MLP groups (fold change ≥ 1.5 and p value < 0.05). F) Heatmap analysis of DEPs in PBS group and MLT‐MLP groups. G‐I) GO enrichment analysis of DEPs for BP (G), MF (H), and CC (I). J) KEGG enrichment analysis of DEPs.
Figure 6
Figure 6
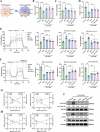
MLT‐MLP regulated the metabolic patterns of inflammatory macrophages stimulated with LPS+MSU through mTOR pathway. A) The scheme of metabolic pattern in M1 and M2 type macrophages. B) Detection of extracellular glucose levels of iBMDMs with different treatments (n = 3). C) Detection of extracellular lactic acid levels of iBMDMs with different treatments (n = 3). D) Detection of relative ATP production levels of iBMDMs with different treatments (n = 3). E) Representative ECAR profiles and corresponding parameter analysis of iBMDMs with different treatments (n = 5). F) Representative OCR profiles and corresponding parameter analysis of iBMDMs with different treatments (n = 5). G) Correlation analysis of relative lactic acid and ATP levels with iBMDMs polarization parameters levels, including iNOS and Arg‐1. H) Correlation analysis of relative lactic acid and ATP levels with inflammatory cytokines levels, including TNF‐α and IL‐6. I) Representative immunoblots and densitometric analysis for mTOR and p‐mTOR, S6, and p‐S6 in BMDMs stimulated with LPS+MSU or not, with different treatments. In all experiments, data are presented as mean ± SD. ** p < 0.01, *** p < 0.001.
Figure 7
Figure 7
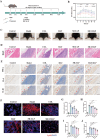
Treatment effect of MLT‐MLP in vivo. A) The experimental scheme. B) Change in paw swelling of gout mice under different treatments. C) Representative photographs of swelling paw obtained at 8 h after MSU injection. D) Photomicrographs stained by H&E. Scale bar, 100 µm. E) Immunohistochemical images of paw tissues in different groups. Scale bar, 100 µm. F,G) Immunofluorescence staining of Ly6G in paw tissues from different groups and corresponding fluorescence intensity quantitation. Scale bar, 100 µm. H–J) Detection of inflammatory cytokines (TNF‐α, IL‐6, and IL‐1β) in the serum of gout mice with different treatments. In all experiments, data are presented as mean ± SD for n = 5 biological replicates. * p < 0.05, ** p < 0.01, *** p < 0.001; ns, not significant.
Figure 8
Figure 8
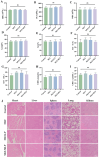
In vivo safety evaluation. A–E) Quantitative analysis of blood routine test, including RBCs, PLTs, WBCs, Lymph%, Gran% (n = 5). F–I) The level of AST, ALT, UREA, CREA (n = 5). J) Representative images of H&E staining of main organs. Scale bar, 100 µm. In all experiments, data are presented as mean ± SD. ns, not significant.

Similar articles

Cited by

References

    1. Dehlin M., Jacobsson L., Roddy E., Nat. Rev. Rheumatol. 2020, 16, 380. - PubMed
    1. Dalbeth N., Choi H. K., Joosten L. A. B., Khanna P. P., Matsuo H., Perez‐Ruiz F., Stamp L. K., Nat. Rev. Dis. Primers 2019, 5, 69. - PubMed
    1. a) Martin W. J., Walton M., Harper J., Arthritis Rheum. 2009, 60, 281; - PubMed
    2. b) Martinon F., Petrilli V., Mayor A., Tardivel A., Tschopp J., Nature 2006, 440, 237. - PubMed
    1. a) So A. K., Martinon F., Nat. Rev. Rheumatol. 2017, 13, 639; - PubMed
    2. b) Huang Y., Xu W., Zhou R., Cell Mol. Immunol. 2021, 18, 2114. - PMC - PubMed
    1. Lin W. W., Lu Y. C., Huang B. C., Chuang C. H., Cheng Y. A., Chen I. J., Liu H. J., Ho K. W., Liao T. Y., Liu E. S., Wu T. Y., Chang L. S., Hong S. T., Cheng T. L., Sci. Rep. 2021, 11, 14846. - PMC - PubMed

LinkOut - more resources