. 2024 Nov 13;27(12):111381.
doi: 10.1016/j.isci.2024.111381. eCollection 2024 Dec 20.

The dynamics of prion spreading is governed by the interplay between the non-linearities of tissue response and replication kinetics

Affiliations

The dynamics of prion spreading is governed by the interplay between the non-linearities of tissue response and replication kinetics

Basile Fornara et al. iScience. .

Abstract

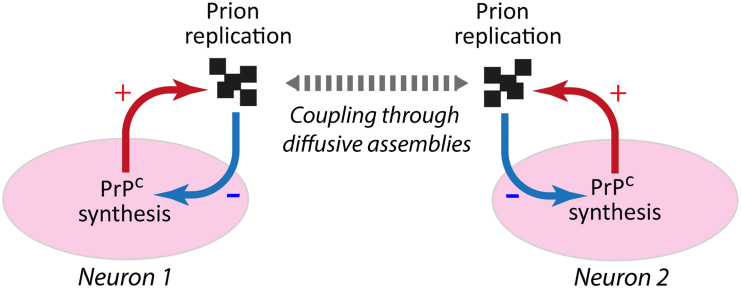
Prion diseases, or transmissible spongiform encephalopathies (TSEs), are neurodegenerative disorders caused by the accumulation of misfolded conformers (PrPSc) of the cellular prion protein (PrPC). During the pathogenesis, the PrPSc seeds disseminate in the central nervous system and convert PrPC leading to the formation of insoluble assemblies. As for conventional infectious diseases, variations in the clinical manifestation define a specific prion strain which correspond to different PrPSc structures. In this work, we implemented the recent developments on PrPSc structural diversity and tissue response to prion replication into a stochastic reaction-diffusion model using an application of the Gillespie algorithm. We showed that this combination of non-linearities can lead prion propagation to behave as a complex system, providing an alternative to the current paradigm to explain strain-specific phenotypes, tissue tropisms, and strain co-propagation while also clarifying the role of the connectome in the neuro-invasion process.

Keywords: Biochemistry; Biocomputational method; Neuroscience.


Conflict of interest statement

The authors declare that they have no known competing financial interests or personal relationships that could have appeared to influence the work reported in this paper.

Figures

None
Graphical abstract
Figure 1
Figure 1
Simulation configurations (A) Kinetic scheme describing prion replication and structural diversification. Experimental observations indicate that the replication process, independently of the strain, generates two conformationally distinct types of PrPSc assemblies: small oligomeric objects PrPScA (denoted as A) and assemblies capable of condensing PrPScBi (denoted as Bi where i refers to the size of the object). These two subpopulations undergo catalytic exchanges according to the kinetic scheme. The reaction constants of the kinetic scheme defines a strain. (B) Table summarizing the kinetic parameters of modeled strains used in our simulations. Based on experimental observations,,,, the templating activity of the A subpopulation is higher than that of the B subpopulation. (C and D) The evolution of these strains was computed on different types of modeled tissue: on a homogeneous neuron bed (C) and in the axonal dissemination between two clusters (D). In all simulations, we defined two zones surrounding a neuron. The replication field (in pink) limits the zone where templating of A and Bi subpopulations can occur. Since PrPC is an extracellularly anchored protein, this replication field is located around the somas and axons. The UPR controlling area (in blue) defines the zone around the soma where if the number of assemblies (A+iBi) exceeds a threshold, denoted σ, the UPR activates until the number of assemblies has remained under the threshold for a lag duration τ. While the UPR is activated, no templating reaction can occur in the associated replication area of the neuron. (E) UPR functional diagram illustrating the UPR activation threshold σ and the deactivation lag τ, which may be region-specific. (F) For neuron bed simulations, tissue 1 (T1) and tissue 2 (T2) are defined by the number of neurons in the NxN square grid and their UPR activation threshold (σ). (G) In the axonal dissemination model, two groups of neurons are connected unilaterally by axons. Simulations were seeded near either the receiving or emitting neurons. When replication was initiated near the receiving neurons, the spreading was classified as retrograde; when initiated near the emitting neurons, it was classified as anterograde. To assess the impact of axonal projections on the spreading process, the number of axons was varied from 1 to 20 under both retrograde and anterograde conditions. The results were also compared to those from neuron groups with the same spatial configuration but without axons (see the method details section).
Figure 2
Figure 2
Evolution of strain 1 and strain 2 on two neurons-beds differing in neuron density and UPR activation threshold (see method details for more details) Evolution of different metrics characterizing the process of replication and its sustainability: A, iBi, average size of assemblies (<Size>) and percentage of neurons with activated UPR. In all panels, replicates where population A was maintained within the simulation time frame are represented in blue while red curves correspond to replicates where A was eliminated before the end of the simulation. In rows (A) and (D) where almost all replicates converge, a typical evolution is highlighted in yellow. (A) and (B) correspond to the evolution of strain 1 on tissue 1 (S1T1) and tissue 2 (S1T2) respectively, while (C) and (D) represent the evolution of strain 2 on tissue 1 (S2T1) and tissue 2 (S2T2) respectively. For each of the four strain/tissue combinations, 50 independent replicates were computed.
Figure 3
Figure 3
Extension of temporal replicates and spatial pattern evaluation (A) An extension of one replicate of S1T2 (Figure 2B) with the same metrics highlighting the bifurcation between the two states depending on the elimination of A. The two phases are indicated above each panel. (B) Spatial pattern of the average percentage of simulation time spent in UPR activated state for each neuron over fifty independent replicates. (S1T1) and (S2T1) correspond, respectively, to the evolutions of strain 1 and strain 2 on tissue 1, which is a 3x3 neuron grid. (S1T2-phase1/S1T2-phase2) and (S2T2) correspond, respectively, to the evolutions of strain 1 and strain 2 on tissue 2, which is a 5x5 neuron grid. S1T2 has two patterns corresponding to the two equilibrium phases previously described. The first one (S1T2-phase1) is averaged between the start of the simulation and the moment A is eliminated. The second pattern (S1T2-phase2) is obtained by averaging the signals from the first UPR activation after A has been eliminated to the end of the simulation.
Figure 4
Figure 4
Effect of the initial seed amount on the evolution of strain 1 and strain 2 on tissue 1 and tissue 2 As in Figure 2, the evolutions of A, iBi, average size of assemblies (<Size>) and percentage of neurons with activated UPR are represented for 50 independent replicates. (A) and (B) correspond to the evolution of strain 1 on tissue 1 (S1T2) and tissue 2 (S1T2) respectively, while (C) and (D) represent the evolution of strain 2 on tissue 1 (S2T1) and tissue 2 (S2T2) respectively. Compared to the results on Figure 2, increasing the seed amount does not appear to impact the final equilibriums but, for T1S1, most replicates eliminate their A subassemblies and fail to reach the outcome previously observed. The comparison between initial seeding conditions can be further analyzed with the help of Figure S1 showing the percentage of replicates maintaining their A subassemblies as a function of simulation time.
Figure 5
Figure 5
Effect of the replication rate on the evolution and co-propagation of strains on tissues 1 and 2 (A) By taking as a reference the templating parameters of strains 1 and 2 described in Figure 1B (named N1 and N2 respectively), we either doubled the replication rates for both A and Bi (H1 and H2 for strain 1 and strain 2 respectively) or divided them by 5 (L1 and L2 for strain 1 and strain 2 respectively) to get the high and low templating configurations for both strains. The evolutions of five different strain combinations were then computed and summarized on graph (B) for simulations on tissue 1 and graph (C) for tissue 2. The co-propagation of a strain combination is grouped with the two strains individually for ease of comparison. The bars represent the outcomes of 50 independent replicates, white means no assembly sustainably replicated within the simulation time frame.
Figure 6
Figure 6
Influence of the number and orientation of axonal connections on the spreading process between two unilaterally linked neuron clusters for three distinct prion strains For all graphs, the x axis accounts for the number of axons (Naxon) linking the clusters, negative values correspond to retrograde propagation (seeding at the receiving neurons) and positive ones to anterograde (seeding at the emitting neurons). For each connectivity value and each strain, fifty replicates were computed. Their output is represented by dots in the scatterplots of (A) for strain 1, (B) for strain 2 and (C) for strain 3. We studied the influence of connectivity on three different metrics: the time of arrival to the second cluster as well as the average size (<Size>) and quantity of assemblies (A+iBi) at the time of arrival. Blue dots correspond to simulations which eliminated their A subassemblies before reaching the second neuron group, while red ones maintained them. The black line is the median value of the replicates for each metric. (D) The proportion of replicates maintaining their A subassemblies during the simulation timescale as a function of connectivity (Naxon) for all three strains highlights the impact of axons and UPR response on the sustainable replication of subpopulations. (E) Typical frame taken from a video of the retrograde dissemination process (see Video S5 for full video). Seeding was done at the receiving neurons on the left, A assemblies are represented in green while Bi assemblies are colored from red to yellow depending on size. This shows that the dissemination was guided by axons and facilitated by the A subpopulation being more replicative and diffusive. In this configuration, the system self-organized with a front of A followed by the Bi subpopulation, with larger assemblies located closer to the place of inoculation.
Figure 7
Figure 7
The interplay between prion replication and tissue response is a complex feedback loop Misfolded PrP assemblies accumulate near neurons due to the replication process, leading to downregulation of PrPC via UPR activation. This mechanism, combined with the extracellular diffusion of prion assemblies, whether via Brownian motion or guided diffusion along axons, drives prion dissemination. It may also contribute to the coupling of cell responses within a brain region, influencing the selection of specific types of PrPSc subassemblies and the emergence of spatial PrPSc deposition patterns.

Similar articles

References

    1. Prusiner S.B. Novel proteinaceous infectious particles cause scrapie. Science. 1982;216:136–144. doi: 10.1126/science.6801762. - DOI - PubMed
    1. Griffith J.S. Self-replication and scrapie. Nature. 1967;215:1043–1044. doi: 10.1038/2151043a0. - DOI - PubMed
    1. Walker L.C., Schelle J., Jucker M. The Prion-Like Properties of Amyloid-beta Assemblies: Implications for Alzheimer's Disease. Cold Spring Harbor Perspect. Med. 2016;6 doi: 10.1101/cshperspect.a024398. - DOI - PMC - PubMed
    1. Bruce M.E. TSE strain variation. Br. Med. Bull. 2003;66:99–108. doi: 10.1093/bmb/66.1.99. - DOI - PubMed
    1. Beringue V., Vilotte J.L., Laude H. Prion agent diversity and species barrier. Vet. Res. 2008;39:47. doi: 10.1051/vetres:2008024. - DOI - PubMed

LinkOut - more resources