

L-shaped relationship between atherogenic index of plasma with uric acid levels and hyperuricemia risk
- PMID: 39717100
- PMCID: PMC11663671
- DOI: 10.3389/fendo.2024.1461599
L-shaped relationship between atherogenic index of plasma with uric acid levels and hyperuricemia risk
Abstract
Background: Hyperuricemia is a major risk factor for cardiovascular disease. This study aimed to investigate the relationship between the atherogenic index of plasma (AIP) and serum uric acid (SUA) levels, as well as the risk of hyperuricemia.
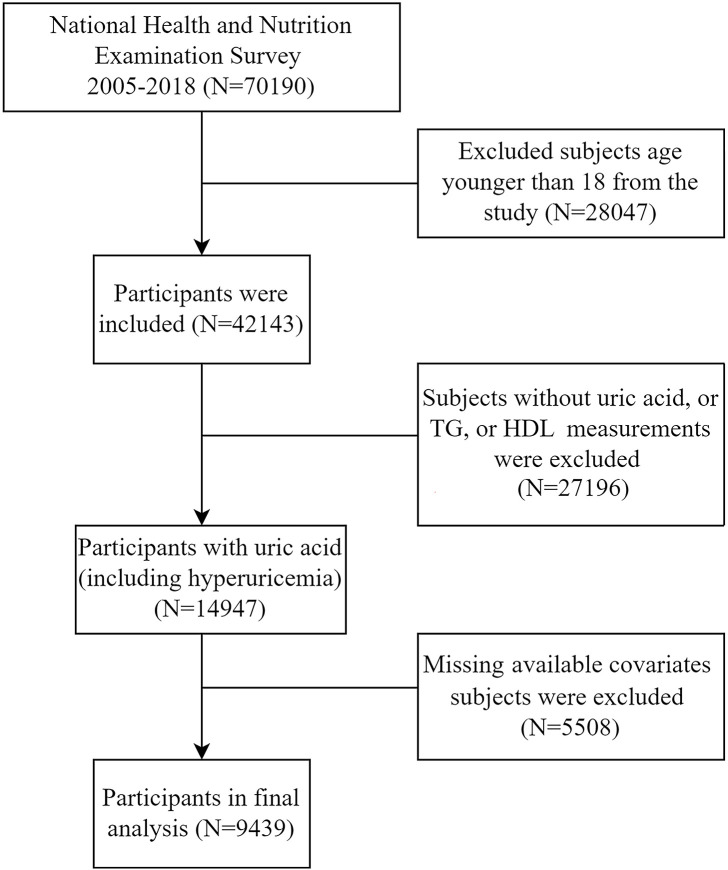
Methods: Utilizing data from the National Health and Nutrition Examination Survey (NHANES), we conducted a cross-sectional study involving 9,439 participants aged 18 years and above with complete triglyceride (TG) and high-density lipoprotein cholesterol (HDL-C) data. AIP was calculated as the logarithm of the ratio of TG to HDL-C. Weighted linear regression, weighted logistic regression, subgroup analysis, generalized additive model, restricted cubic spline and two-part linear and logistic regression were utilized to examine the relationships between AIP and SUA levels and hyperuricemia risk.
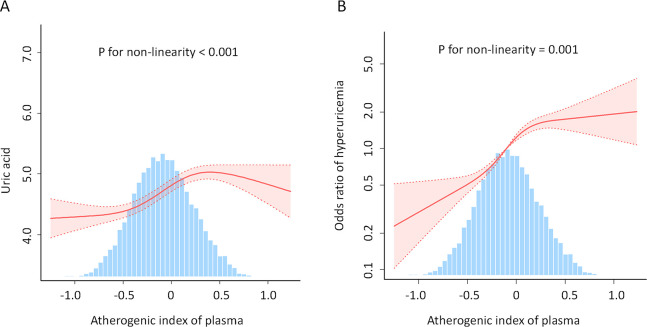
Results: We identified a non-linear and L-shaped relationship between AIP and both SUA levels and hyperuricemia prevalence, with significant increasing observed up to a saturation point (0.588 for uric acid levels and 0.573 for hyperuricemia prevalence). Below these thresholds, the odds ratios (OR) for increased SUA and hyperuricemia were 0.854 (95% confidence interval [CI]: 0.762, 0.946) and 4.4 (95% CI: 3.528, 5.488), respectively (P<0.001). Beyond these points, the associations were not statistically significant.
Conclusion: Our findings suggest that AIP is significantly and non-linear associated with SUA levels and hyperuricemia risk, with a saturation effect observed beyond specific thresholds. These insights could inform clinical strategies for managing cardiovascular and metabolic risks associated with elevated AIP. Further longitudinal studies are warranted to confirm these associations and elucidate the underlying mechanisms.
Keywords: atherogenic index of plasma; cardiovascular risk; cross-sectional study; hyperuricemia; uric acid.
Copyright © 2024 Huang, Chen, Jie, Li and Chen.
Conflict of interest statement
The authors declare that the research was conducted in the absence of any commercial or financial relationships that could be construed as a potential conflict of interest.
Figures
References
-
- Min Q, Wu Z, Yao J, Wang S, Duan L, Liu S, et al. . Association between atherogenic index of plasma control level and incident cardiovascular disease in middle-aged and elderly Chinese individuals with abnormal glucose metabolism. Cardiovasc Diabetol. (2024) 23:54. doi: 10.1186/s12933-024-02144-y - DOI - PMC - PubMed
MeSH terms
Substances
LinkOut - more resources
Full Text Sources
Medical
Miscellaneous