. 2024 Dec 9:15:1443880.
doi: 10.3389/fendo.2024.1443880. eCollection 2024.

Neuron stress-related genes serve as new biomarkers in hypothalamic tissue following high fat diet

Affiliations

Neuron stress-related genes serve as new biomarkers in hypothalamic tissue following high fat diet

Caixia Liang et al. Front Endocrinol (Lausanne). .

Abstract

Objective: Energy homeostasis is modulated by the hypothalamic is essential for obesity progression, however, the gene expression profiling remains to be fully understood.

Methods: GEO datasets were downloaded from the GEO website and analyzed by the R packages to obtain the DEGs. And, the WGCNA analysis and PPI networks of co-expressed DEGs were designed using STRING to get key genes. In addition, the single-cell sequencing datasets and GTEx database were utilized to receive the neuron-stress genes from the key genes. Further, high-fat diet (HFD)-induced hypothalamic tissue of mice was used as an animal model to validate the mRNA up-regulation of neuron-stress genes. In addition, the Bmi1 gene was identified as a hub gene through the LASSO model and nomogram analysis. Western blot confirmed the high expression of Bmi1 in hypothalamic tissue of HFD mice and PA-stimulated microglia. Immunofluorescence staining showed that HFD induced the activation of microglia and the expression of Bmi1 in hypothalamic tissue.

Results: We found that six genes (Sacm1l, Junb, Bmi1, Erbb4, Dkc1, and Suv39h1) are neuron stress-related genes and increased in the HFD-induced mice obesity model, Bmi1gene was identified as a key genes that can reflect the pathophysiology of obesity.

Conclusions: Our research depicted a comprehensive activation map of cell abnormality in the obese hypothalamus and Bim1 may be a diagnostic marker in the clinic, which provides a new perspective and basis for investigating the pathogenesis of obesity.

Keywords: BMI1; WGCNA; hypothalamic inflammation; neuron stress; obesity.


Conflict of interest statement

The authors declare that the research was conducted in the absence of any commercial or financial relationships that could be construed as a potential conflict of interest.

Figures

Figure 1
Figure 1
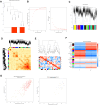
Comparison of DEGs present in obese and lean samples. (A) A flowchart showing the steps in this study. Box plots of the gene expression data after normalization. (B) The horizontal axis represents the sample symbol, which is divided into a lean and obese group, with four samples in each group, and the vertical axis represents the gene expression values. The black line in the box plot represents the median value of gene expression. (C, D) Principal component analysis (PCA) plots showing the expression variability of DEGs across all the samples. The red colour represent lean sample, the green colour represent obese sample. (E) The volcano plot for DEGs in the GSE100012 dataset. The X-axes index the -log (P value), and the y-axes index the log fold change. The red dots represent upregulated genes, and the blue dots represent downregulated genes. The gray dots represent genes with no significant difference. FC is the fold change. (F) The expression data are represented as a data matrix wherein each row represents a gene and each column represents a sample. The green coded bar above the heatmap represents the lean sample set, and the red coded bar represents the obese sample. The expression level is described in terms of the color ratio of the upper left corner. Hierarchical clustering is shown by the top tree view, indicating the degree of relatedness in gene expression. DEG, differentially expressed genes; FC, fold change.
Figure 2
Figure 2
Construction and module analysis of weighted gene coexpression network analysis (WGCNA). (A) Sample clustering dendrogram based on Euclidean distance. (B) Network topology analysis under various soft-threshold powers. Left: The x-axis represents the soft-threshold power. The y-axis represents the fit index of the scale-free topology model. Right: The x-axis represents the soft-threshold power. The y-axis reflects the average connectivity (degree). (C) Clustering dendrogram of genes with different similarities based on topological overlap and the assigned module color. (D) The heatmap depicts the topological overlap matrix (TOM) among all modules included in the analysis. The light color represents a low overlap, and the progressively darker red color represents an increasing overlap. (E) Eigengene dendrogram and eigengene adjacency plot. (F) Module–trait association. Each row corresponds to a module, and each column corresponds to a feature. Each cell contains the corresponding correlation and P value. This table is color-coded according to the relevance of the color legend. (G) Scatter plot showing correlations of gene significance for obese vs. module membership in the red and tan modules.
Figure 3
Figure 3
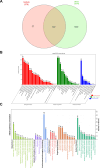
Results of GO enrichment and KEGG analysis. (A) The overlapping genes were screening with red and tan modules and DEGs by Venn map. (B) The abscissa represents the enriched GO terms, and the ordinate represents the number and ratio of the differentially expressed genes. Different colors represent different GO classes: Molecular function, Biological process, and Cellular component. Abbreviation: GO, gene ontology. (C) KEGG bar graph. The related terms were rearranged and classified according to the six classifications of KEGG pathways, and the length of the bar represents the number of gene counts.
Figure 4
Figure 4
PPI network and three significant modules of the overlapping genes. (A) PPI network of overlapping genes created by STRING. The most significant module identified by MCODE. Circles represent genes, and lines represent PPIs. (B–D) The top 10 genes were calculated from the PPI network of the DEGs by the degree, MCC, and betweenness. DEG, Deferentially expressed gene; PPI, protein–protein interaction.
Figure 5
Figure 5
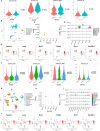
Preprocessing of the single-cell sequencing data and cell cluster identification with GSE125065 and GSE205667. First, with GSE125065: (A, B, F, G) Gene filtering and PCA clustering of the gene expression matrix. (C, H) Dot plot showing the expression of overlapping genes in each main cell type. The darker color indicates higher expression, and the larger size represents a higher percentage of expression. (D, E, I, J) Expression pattern of six neuron stress-related genes at the single-cell level, shown in violin and UMAP plots.
Figure 6
Figure 6
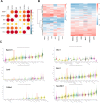
Neuron stress-related gene expression in the human hypothalamus. (A) A correlation heatmap of neuron stress-related gene expression in 121 human hypothalamic tissue samples. (B) Heatmap of coexpression correlations between neuron stress-related genes. A darker red color in the upper right part indicates a stronger correlation. A heatmap of neuron stress-related gene expression levels is shown in the right panel. (C) Expression of Neuron stress-related genes in different tissues, as the violin plots show.
Figure 7
Figure 7
Differential expression of neuronal stress-related genes in the HFD-induced hypothalamic tissue model of obesity. Relative mRNA expression of neuron stress-related genes measured by Q-PCR in the HFD-induced hypothalamic tissue model of obesity. Results are presented as mean ± SEM (n=3). The differences between multiple groups were evaluated using one-way analysis of variance (ANOVA). Compared with NCD group: *P<0.05, **P<0.01, ***P<0.001. NCD, normal chow diet group; HFD, high-fat diet group.
Figure 8
Figure 8
Investigation of the accuracy of the hub genes for distinguishing Obese samples from lean samples. Construction of the LASSO model based on 6 candidate biomarkers (A). The image shows the log (lambda) value of the 2 hub genes, and (B) the image shows the distribution of the log (lambda) value in the LASSO model. (C) The nomogram was used to predict the occurrence of obesity.
Figure 9
Figure 9
A high-fat diet induces hypothalamic microglia activation and Bmi1 expression. (A) The protein expression of Bmi1 was analyzed by western blot in the HFD-induced hypothalamic tissue model of obesity. (B) Immunofluorescence staining was used to observe the expression of Iba1 and Bmi1 in the hypothalamus of mice. The fluorescence intensity was normalized to that of each group fed with NCD group set as 1. The data were obtained from three independent experiments. Values represent the mean ± SEM. **p <.01; ns, no significance by two-way analysis of variance (ANOVA). Scale bar: 50 μm. NCD, normal chow diet group; HFD, high-fat diet group; 3V, the third ventricle. (C) Western blot was used to analyzed the expression of iNOS, IL-6, and Bmi1 proteins after PA administration in BV2 microglial cells.

Similar articles

References

    1. Abarca-Gómez L, Abdeen ZA, Hamid ZA, Abu-Rmeileh NM, Acosta-Cazares B, Acuin C, et al. . Worldwide trends in body-mass index, underweight, overweight, and obesity from 1975 to 2016: a pooled analysis of 2416 population-based measurement studies in 128·9 million children, adolescents, and adults. Lancet. (2017) 390:2627–42. doi: 10.1016/S0140-6736(17)32129-3 - DOI - PMC - PubMed
    1. Friedman JM, Halaas JL. Leptin and the regulation of body weight in mammals. Nature. (1998) 395:763–70. doi: 10.1038/27376 - DOI - PubMed
    1. Lam TK, Schwartz GJ, Rossetti L. Hypothalamic sensing of fatty acids. Nat Neurosci. (2005) 8:579–84. doi: 10.1038/nn1456 - DOI - PubMed
    1. Morton GJ, Cummings DE, Baskin DG, Barsh GS, Schwartz MW. Central nervous system control of food intake and body weight. Nature. (2006) 443:289–95. doi: 10.1038/nature05026 - DOI - PubMed
    1. Coll AP, Farooqi IS, O’Rahilly S. The hormonal control of food intake. Cell. (2007) 129:251–62. doi: 10.1016/j.cell.2007.04.001 - DOI - PMC - PubMed

LinkOut - more resources