

Performance Comparison of 10 State-of-the-Art Machine Learning Algorithms for Outcome Prediction Modeling of Radiation-Induced Toxicity
- PMID: 39717195
- PMCID: PMC11665468
- DOI: 10.1016/j.adro.2024.101675
Performance Comparison of 10 State-of-the-Art Machine Learning Algorithms for Outcome Prediction Modeling of Radiation-Induced Toxicity
Abstract
Purpose: To evaluate the efficacy of prominent machine learning algorithms in predicting normal tissue complication probability using clinical data obtained from 2 distinct disease sites and to create a software tool that facilitates the automatic determination of the optimal algorithm to model any given labeled data set.
Methods and materials: We obtained 3 sets of radiation toxicity data (478 patients) from our clinic: gastrointestinal toxicity, radiation pneumonitis, and radiation esophagitis. These data comprised clinicopathological and dosimetric information for patients diagnosed with non-small cell lung cancer and anal squamous cell carcinoma. Each data set was modeled using 11 commonly employed machine learning algorithms (elastic net, least absolute shrinkage and selection operator [LASSO], random forest, random forest regression, support vector machine, extreme gradient boosting, light gradient boosting machine, k-nearest neighbors, neural network, Bayesian-LASSO, and Bayesian neural network) by randomly dividing the data set into a training and test set. The training set was used to create and tune the model, and the test set served to assess it by calculating performance metrics. This process was repeated 100 times by each algorithm for each data set. Figures were generated to visually compare the performance of the algorithms. A graphical user interface was developed to automate this whole process.
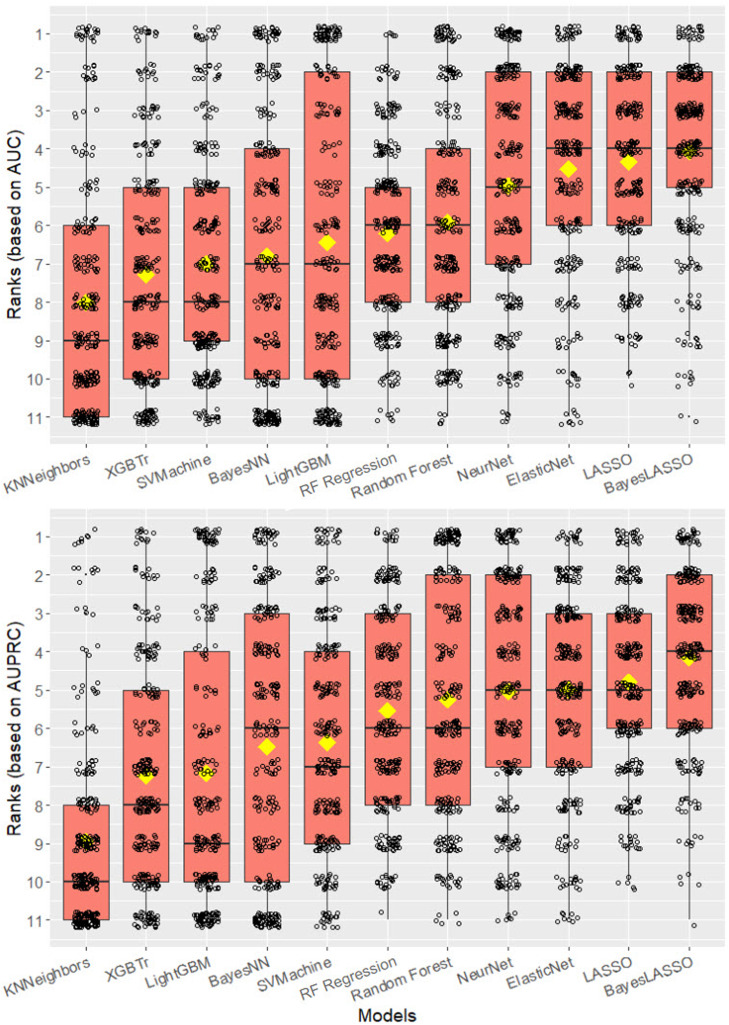
Results: LASSO achieved the highest area under the precision-recall curve (0.807 ± 0.067) for radiation esophagitis, random forest for gastrointestinal toxicity (0.726 ± 0.096), and the neural network for radiation pneumonitis (0.878 ± 0.060). The area under the curve was 0.754 ± 0.069, 0.889 ± 0.043, and 0.905 ± 0.045, respectively. The graphical user interface was used to compare all algorithms for each data set automatically. When averaging the area under the precision-recall curve across all toxicities, Bayesian-LASSO was the best model.
Conclusions: Our results show that there is no best algorithm for all data sets. Therefore, it is important to compare multiple algorithms when training an outcome prediction model on a new data set. The graphical user interface created for this study automatically compares the performance of these 11 algorithms for any data set.
© 2024 The Authors.
Conflict of interest statement
Ramon M. Salazar, Alexandra O. Leone, Saurabh S. Nair, and Joshua S. Niedzielski report support through a grant from Varian Medical Systems. Joshua S. Niedzielski also reports a research grant from the Fund for Innovations in Cancer Informatics. Brian De reports grant funding from RSNA (RR2111) and honoraria from Sermo, Inc Prajnan Das reports honoraria from ASTRO, ASCO, Beyer, Imedex, Physicians Education Resource, and Conveners. Laurence E. Court reports grants from Varian Medical Systems, NCI, CPRIT, Wellcome Trust, and the Fund for Cancer Informatics.
Figures


Similar articles
-
Development and validation of a prediction model for coronary heart disease risk in depressed patients aged 20 years and older using machine learning algorithms.Front Cardiovasc Med. 2025 Jan 9;11:1504957. doi: 10.3389/fcvm.2024.1504957. eCollection 2024. Front Cardiovasc Med. 2025. PMID: 39850379 Free PMC article.
-
Machine learning algorithms for outcome prediction in (chemo)radiotherapy: An empirical comparison of classifiers.Med Phys. 2018 Jul;45(7):3449-3459. doi: 10.1002/mp.12967. Epub 2018 Jun 13. Med Phys. 2018. PMID: 29763967 Free PMC article.
-
Development and Validation of an Interpretable Machine Learning Prediction Model for Total Pathological Complete Response after Neoadjuvant Chemotherapy in Locally Advanced Breast Cancer: Multicenter Retrospective Analysis.J Cancer. 2024 Aug 1;15(15):5058-5071. doi: 10.7150/jca.97190. eCollection 2024. J Cancer. 2024. PMID: 39132160 Free PMC article.
-
[Constructing a predictive model for the death risk of patients with septic shock based on supervised machine learning algorithms].Zhonghua Wei Zhong Bing Ji Jiu Yi Xue. 2024 Apr;36(4):345-352. doi: 10.3760/cma.j.cn121430-20230930-00832. Zhonghua Wei Zhong Bing Ji Jiu Yi Xue. 2024. PMID: 38813626 Chinese.
-
Can Predictive Modeling Tools Identify Patients at High Risk of Prolonged Opioid Use After ACL Reconstruction?Clin Orthop Relat Res. 2020 Jul;478(7):0-1618. doi: 10.1097/CORR.0000000000001251. Clin Orthop Relat Res. 2020. PMID: 32282466 Free PMC article.
Cited by
-
Decision tree-based machine learning algorithm for prediction of acute radiation esophagitis.Biochem Biophys Rep. 2025 Mar 28;42:101991. doi: 10.1016/j.bbrep.2025.101991. eCollection 2025 Jun. Biochem Biophys Rep. 2025. PMID: 40230494 Free PMC article.
-
Mechanistic Exploration of Aristolochic Acid I-Induced Hepatocellular Carcinoma: Insights from Network Toxicology, Machine Learning, Molecular Docking, and Molecular Dynamics Simulation.Toxins (Basel). 2025 Aug 5;17(8):390. doi: 10.3390/toxins17080390. Toxins (Basel). 2025. PMID: 40864066 Free PMC article.
-
The impact of anal cancer treatment on female sexuality and intimacy: a systematic review.Support Care Cancer. 2025 Aug 15;33(9):788. doi: 10.1007/s00520-025-09791-1. Support Care Cancer. 2025. PMID: 40813732 Free PMC article. Review.
References
LinkOut - more resources
Full Text Sources
