

Identification of superior haplotypes and candidate gene for seed size-related traits in soybean (Glycine max L.)
- PMID: 39717350
- PMCID: PMC11663835
- DOI: 10.1007/s11032-024-01525-1
Identification of superior haplotypes and candidate gene for seed size-related traits in soybean (Glycine max L.)
Abstract
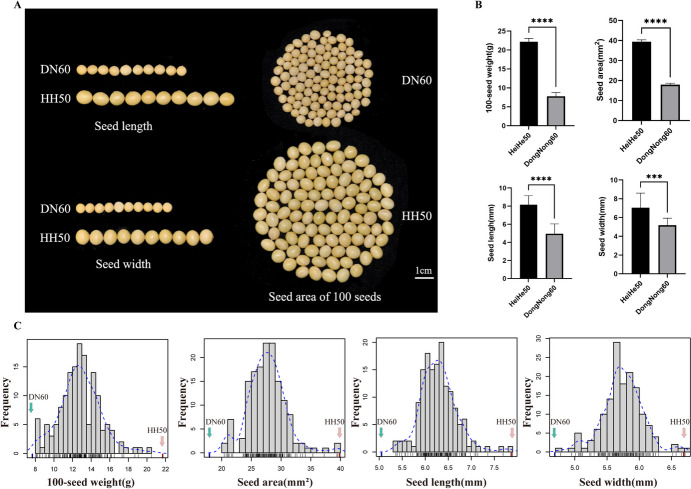
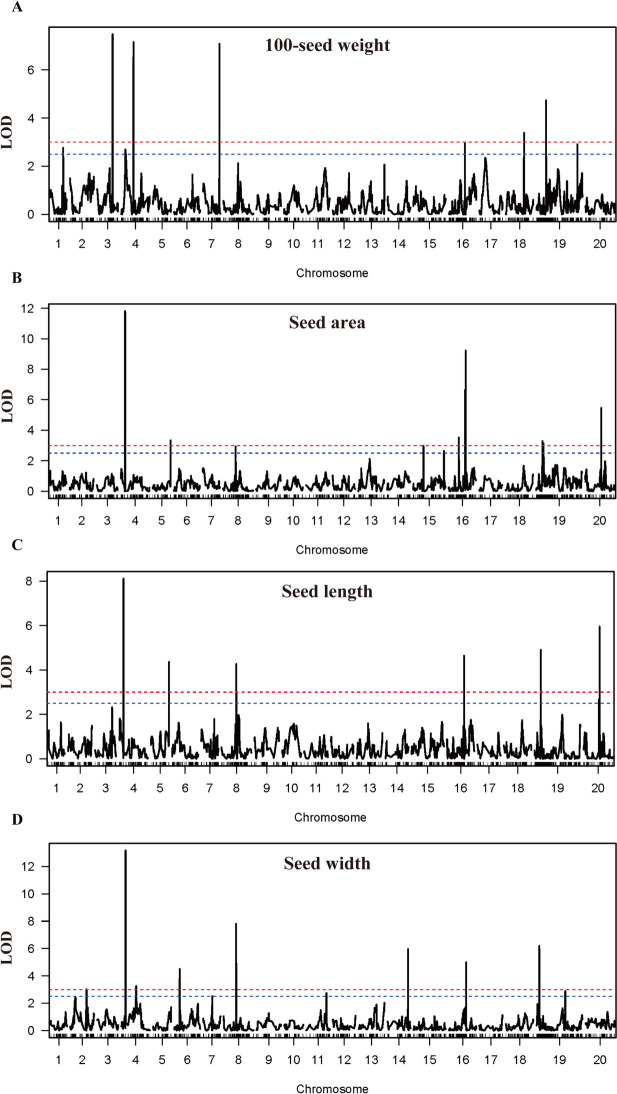
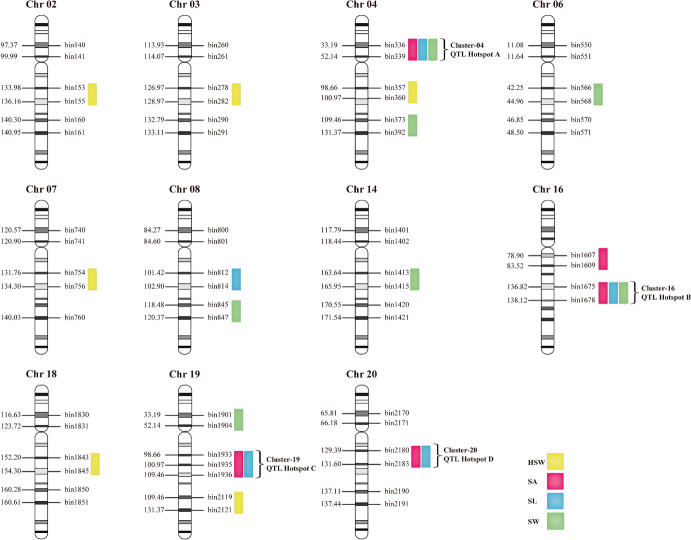
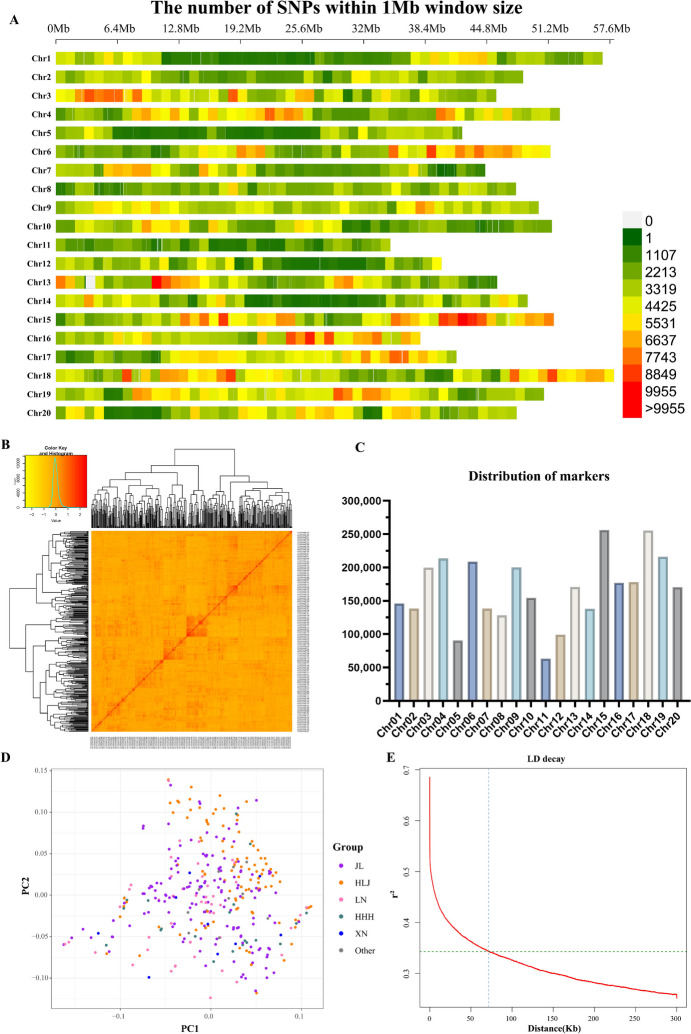
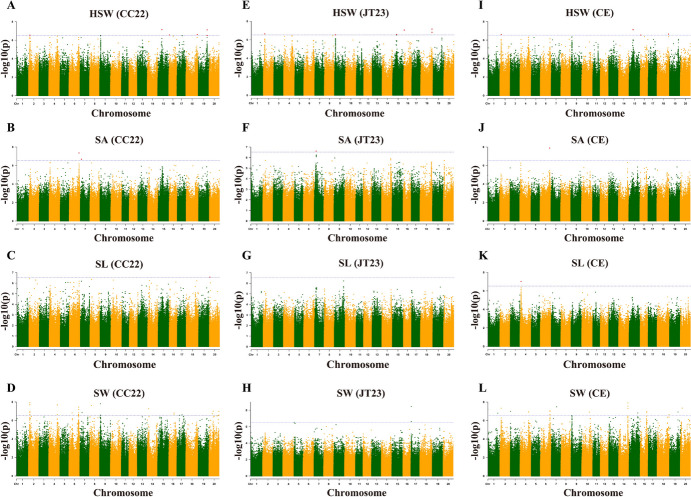
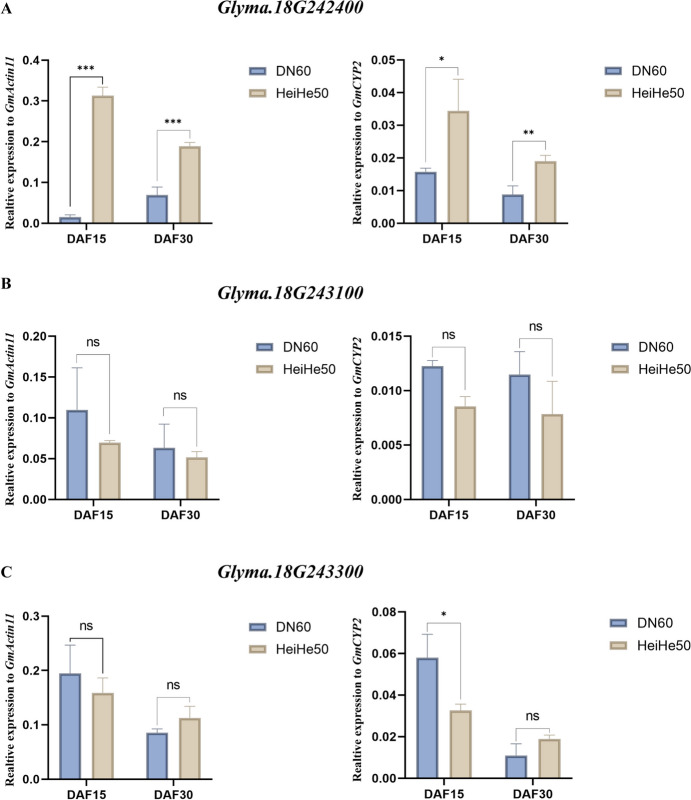
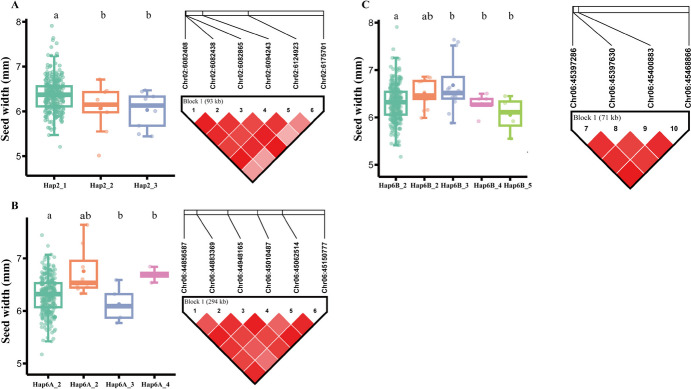
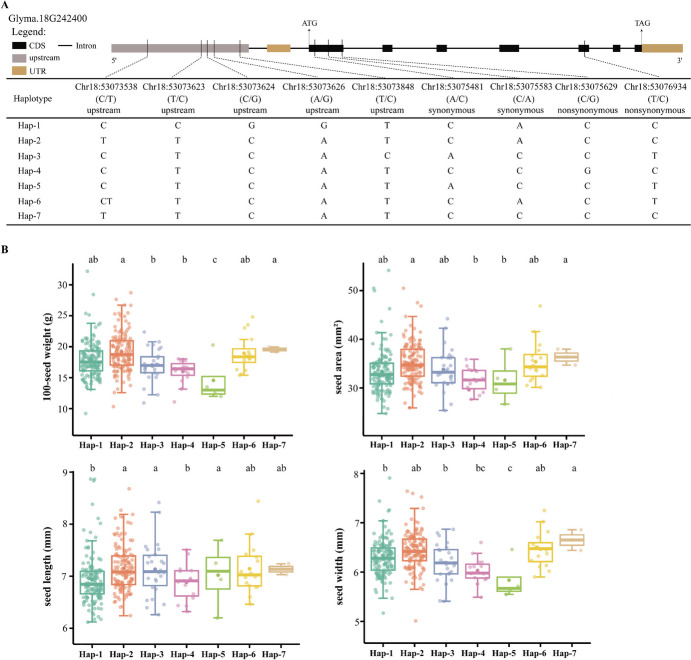
Seed size is an economically important trait that directly determines the seed yield in soybean. In the current investigation, we used an integrated strategy of linkage mapping, association mapping, haplotype analysis and candidate gene analysis to determine the genetic makeup of four seed size-related traits viz., 100-seed weight (HSW), seed area (SA), seed length (SL), and seed width (SW) in soybean. Linkage mapping identified a total of 23 quantitative trait loci (QTL) associated with four seed size-related traits in the F2 population; among them, 17 were detected as novel QTLs, whereas the remaining six viz., qHSW3-1, qHSW4-1, qHSW18-1, qHSW19-1, qSL4-1 and qSW6-1 have been previously identified. Six out of 23 QTLs were major possessing phenotypic variation explained (PVE) ≥ 10%. Besides, the four QTL Clusters/QTL Hotspots harboring multiple QTLs for different seed size-related traits were identified on Chr.04, Chr.16, Chr.19 and Chr.20. Genome-wide association study (GWAS) identified a total of 62 SNPs significantly associated with the four seed size-related traits. Interestingly, the QTL viz., qHSW18-1 was identified by both linkage mapping and GWAS, and was regarded as the most stable loci regulating HSW in soybean. In-silico, sequencing and qRT-PCR analysis identified the Glyma.18G242400 as the most potential candidate gene underlying the qHSW18-1 for regulating HSW. Moreover, three haplotype blocks viz., Hap2, Hap6A and Hap6B were identified for the SW trait, and one haplotype was identified within the Glyma.18G242400 for the HSW. These four haplotypes harbor three to seven haplotype alleles across the association mapping panel of 350 soybean accessions, regulating the seed size from lowest to highest through intermediate phenotypes. Hence, the outcome of the current investigation can be utilized as a potential genetic and genomic resource for breeding the improved seed size in soybean.
Supplementary information: The online version contains supplementary material available at 10.1007/s11032-024-01525-1.
Keywords: Genetic mapping; Haplotype analysis; QTL; Seed size; Soybean.
© The Author(s) 2024.
Conflict of interest statement
Competing interestsThe authors declare no competing interests.
Figures
Similar articles
-
Construction of Genetic Map and QTL Mapping for Seed Size and Quality Traits in Soybean (Glycine max L.).Int J Mol Sci. 2024 Mar 1;25(5):2857. doi: 10.3390/ijms25052857. Int J Mol Sci. 2024. PMID: 38474104 Free PMC article.
-
GWAS analysis revealed genomic loci and candidate genes associated with the 100-seed weight in high-latitude-adapted soybean germplasm.Theor Appl Genet. 2025 Jan 12;138(1):29. doi: 10.1007/s00122-024-04815-6. Theor Appl Genet. 2025. PMID: 39799549
-
Whole-genome mapping identified novel "QTL hotspots regions" for seed storability in soybean (Glycine max L.).BMC Genomics. 2019 Jun 17;20(1):499. doi: 10.1186/s12864-019-5897-5. BMC Genomics. 2019. PMID: 31208334 Free PMC article.
-
Identification of the domestication gene GmCYP82C4 underlying the major quantitative trait locus for the seed weight in soybean.Theor Appl Genet. 2024 Feb 28;137(3):62. doi: 10.1007/s00122-024-04571-7. Theor Appl Genet. 2024. PMID: 38418640
-
Harnessing Artificial Intelligence and Machine Learning for Identifying Quantitative Trait Loci (QTL) Associated with Seed Quality Traits in Crops.Plants (Basel). 2025 Jun 5;14(11):1727. doi: 10.3390/plants14111727. Plants (Basel). 2025. PMID: 40508402 Free PMC article. Review.
Cited by
-
Conditional QTL/QTN mapping for seed width and mining candidate genes based on soybean FW-RIL population.Mol Genet Genomics. 2025 Jun 20;300(1):60. doi: 10.1007/s00438-025-02271-5. Mol Genet Genomics. 2025. PMID: 40540235
References
-
- Abbai R, Singh VK, Nachimuthu VV, Sinha P, Selvaraj R, Vipparla AK, Singh AK, Singh UM, Varshney RK, Kumar A (2019) Haplotype analysis of key genes governing grain yield and quality traits across 3K RG panel reveals scope for the development of tailor-made rice with enhanced genetic gains. Plant Biotechnology J 17:1612–1622 - PMC - PubMed
-
- Barrett JC, Fry B, Maller J, Daly MJ (2005) Haploview: analysis and visualization of LD and haplotype maps. Bioinformatics 21:263–265 - PubMed
-
- Bates D (2014) Fitting linear mixed-effects models using lme4. arXiv preprint arXiv:1406.5823. Accessed 14 Dec 2024
LinkOut - more resources
Full Text Sources
Miscellaneous
