. 2024 Dec 19:18:397-412.
doi: 10.2147/BTT.S485178. eCollection 2024.

ACE Loss Drives Renal Cell Carcinoma Growth and Invasion by Modulating AKT-FOXO1

Affiliations

ACE Loss Drives Renal Cell Carcinoma Growth and Invasion by Modulating AKT-FOXO1

Lei Yin et al. Biologics. .

Abstract

Purpose: Emerging literature links the role of the renin-angiotensin-aldosterone system (RAAS) to the progression of cancers. However, the function of RAAS has not been verified in Clear-cell renal cell carcinoma (ccRCC).

Methods: ACE expression in ccRCC tissues was determined using RT-PCR, Western blot, and immunohistochemistry staining. The clinical significance of ACE was evaluated through Cox regression analysis. To assess the impact of ACE expression on ccRCC cell growth, metastasis, and glucose activity, CCK-8 assays, transwell assays, Seahorse detection, and xenograft models were utilized. The mechanisms of ACE and its upstream and downstream regulatory factors were investigated using RNA-seq, chromatin immunoprecipitation (ChIP), and luciferase reporter assays.

Results: RAAS-related gene Angiotensin-Converting Enzyme (ACE) was significantly under expressed in ccRCC cells and tissues. High ACE expression was positively associated with a favorable prognosis in ccRCC patients. Functional studies showed that ACE overexpression suppressed ccRCC cell line OS-RC-2 and A498 growth, metastasis, and glycolysis activities, while its knockdown had the opposite effect. Mechanistically, ACE inhibited ccRCC progression and epithelial-mesenchymal transition (EMT) by disrupting the AKT-FOXO1 signaling pathway. Furthermore, we provide evidence that ACE could enhance everolimus (approved agent for ccRCC) antitumor effect and ACE expression is transcriptionally regulated by ZBTB26.

Conclusion: Our findings investigated the roles and mechanisms of ACE in ccRCC. ACE inhibits the growth and metastasis of ccRCC cells in vitro and in vivo by promoting FOXO1 expression, which is the downstream target of PI3K-AKT pathway. Thus, this research suggests that ACE may be a promising target for new therapeutic strategy in ccRCC.

Keywords: ACE; AKT; FOXO1; clear-cell renal cell carcinoma; everolimus.


Conflict of interest statement

The authors declare no conflict of interest.

Figures

None
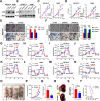
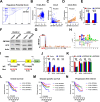
Graphical abstract
Figure 1
Figure 1
Low expression of ACE was associated with poor prognosis in ccRCC patients. (A) The protein expression of RAAS signaling genes in CPTAC-ccRCC dataset. (B-D) ACE protein or mRNA of levels were compared between ccRCC tumors and paired normal tissues from the CPTAC (B), TCGA (C) and GEO (D) database. (E-H) ACE mRNA levels were assessed in patients with ccRCC grades (E), stages (F) and Pathological T stage (G) using TCGA database data. (H) Analysis of ACE expression in metastatic data. (I-K) Kaplan-Meier curve showing Overall survival (I), Disease specific survival (J) and Progression free interval (K) in high- and low-ACE in ccRCC. (L) The mRNA levels of ACE in 25 ccRCC tissues and adjacent normal tissues. (M) ACE protein levels were assessed in 6 ccRCC tumor and para cancerous tissue samples. (N) ACE activity assay was detected in above samples. (O) Representative IHC staining (left) and H-score (right) for ACE in ccRCC tissues and matched para-tumor tissues. (P) IHC score between patients with different T stage. (Q) IHC score between patients with different Fuhrman grade. (R) Kaplan–Meier survival curve analysis the expression level of ACE and the prognosis of ccRCC patients. n.s., not significant; *P < 0.05; **P < 0.01 and ****P < 0.0001.
Figure 2
Figure 2
ACE is a tumor suppressor gene with prognostic value. (A-B) Reintroducing ACE (A) or knockdown of ACE (B) efficiency in ccRCC cells was confirmed via Western immunoblotting. (C) CCK-8 assays were used to assess ccRCC cell growth with or without exogenous ACE. (D) CCK-8 assays were used to assess ccRCC cell growth in the presence or knockdown of ACE. (E) Migration assay detected with or without exogenous ACE. (F) Invasion assay detected with presence or knockdown of ACE. (G-J) The ECAR of indicated cells was measured with the XF24 Seahorse Analyzer. (K-N) The OCR of indicated cells was measured with the XF24 Seahorse Analyzer. (O) Representative images of the subcutaneous tumors in the bilateral flanks of nude mice (left flank, control OS-RC-2 cells; right flank, OS-RC-2 with exogenous ACE). (P-Q) Tumor volumes (p) and tumor weights (q) of the two groups were shown. (R) Representative images of renal orthotopic tumors as indicated groups. (S) Kidney weight/body weight expressed as a percentage rate. (T) Comparisons of the OS curves of mice between indicated groups. *P < 0.05; **P < 0.01 and ***P < 0.001.
Figure 3
Figure 3
Co-expressed genes regulated with ACE and accompanied by EMT. (A) The correlation between ACE and genes differentially expressed in ccRCC was evaluated by a Pearson test. (B-C) Cignal Finder Reporter Array was conducted in A498 cells transfected with ACE (B) or knockdown of ACE (C). (D) GSEA for gene signatures of ccRCC (upper panel) and AKT (down panel) signaling. (E) Western blots were performed to verify the effects of altered ACE expression on the expression of specific proteins related with AKT-FOXO1signaling. (F) Immunofluorescence analysis of FOXO1 level in A498 cells with or without exogenous ACE. (G) Dual Luciferase reporter assays were performed to determine whether ACE could affect the FOXO1 activity. (H) The GSEA plot shows enrichment of EMT-related pathways. (I) Immunofluorescence was used to detect the protein levels of EMT-related factors. (J) Expressions of EMT-related markers and FOXO1 in the indicated ccRCC cells were detected by Western blot assay. *P < 0.05; **P < 0.01 and ****P < 0.0001.
Figure 4
Figure 4
ACE is important for AKT-FOXO1 signaling in ccRCC cells. (A-D) Proliferation in the indicated cell groups was evaluated by CCK-8 assay. (E-H) Migration (E and F) and invasion (G and H) abilities in the indicated cell groups were evaluated by Transwell assay. (I-L) The ECAR of indicated cells was measured with the XF24 Seahorse Analyzer. (M-P) The OCR of indicated cells was measured with the XF24 Seahorse Analyzer. n.s., not significant; *P < 0.05; **P < 0.01 and ***P < 0.001.
Figure 5
Figure 5
ACE enhances the anti-cancer effects of everolimus. (A) Kaplan–Meier survival curve analysis the expression level of ACE and the prognosis in checkmate 025 everolimus treatment group. (B-C) The distribution of ACE expression as IMDC (B) and MSKCC (C) risk score. (D) GSEA for gene signatures of mTOR signaling. (E-F) Proliferation in the indicated cell groups was evaluated by CCK-8 assay. (G-J) Migration (G and H) and invasion (I and J) abilities in the indicated cell groups were evaluated by Transwell assay. (K-L) The ECAR of indicated cells was measured with the XF24 Seahorse Analyzer. (M-N) The OCR of indicated cells was measured with the XF24 Seahorse Analyzer. (O) Representative images of the subcutaneous tumors treated with indicated regimens. (P-Q) Tumor volumes (P) and tumor weights (Q) of the indicated groups were shown. (R) Kidney weight/body weight expressed as a percentage rate. (S) Comparisons of the OS curves of mice between indicated groups. n.s., not significant; *P < 0.05; **P < 0.01; ***P < 0.001 and ****P < 0.0001.
Figure 6
Figure 6
ACE is a direct target of ZBTB26 in ccRCC. (A) Predicted potential transcription factors that could bind promoter of ACE. (B-D) Correlation of ZBTB26 and ACE mRNA in TCGA (B), CCLE (C) and only CCLE-ccRCC (D) data were analyzed. (E) Relative mRNA levels of ACE in control cells and in transfected with ZBTB26 cells. (F) The protein level of ACE was assessed in control cells and in transfected with ZBTB26 cells. (G) ChIP-seq assays showing the ZBTB26 enrichment peak at the ACE promoter region. (H) Multiple sequence alignment of predicted ZBTB26 binding sites. (I) Schematic diagram of wide type and site-directed mutant plasmids. (J-K) ChIP-PCR were performed to detect the enrichment of ZBTB26 on the ACE promoter in indicated HKE293T cells. (L-N) Kaplan–Meier analysis of prognostic value that combining ZBTB26 and ACE levels in TCGA-ccRCC samples. n.s., not significant; *P < 0.05; **P < 0.01; ***P < 0.001 and ****P < 0.0001.

Similar articles

References

    1. Jonasch E, Walker CL, Rathmell WK. Clear cell renal cell carcinoma ontogeny and mechanisms of lethality. Nat Rev Nephrol. 2021;17:245–261. doi:10.1038/s41581-020-00359-2 - DOI - PMC - PubMed
    1. McKay RR, Bosse D, Choueiri TK. Evolving systemic treatment landscape for patients with advanced renal cell carcinoma. J Clin Oncol. 2018;36(36):3615–3623. doi:10.1200/JCO.2018.79.0253 - DOI - PubMed
    1. Longo R, D’Andrea MR, Sarmiento R, Salerno F, Gasparini G. Integrated therapy of kidney cancer. Ann Oncol. 2007;18 Suppl 6:vi141–8. doi:10.1093/annonc/mdm244 - DOI - PubMed
    1. Nasrallah D, Abdelhamid A, Tluli O, Al-Haneedi Y, Dakik H, Eid AH. Angiotensin receptor blocker-neprilysin inhibitor for heart failure with reduced ejection fraction. Pharmacol Res. 2024;204:107210. doi:10.1016/j.phrs.2024.107210 - DOI - PubMed
    1. Ksiazek SH, Hu L, Ando S, et al. Renin-angiotensin-aldosterone system: from history to practice of a secular topic. Int J Mol Sci. 2024;25:4035. doi:10.3390/ijms25074035 - DOI - PMC - PubMed