

Genomic Evidence for the Purging of Deleterious Genetic Variation in the Endangered North Atlantic Right Whale
- PMID: 39717435
- PMCID: PMC11665784
- DOI: 10.1111/eva.70055
Genomic Evidence for the Purging of Deleterious Genetic Variation in the Endangered North Atlantic Right Whale
Abstract
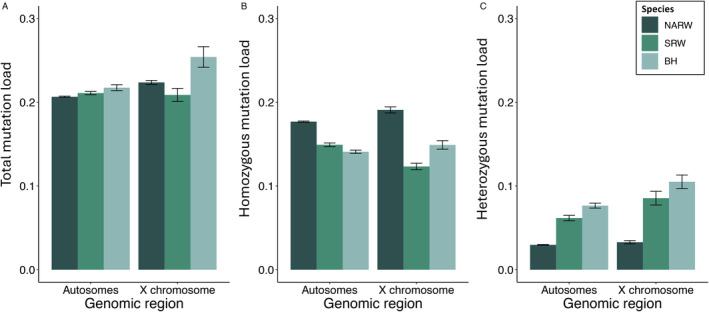
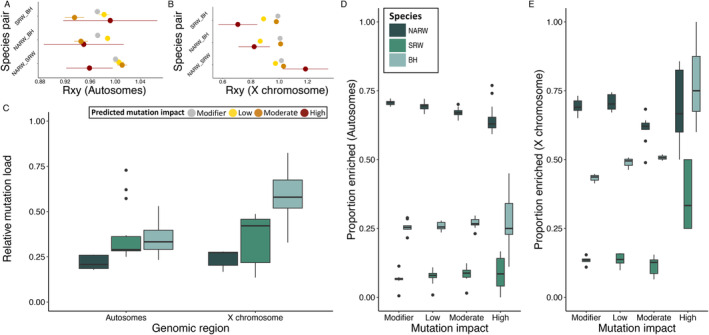
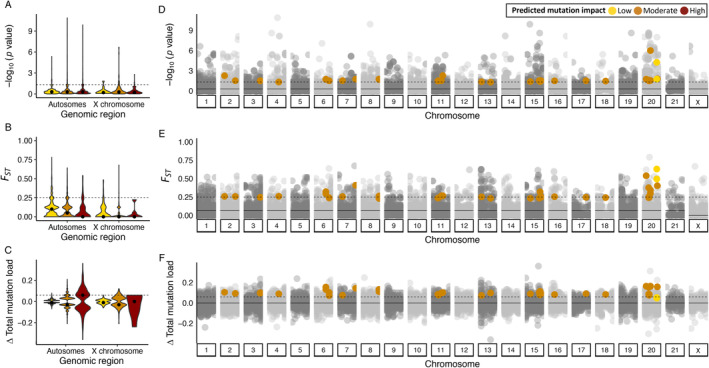
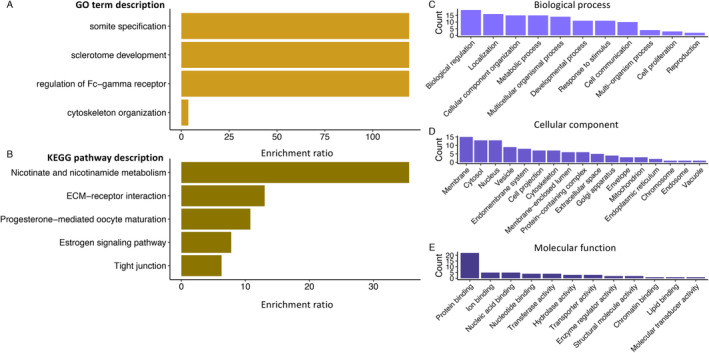
The reduced genetic diversity and frequent inbreeding associated with small population size may underpin the accumulation and expression of deleterious mutations (mutation load) in some declining populations. However, demographic perturbations and inbreeding coupled with purifying selection can also purge declining populations of deleterious mutations, leading to intriguing recoveries. To better understand the links between deleterious genetic variation and population status, we assess patterns of genetic diversity, inbreeding, and mutation load across the genomes of three species of Balaenidae whale with different demographic histories and recoveries following the end of commercial whaling in the 1980s. Unlike bowhead (BH) and Southern right whales (SRW), which show signs of recent recovery, reproductive rates of the endangered North Atlantic right whale (NARW) remain lower than expected. We show that the NARW is currently marked by low genetic diversity, historical inbreeding, and a high mutation load. Still, we reveal evidence that genetic purging has reduced the frequency of highly deleterious alleles in NARW, which could increase chances of future population recovery. We also identify a suite of mutations putatively linked to congenital defects that occur at high frequencies in nulliparous NARW females but are rare in NARW with high reproductive success. These same mutations are nearly absent in BH and SRW in this study, suggesting that the purging of key variants may shape the probability of population recovery. As anthropogenic disturbances continue to reduce the sizes of many populations in nature, resolving the links between population dynamics and mutation load could become increasingly important.
Keywords: North Atlantic right whale; genetic purging; inbreeding; mutation load.
© 2024 The Author(s). Evolutionary Applications published by John Wiley & Sons Ltd.
Conflict of interest statement
The authors declare no conflicts of interest.
Figures

Similar articles
-
A spatially explicit estimate of the prewhaling abundance of the endangered North Atlantic right whale.Conserv Biol. 2016 Aug;30(4):783-91. doi: 10.1111/cobi.12664. Epub 2016 Mar 15. Conserv Biol. 2016. PMID: 26632250
-
Genomic evidence for inbreeding depression and purging of deleterious genetic variation in Indian tigers.Proc Natl Acad Sci U S A. 2021 Dec 7;118(49):e2023018118. doi: 10.1073/pnas.2023018118. Proc Natl Acad Sci U S A. 2021. PMID: 34848534 Free PMC article.
-
The recovery of North Atlantic right whales, Eubalaena glacialis, has been constrained by human-caused mortality.R Soc Open Sci. 2018 Nov 7;5(11):180892. doi: 10.1098/rsos.180892. eCollection 2018 Nov. R Soc Open Sci. 2018. PMID: 30564396 Free PMC article.
-
REVIEW: Assessing North Atlantic right whale health: threats, and development of tools critical for conservation of the species.Dis Aquat Organ. 2021 Feb 25;143:205-226. doi: 10.3354/dao03578. Dis Aquat Organ. 2021. PMID: 33629663 Review.
-
Purging and accumulation of genetic load in conservation.Trends Ecol Evol. 2023 Oct;38(10):961-969. doi: 10.1016/j.tree.2023.05.008. Epub 2023 Jun 19. Trends Ecol Evol. 2023. PMID: 37344276 Review.
Cited by
-
Purging of Highly Deleterious Mutations Through an Extreme Bottleneck.Mol Biol Evol. 2025 Apr 1;42(4):msaf079. doi: 10.1093/molbev/msaf079. Mol Biol Evol. 2025. PMID: 40178369 Free PMC article.
References
-
- Agrawal, A. F. , and Whitlock M. C.. 2012. “Mutation Load: The Fitness of Individuals in Populations Where Deleterious Alleles Are Abundant.” Annual Review of Ecology, Evolution, and Systematics 43: 115–135.
-
- Arbogast, B. S. , Edwards S. V., Wakeley J., Beerli P., and Slowinski J. B.. 2002. “Estimating Divergence Times From Molecular Data on Phylogenetic and Population Genetic Timescales.” Annual Review of Ecology and Systematics 33, no. 1: 707–740.
-
- Barrett, S. C. H. , and Charlesworth D.. 1991. “Effects of a Change in the Level of Inbreeding on the Genetic Load.” Nature 352: 522–524. - PubMed
-
- Bertorelle, G. , Raffini F., Bosse M., et al. 2022. “Genetic Load: Genomic Estimates and Applications in Non‐Model Animals.” Nature Reviews Genetics 23: 492–503. - PubMed
LinkOut - more resources
Full Text Sources
Research Materials
