

Evaluating semantic control with transcranial magnetic stimulation: a systematic review with meta-analysis
- PMID: 39717470
- PMCID: PMC11663645
- DOI: 10.3389/fpsyg.2024.1435338
Evaluating semantic control with transcranial magnetic stimulation: a systematic review with meta-analysis
Abstract
Background: This meta-analysis investigates the role of specific brain regions in semantic control processes using Transcranial Magnetic Stimulation (TMS). According to the Controlled Semantic Cognition framework, control processes help manage the contextually appropriate retrieval of semantic information by activating a distributed neural network, including the inferior frontal gyrus, the posterior middle temporal gyrus, and inferior parietal lobule. Lesions in these areas can lead to difficulties in manipulating weakly activated or competing semantic information. Researchers have used TMS to simulate such deficits in healthy individuals.
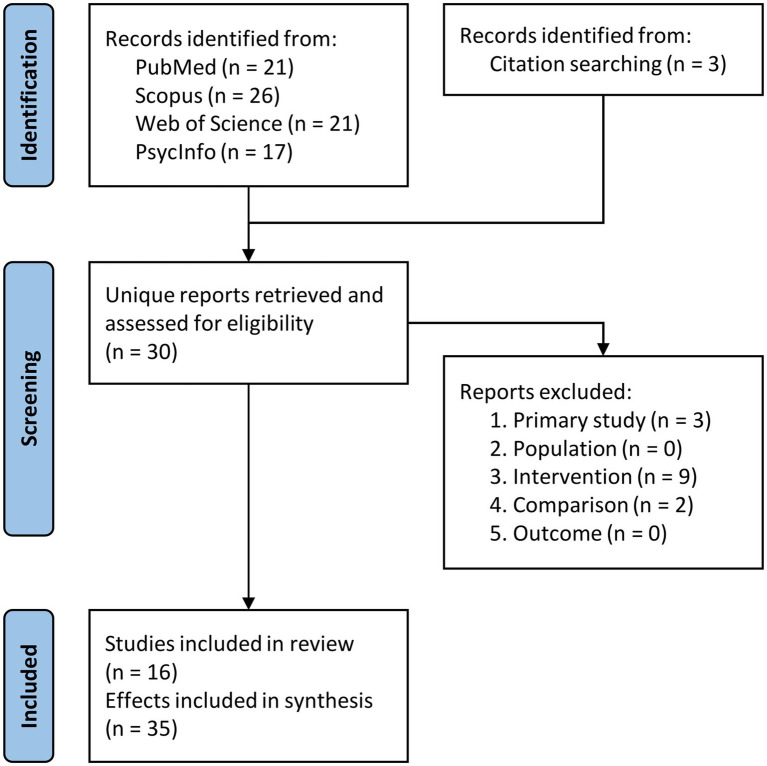
Method: By synthesizing results from TMS studies that targeted these regions, we aimed to evaluate whether neurostimulation over these areas can effectively impair participants' performance under high semantic control demands.
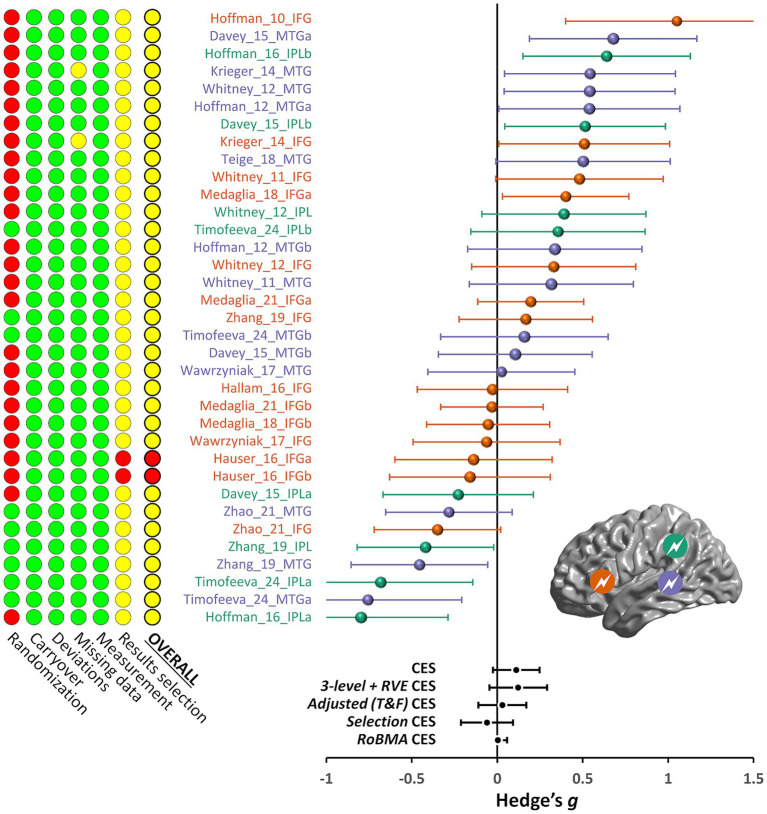
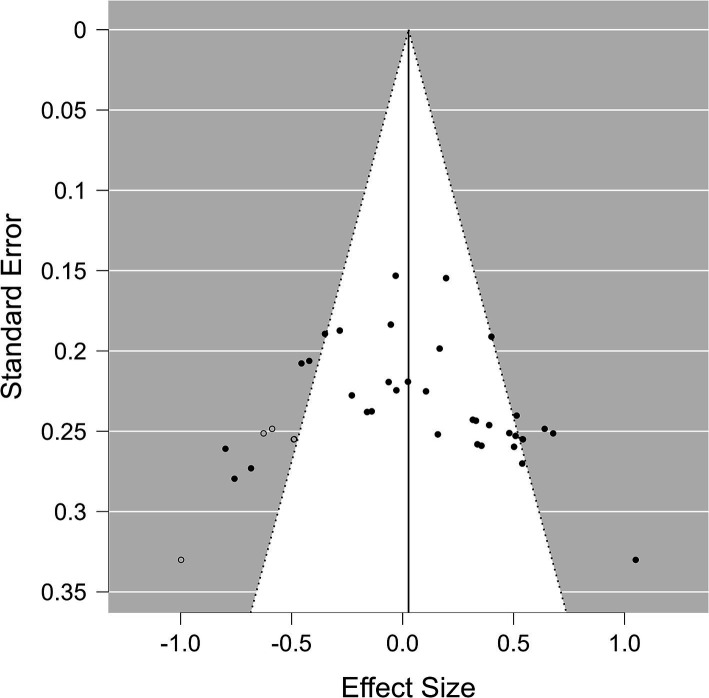
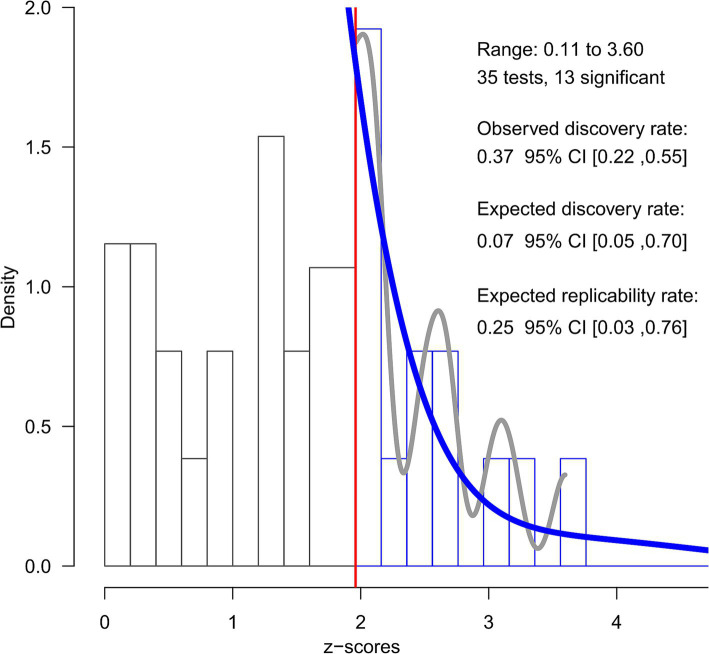
Results: Results from different meta-analytical approaches consistently showed no significant effects of TMS, especially after correcting for publication bias. Nevertheless, variability in experimental methodologies was evident.
Conclusion: These findings raise questions about the effectiveness of TMS in simulating deficits in semantic control and highlight the need for methodological improvements in future studies to enhance reliability and interpretability.
Keywords: controlled semantic cognition; semantic aphasia; semantic control; semantic representation; transcranial magnetic stimulation.
Copyright © 2024 Ambrosini, Benavides-Varela, Visalli, Viviani and Montefinese.
Conflict of interest statement
The authors declare that the research was conducted in the absence of any commercial or financial relationships that could be construed as a potential conflict of interest.
Figures
Similar articles
-
The neural basis of semantic cognition: converging evidence from neuropsychology, neuroimaging and TMS.Cortex. 2013 Mar;49(3):611-25. doi: 10.1016/j.cortex.2012.10.008. Epub 2012 Nov 13. Cortex. 2013. PMID: 23260615 Review.
-
TMS Reveals Dynamic Interaction between Inferior Frontal Gyrus and Posterior Middle Temporal Gyrus in Gesture-Speech Semantic Integration.J Neurosci. 2021 Dec 15;41(50):10356-10364. doi: 10.1523/JNEUROSCI.1355-21.2021. Epub 2021 Nov 16. J Neurosci. 2021. PMID: 34785579 Free PMC article.
-
Neuromodulatory effects of transcranial magnetic stimulation on language performance in healthy participants: Systematic review and meta-analysis.Front Hum Neurosci. 2022 Dec 5;16:1027446. doi: 10.3389/fnhum.2022.1027446. eCollection 2022. Front Hum Neurosci. 2022. PMID: 36545349 Free PMC article.
-
TMS interferes with lexical-semantic retrieval in left inferior frontal gyrus and posterior middle temporal gyrus: Evidence from cyclical picture naming.Neuropsychologia. 2014 Nov;64:24-32. doi: 10.1016/j.neuropsychologia.2014.09.014. Epub 2014 Sep 16. Neuropsychologia. 2014. PMID: 25229872
-
Transcranial Direct Current Stimulation Effects on Semantic Processing in Healthy Individuals.Brain Stimul. 2016 Sep-Oct;9(5):682-691. doi: 10.1016/j.brs.2016.05.003. Epub 2016 May 12. Brain Stimul. 2016. PMID: 27288226 Review.
References
-
- Almaghyuli A., Thompson H., Lambon Ralph M. A., Jefferies E. (2012). Deficits of semantic control produce absent or reverse frequency effects in comprehension: evidence from neuropsychology and dual task methodology. Neuropsychologia 50, 1968–1979. doi: 10.1016/j.neuropsychologia.2012.04.022, PMID: - DOI - PubMed
-
- Assink M., Wibbelink C. J. M. (2016). Fitting three-level metaanalytic models in R: a step-by-step tutorial. Quantitat. Methods Psychol. 12, 154–174. doi: 10.20982/tqmp.12.3.p154 - DOI
-
- Assink M., Wibbelink C. J. (2023). Addressing dependency in meta-analysis: a companion to Assink and Wibbelink (2016).
-
- Assink M., and Wibbelink C. J. M. (2024). Addressing dependency in meta-analysis: A companion to Assink and Wibbelink (2016). Quant. Meth. Psych. 20, 1– 16. doi: 10.20982/tqmp.20.1.p001 - DOI
Publication types
LinkOut - more resources
Full Text Sources