

Direct Additive Detection in Polymer Films via Platinum-Assisted SALDI Mass Spectrometry Imaging
- PMID: 39717495
- PMCID: PMC11664312
- DOI: 10.5702/massspectrometry.A0162
Direct Additive Detection in Polymer Films via Platinum-Assisted SALDI Mass Spectrometry Imaging
Abstract
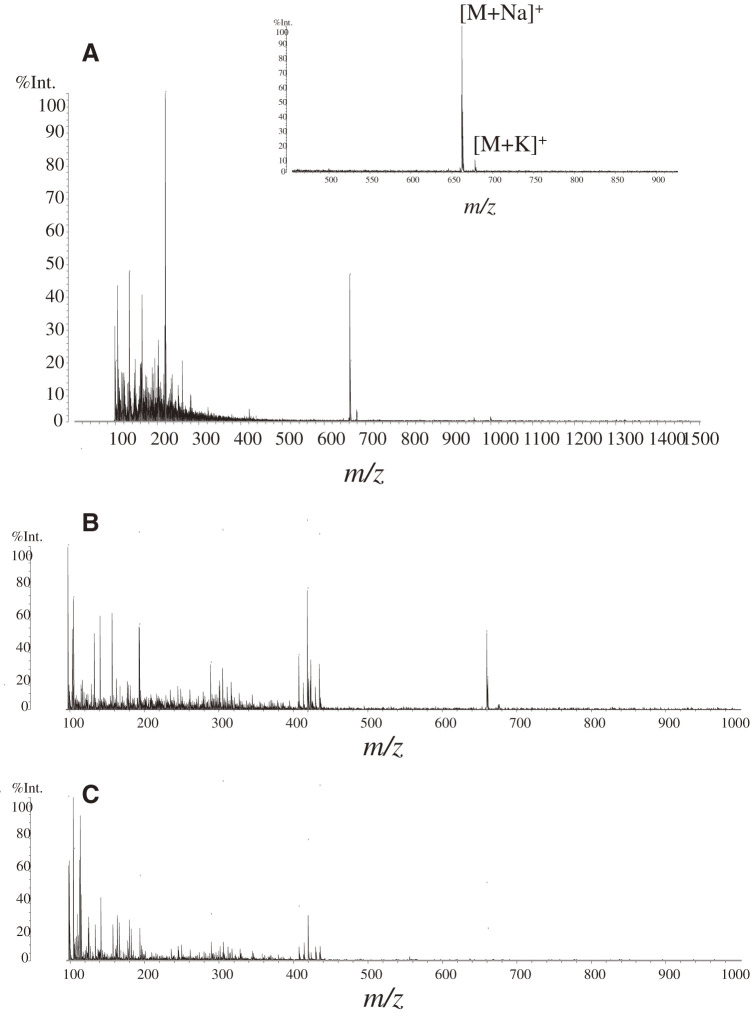
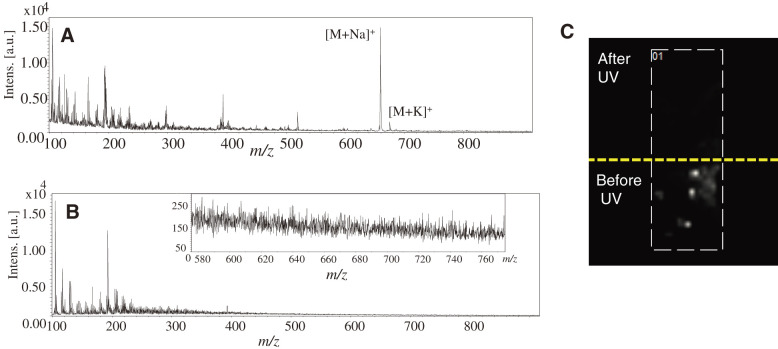
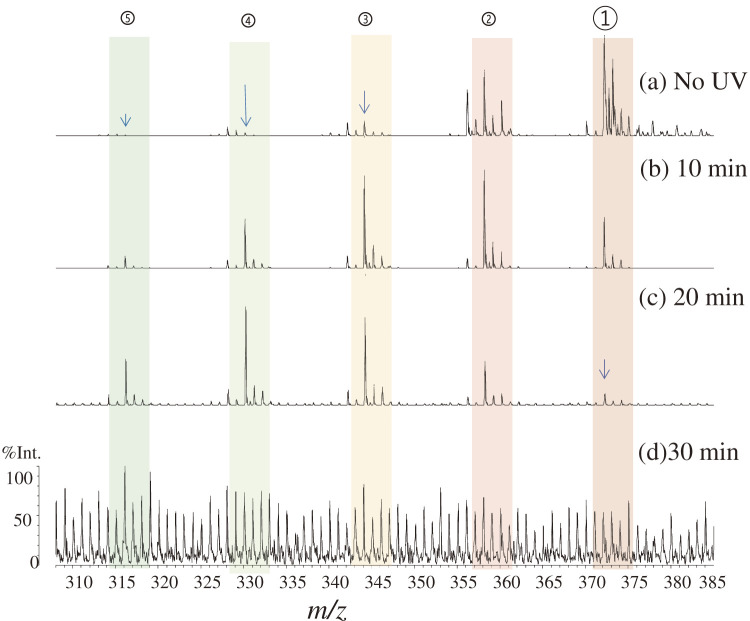
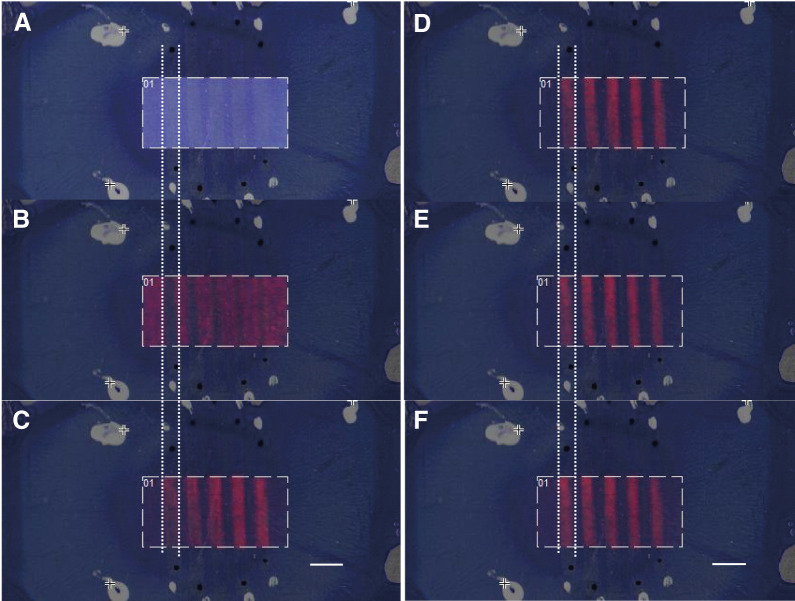
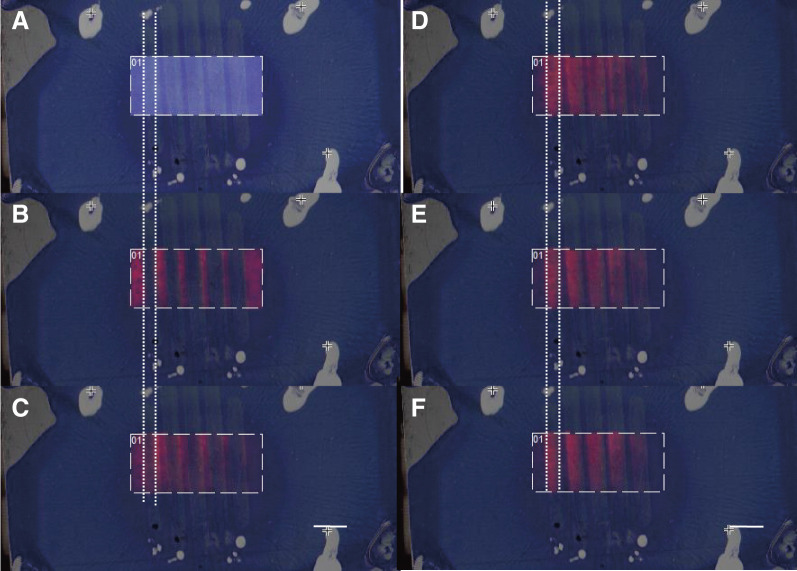
In this study, we employed platinum-assisted surface-assisted laser desorption/ionization mass spectrometry imaging (MSI) (Pt-SALDI-MSI) to detect and visualize the spatial distribution of antioxidant additives and organic dyes in polystyrene films undergoing photodegradation. In traditional matrix-assisted laser desorption/ionization mass spectrometry (MALDI-MS), matrix-derived ion peaks often obscure signals from low-molecular-weight analytes. Pt-SALDI-MSI, which utilizes inorganic nanoparticles instead of an organic matrix, enables the interference-free analysis of low-molecular-weight compounds, thereby addressing the limitation of traditional MALDI-MS. Using Pt-SALDI-MSI, we observed the degradation and distribution of Irganox 1098 (an antioxidant) and crystal violet (an organic dye) following ultraviolet irradiation. This method effectively captures the photodegradation process, providing valuable insights into the environmental breakdown of plastics and the formation of microplastics.
Keywords: SALDI-MS; additives; mass spectrometry imaging; platinum vapor deposition; polymer.
Copyright ©2024 Hideya Kawasaki, Issey Osaka, and Ryuichi Arakawa.
Figures
Similar articles
-
Simultaneous detection of phosphatidylcholines and glycerolipids using matrix-enhanced surface-assisted laser desorption/ionization-mass spectrometry with sputter-deposited platinum film.J Mass Spectrom. 2015 Nov;50(11):1264-9. doi: 10.1002/jms.3700. J Mass Spectrom. 2015. PMID: 26505771
-
Nitrogen and Sulfur Co-doped Carbon-Dot-Assisted Laser Desorption/Ionization Time-of-Flight Mass Spectrometry Imaging for Profiling Bisphenol S Distribution in Mouse Tissues.Anal Chem. 2018 Sep 18;90(18):10872-10880. doi: 10.1021/acs.analchem.8b02362. Epub 2018 Sep 5. Anal Chem. 2018. PMID: 30139256
-
Matrix-enhanced surface-assisted laser desorption/ionization mass spectrometry (ME-SALDI-MS) for mass spectrometry imaging of small molecules.Methods Mol Biol. 2015;1203:175-84. doi: 10.1007/978-1-4939-1357-2_17. Methods Mol Biol. 2015. PMID: 25361677
-
Surface-assisted laser desorption ionization mass spectrometry techniques for application in forensics.Mass Spectrom Rev. 2015 Nov-Dec;34(6):627-40. doi: 10.1002/mas.21431. Epub 2014 Jun 11. Mass Spectrom Rev. 2015. PMID: 24916100 Review.
-
Imaging lipids in biological samples with surface-assisted laser desorption/ionization mass spectrometry: A concise review of the last decade.Prog Lipid Res. 2021 Jul;83:101114. doi: 10.1016/j.plipres.2021.101114. Epub 2021 Jul 2. Prog Lipid Res. 2021. PMID: 34217733 Review.
References
-
- K. Dreisewerd. The desorption process in MALDI. Chem. Rev. 103: 395–426, 2003. - PubMed
-
- Z. Sun, F. Wang, Y. Liu, B. Deng, R. Ren, Y. Wang, D. Chen, L. Zuo. Recent strategies for improving MALDI mass spectrometry imaging performance towards low molecular weight compounds. Trends Analyt. Chem. 175: 117727, 2024.
-
- H. Sato, S. Nakamura, T. N. J. Fouquet, T. Ohmura, M. Kotani, Y. Naito. Simple pretreatment for the analysis of additives and polymers by surface-assisted laser desorption/ionization mass spectrometry using a through-hole alumina membrane as a functional substrate. J. Am. Soc. Mass Spectrom. 31: 298–307, 2020. - PubMed
-
- W. Ma, J. Li, X. Li, Y. Bai, H. Liu. Nanostructured substrates as matrices for surface assisted laser desorption/ionization mass spectrometry: A progress report from material research to biomedical applications. Small Methods 5: 2100762, 2021. - PubMed