. 2024 Nov 12;7(1):101245.
doi: 10.1016/j.jhepr.2024.101245. eCollection 2025 Jan.

Hepatocellular carcinoma hosts cholinergic neural cells and tumoral hepatocytes harboring targetable muscarinic receptors

Affiliations

Hepatocellular carcinoma hosts cholinergic neural cells and tumoral hepatocytes harboring targetable muscarinic receptors

Charlotte A Hernandez et al. JHEP Rep. .

Abstract

Background & aims: Owing to unexplained interpatient variation and treatment failure in hepatocellular carcinoma (HCC), novel therapeutic approaches remain an urgent clinical need. Hepatic neurons, belonging to the autonomic nervous system (ANS), mediate liver/whole body crosstalk. Pathological innervation of the ANS has been identified in cancer, nurturing tumor stroma and conferring stronger carcinogenic properties.

Methods: We characterized the innervation of liver tumors from the French Liver Biobank, then applied bioinformatics to TCGA (The Cancer Genome Atlas), several other datasets and a European validation cohort, to re-evaluate patient stratification. Cell biology and pharmacology studies were also performed.

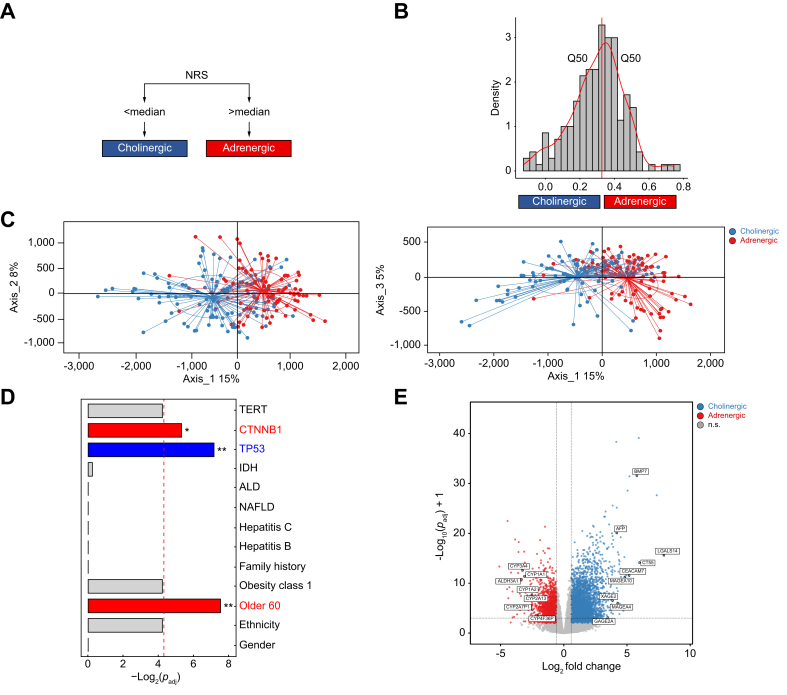
Results: Densely packed nucleated DCX+, synaptophysin+, NeuN+, VAChT+, TH-, CD31-, CD45- clusters, to date undetected, were identified in human HCCs, and independently confirmed by single-cell RNA sequencing data. Using the new concept of a neuronal score, human and rat HCCs displayed tightly netrin-1-associated neural reconfiguration towards cholinergic polarity, which was associated with chronic liver disease progression, cancer onset and many features of aggressive (proliferative class) HCC, including shortened survival. This score was conditioned by tumoral hepatocytes, and predicted sorafenib efficacy in the STORM HCC phase III trial. Conversely, intratumoral adrenergic lymphocytes were enriched in TEMRA and cytotoxic phenotypes. Amongst all cholinergic transcripts, the medically targeted CHRM3 receptor was enriched and associated with pathogenic traits in HCC, as well as poor prognosis in HCC stages 1-2, while its level dropped upon experimental re-differentiation. Its pharmacological inhibition with low concentrations of anticholinergic drugs, but not cholinomimetics, decreased anchorage-independent growth and anoikis, synergized with sorafenib and lenvatinib in HCC class 1 to 3 lines, yet not in primary human hepatocytes, and preserved mature hepatocyte functions.

Conclusion: These data identify cholinergic processes as instrumental in liver carcinogenesis and support the use of EMA/FDA-approved cholinergic drugs in HCC research.

Impact and implications: Hepatocellular carcinoma (HCC) care has long been hampered by the enigmatic nature of disease evolution, as well as of response or resistance to treatment. Hepatic neurons are likely the least studied liver cell type and mediate patients singularities from the ANS to the organ in real-time. Cholinergic inputs identified in this study as pathogenic may be targeted with the well charted pharmacopoeia of neurotropic drugs already available, for basic or clinical research purposes, with an expected high level of safety.

Keywords: HCC; M3 muscarinic receptor; TKI resistance; autonomic nervous system; cholinergic; neuronal score; scRNA-seq; spheroids; synergy; transcriptomics.


Conflict of interest statement

Research Support to JML: Bayer Pharmaceuticals, Eisai Inc, Bristol-Myers Squibb and Ipsen. Consultancy (JML): Bayer HealthCare Pharmaceuticals, Eisai Inc, Merck, Bristol-Myers Squibb, Eli Lilly, Roche, Genentech, Ipsen, Glycotest, AstraZeneca, Omega Therapeutics, Mina Alpha, Boston Scientific, Exelixis, Bluejay, Captor Therapeutics. Please refer to the accompanying ICMJE disclosure forms for further details.

Figures

Image 1
Graphical abstract
Fig. 1
Fig. 1
Expression of mature and progenitor neural markers in human HCC. (A) Immunoblotting of netrin-1, NeuN, DCX and INA, TH and VAChT markers on 10 normal liver, 10 cirrhotic (F4) and 10 HCC samples. (B) DCX induction is correlated with parenchymal remodeling. DCX levels were plotted against ratios of full-length vs. degraded tubulin signals. Spearman test (∗∗∗p <0.001). (C–H) Signal quantification was done using total protein normalization. Mann-Whitney or t test (after normality test, ∗p <0.05, ∗∗p <0.01, ∗∗∗p <0.001). n = 30 patients, from the four main HCC etiologies.
Fig. 2
Fig. 2
The NRS selectively decreases in HCC vs. all other histological states of chronic liver disease. (A) NRS in cirrhosis vs. tumors. Wilcoxon matched-pairs signed rank test (∗∗∗p <0.001), n = 70 (GSE144269). (B) NRS in adjacent vs. tumors. Same test (∗∗∗p <0.001), n = 35 (GSE124535). (C) Comparison of NRS between stages (GSE89377). Kruskal-Wallis test corrected with a Dunn’s test (∗p <0.05, ∗∗p <0.01, ∗∗∗p <0.001). Bars represent mean ± SD. NL, normal liver; LC, liver cirrhosis; HCC G1-3, Edmonson grades 1-3 (n = 107 patients total). NRS, neuronal receptor score; HCC, hepatocellular carcinoma.
Fig. 3
Fig. 3
Neural classification based on adrenergic and cholinergic receptors in HCC. (A) NRS calculation: adrenergic and cholinergic enrichment scores were calculated, then cholinergic scores were subtracted from adrenergic scores. (B) Samples were grouped into cholinergic and adrenergic classes by comparison with NRS median. (C) Sample distribution after dimensional reduction (PCA) based on the 10% most variable genes. (D) Associations between classes and main HCC clinico-biological features. Fisher test’s adjusted p values per variable (∗padj <0.05, ∗∗padj <0.01). (E) Volcano plot showing significantly differentially expressed genes. Horizontal red bar: adjusted p value threshold at 0.001. Genes with lowest adjusted p value are indicated. n = 196 patients (TCGA cohort). Modulated genes were considered if absolute Log2 fold-change value was higher than 0.58 and padj <0.001. ALD, alcoholic liver disease; NAFLD, non-alcoholic fatty liver disease.
Fig. 4
Fig. 4
Pathway enrichment and outcome analyses. (A) Heatmap of the normalized levels of DEGs (TCGA cohort) between both neuronal classes, showing 3,264 genes over-expressed in the cholinergic class and 1,288 in the adrenergic one. (B–C) Top 10 over-represented hallmark pathways from the over-expressed genes in the adrenergic (B) and the cholinergic (C) classes, listed in Tables S9 and S10, respectively. Pathways are ordered by adjusted p value. (D) Kaplan-Meier representation of the predictive value with respect to the overall survival in TCGA samples. p value of the log-rank test is indicated. ALD, alcoholic liver disease; HBV, hepatitis B virus; HCV, hepatitis C virus; NAFLD, non-alcoholic fatty liver disease.
Fig. 5
Fig. 5
Association between adrenergic or cholinergic orientations and HCC pathological criteria. (A) Enrichment in good or worse prognosis-associated pathways for the adrenergic and cholinergic classes, respectively. Pathway accession numbers (listed in Table S11) are shown to the left. Wilcoxon test was performed for each sample between the two neuronal classes (∗∗padj <0.01, ∗∗∗padj <0.001, n = 293 patients). (B) Canonical HCC pathways in accordance or discordance with adrenergic or cholinergic functional transcriptomics. Pathways associated are depicted in Table S11. (C) Verification of TCGA findings on the ‘validation cohort’ (n = 171 patients). (D-F) Cholinergic HCC orientation is correlated with hypoxia parameters of reference. Pearson’s correlation ∗∗∗p <0.001, n = 366 patients, TCGA cohort). ALD, alcoholic liver disease; HBV, hepatitis B virus; HCV, hepatitis C virus; NAFLD, non-alcoholic fatty liver disease.
Fig. 6
Fig. 6
Cholinergic HCC orientation (low NRS) is conditioned by dedifferentiated hepatocytes. (A) GSVA scores for the cancer stemness signature in each cell type, represented as UMAP (top) and violin plot (bottom). Two-tailed t test (∗∗∗p <0.001, GSE149614, n = 10 patients). Violin plots depict the mean of each population. (B) GSVA scores for the NRS in each cell type, represented as UMAP (top) and violin plot (bottom). Two-tailed t test (∗∗∗p <0.001, GSE149614, n = 10 patients). (C-D) Correlation between NRS and malignancy (cancer stemness signature) in non-malignant (C) and malignant (D) hepatocytes. Percentages denote hepatocytes above (adrenergic) or below (cholinergic) the median NRS (GSE149614). (E) Workflow. Created with BioRender. (F–I) The NRS becomes more adrenergic (i.e., increases) upon experimental hepatocytic re-differentiation (PLC, SNU878, and JHH4 spheroids; n = 5-10 independent experiments) or upon HepaRG 2D differentiation; n = 3-6 independent experiments). Mann-Whitney test or t test (depending on normality, ∗p <0.05, ∗∗p <0.01). NRS, neuronal receptor score.
Fig. 7
Fig. 7
Muscarinic receptors are druggable target candidates in HCC. (A) CHRM3 expression (French national liver biobank, all four main etiologies 24-26% of total, paired tissues, n = 168 cases). (B) CHRM3 expression is upregulated in HCC lesions mainly associated with alcohol abuse. ALD etiology corresponds to 72% of the cohort (paired tissues, GSE64041, n = 60 patients, Y-axis units: Log2 RMA). (C-D) CHRM3 expression is upregulated in HCC lesions (paired tissues, GSE124535, n = 35 patients, Y-axis units: FPKM). (B–C) All adjacent tissues; (D) cirrhotic adjacent tissues only. (A-D) Wilcoxon matched-pairs signed rank test, ∗∗∗p <0.001. (E-F) CHRM3high tumors are correlated with aggressive HCC. Patients were classified into the highest 25 percentile (CHRM3high) and lowest 25 percentile (CHRM3lo). GSEA was performed using the MSigDB gene sets H, C2 and C5. Figures show normalized enrichment scores from differentially modulated hallmark gene sets in CHRM3high tumor samples (FDR <0.05). (G) Dendrogram describing muscarinic drugs. (H–I) Soft agar (n = 4 or 5) and anoikis (n = 4) assays were conducted on PLC, SNU878, HepaRG and JHH4 (JHH4 unsuitable for soft-agar assay). Student’s t test after normality test, ∗p <0.05, ∗∗p <0.01, ∗∗∗p <0.001. HCC, hepatocellular carcinoma.
Fig. 8
Fig. 8
Muscarinic blockade synergizes with the first-line TKI sorafenib. (A-F) Activity curves and 2D matrices on scopolamine (A-C) and darifenacin (D-F), respectively on PLC (class 1), SNU878 (class 2) and JHH1 (class 3) HCC lines. Chou-Talalay ZIP scores >10 indicate synergy. (G) Plate-wide average ZIP synergy score values calculated from 96-well matrices for each experiment (n = 4-6). Dar, darifenacin; Sco, scopolamine.

References

    1. Llovet J.M., Kelley R.K., Villanueva A., et al. Hepatocellular carcinoma. Nat Rev Dis Primers. 2021;7:6. - PubMed
    1. Llovet J.M., Montal R., Sia D., et al. Molecular therapies and precision medicine for hepatocellular carcinoma. Nat Rev Clin Oncol. 2018;15:599–616. - PubMed
    1. Monje M., Borniger J.C., D'Silva N.J., et al. Roadmap for the emerging field of cancer neuroscience. Cell. 2020;181:219–222. - PMC - PubMed
    1. Zeldovich L., Manish V. Cold Spring Harbor Stories and Media; 2022 Aug 22. Cancer has a lot of nerve.
    1. Jensen K.J., Alpini G., Glaser S. Hepatic nervous system and neurobiology of the liver. Compr Physiol. 2013;3:655–665. - PMC - PubMed

LinkOut - more resources