. 2024 Dec 9:15:1468323.
doi: 10.3389/fphar.2024.1468323. eCollection 2024.

Comprehensive analysis of IRF8-related genes and immune characteristics in lupus nephritis

Affiliations

Comprehensive analysis of IRF8-related genes and immune characteristics in lupus nephritis

Zhibin Yu et al. Front Pharmacol. .

Abstract

Background: There are currently no reliable diagnostic biomarkers or treatments for lupus nephritis (LN), a complication of systemic lupus erythematosus. Objective: We aimed to explore gene networks and potential biomarkers for LN by analyzing the GSE32591 and GSE113342 datasets from the Gene Expression Omnibus database, focusing on IRF8 and IRF8-related genes.

Methods: We used differential expression analysis, functional enrichment, protein-protein interaction (PPI) network construction, and the CIBERSORT algorithm for immune infiltration assessment. To validate the expression levels of the IRF8 gene in the kidneys of lupus mice models, we used quantitative real-time PCR (qRT-PCR) and Western blotting (WB). A diagnostic classifier was built using the RandomForest method to evaluate the diagnostic potential of selected key genes. To bridge our findings with potential therapeutic implications, we used the drug-gene interaction database to predict drugs targeting the identified genes.

Results: Twenty co-differentially expressed genes (DEGs) were identified, with IRF8 exhibiting significant expression differences and potential as a biomarker. Functional enrichment analysis revealed pathways associated with immune response. Validation through qRT-PCR and WB confirmed that the IRF8 gene and its protein exhibited elevated expression levels in the kidneys of lupus mice compared to control groups. The diagnostic classifier revealed impressive accuracy in differentiating LN from control samples, achieving a notable area under the curve values across various datasets. Additionally, immune infiltration analysis indicated significant differences in the immune cell profiles between the LN and control groups.

Conclusion: IRF8 and its related genes show promise as biomarkers and therapeutic targets for LN. These findings contribute to a deeper understanding of the molecular mechanisms involved in LN and may support the development of precision medicine strategies for improved patient outcomes.

Keywords: IRF8; biomarkers; drug-gene interaction; immune infiltration; lupus nephritis.


Conflict of interest statement

The authors declare that the research was conducted in the absence of any commercial or financial relationships that could be construed as a potential conflict of interest.

Figures
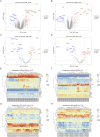
FIGURE 1
FIGURE 1
Differentially Expressed Genes in GSE32591 and GSE113342. (A–D) Volcano plots showing differentially expressed genes with log2(Fold Change) on the x-axis and -log10(p.adjust) on the y-axis. (E–H) Heatmaps showing expression levels of differentially expressed genes across patient samples.
FIGURE 2
FIGURE 2
Expression levels of IRF8 across datasets.
FIGURE 3
FIGURE 3
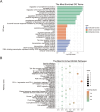
GO functional enrichment analysis and KEGG pathway enrichment analysis. (A) GO functional enrichment analysis. The x-axis represents -log(p.adjust), and the y-axis represents GO terms. (B) KEGG pathway enrichment analysis. The x-axis represents generation, and the y-axis represents pathway names. The size of the nodes indicates the number of genes enriched in the pathway, while the node color represents -log10(p-value).
FIGURE 4
FIGURE 4
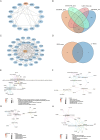
PPI and Functional Analysis. (A) PPI network of co-DEGs. (B) IRF8-related genes obtained from four datasets. (C) PPI network of IRF8-related genes. (D) Intersection of IRF8-related genes and co-DEGs. (E–H) Functional annotation and pathway enrichment analysis of genes in functional modules using DAVID, with node color representing the degree of IRF8-related gene nodes.
FIGURE 5
FIGURE 5
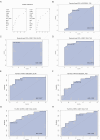
Construction and Validation of the Diagnostic Classifier. (A) Feature selection and diagnostic classifier model construction using the random forest algorithm on the GSE32591-GLOM dataset, ranking the importance scores of 11 key feature genes. (B–D) Testing the diagnostic classifier model on three additional datasets: GSE32591_TUB, GSE113342_GLOM, and GSE113342_TUB, with ROC curves plotted. (E–H) ROC curves of the IRF8 gene in GSE32591_GLOM, GSE32591_TUB, GSE113342_GLOM, and GSE113342_TUB datasets.
FIGURE 6
FIGURE 6
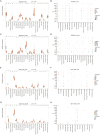
Immune Infiltration Analysis and Correlation between Key Genes and Immune Cells. (A) Immune infiltration in the GSE32591_TUB group, with the x-axis representing immune cells and the y-axis representing immune cell abundance. Asterisks indicate significance levels: *p < 0.05, **p < 0.01, ***p < 0.001. Similar plots are shown for GSE32591_GLOM (C), GSE113342_TUB (E), and GSE113342_GLOM (G). (B) Correlation between 11 key feature genes and immune cells in the GSE32591_TUB group. The x-axis represents immune cells, and the y-axis represents feature genes, with orange indicating positive correlation and green indicating negative correlation. Node size represents the level of significance. Similar plots are shown for GSE32591_GLOM (D), GSE113342_TUB (F), and GSE113342_GLOM (H).
FIGURE 7
FIGURE 7
Validation of IRF8 Expression and Its Related Genes. (A) qRT-PCR validation for Irf8 (n = 5). (B) Western blot validation for IRF8 expression (n = 4). (C) The quantification of the Western blot bands of IRF8. (D) qRT-PCR validation for C1qa (n = 5). (E) qRT-PCR validation for Tollip (n = 5). (F) qRT-PCR validation for Itgb2 (n = 5). Significance levels are denoted as follows: *p < 0.05, **p < 0.01, ****p < 0.0001, with ‘ns’ indicating no significant difference.
FIGURE 8
FIGURE 8
Drugs influencing hub gene expression or function.

Similar articles

References

    1. Alduraibi F. K., Tsokos G. C. (2024). Lupus nephritis biomarkers: a critical review. IJMS 25, 805. 10.3390/ijms25020805 - DOI - PMC - PubMed
    1. Almaani S., Meara A., Rovin B. H. (2017). Update on lupus nephritis. Clin. J. Am. Soc. Nephrol. 12, 825–835. 10.2215/CJN.05780616 - DOI - PMC - PubMed
    1. Bao L., Haas M., Quigg R. J. (2011). Complement factor H deficiency accelerates development of lupus nephritis. J. Am. Soc. Nephrol. 22, 285–295. 10.1681/ASN.2010060647 - DOI - PMC - PubMed
    1. Barrett T., Troup D. B., Wilhite S. E., Ledoux P., Rudnev D., Evangelista C., et al. (2007). NCBI GEO: mining tens of millions of expression profiles--database and tools update. Nucleic Acids Res. 35, D760–D765. 10.1093/nar/gkl887 - DOI - PMC - PubMed
    1. Bethunaickan R., Berthier C. C., Ramanujam M., Sahu R., Zhang W., Sun Y., et al. (2011). A unique hybrid renal mononuclear phagocyte activation phenotype in murine systemic lupus erythematosus nephritis. J. Immunol. 186, 4994–5003. 10.4049/jimmunol.1003010 - DOI - PMC - PubMed

LinkOut - more resources