. 2024 Dec 23;14(12):e70680.
doi: 10.1002/ece3.70680. eCollection 2024 Dec.

Latitudinal Clines in an Ectothermic Vertebrate: Patterns in Body Size, Growth Rate, and Reproductive Effort Suggest Countergradient Responses in the Prairie Lizard

Affiliations

Latitudinal Clines in an Ectothermic Vertebrate: Patterns in Body Size, Growth Rate, and Reproductive Effort Suggest Countergradient Responses in the Prairie Lizard

Travis R Robbins et al. Ecol Evol. .

Abstract

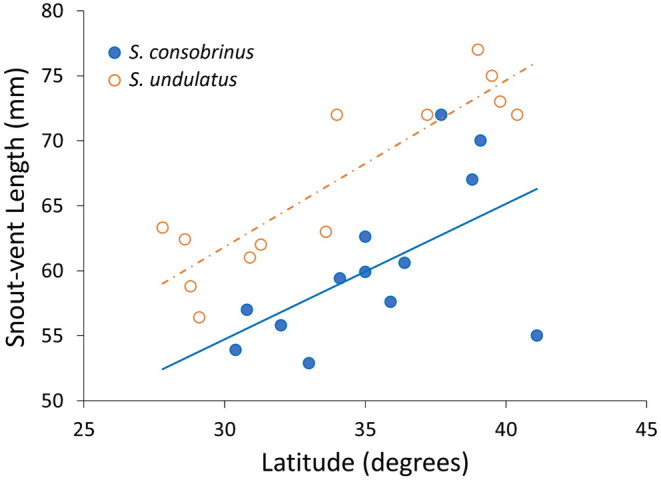
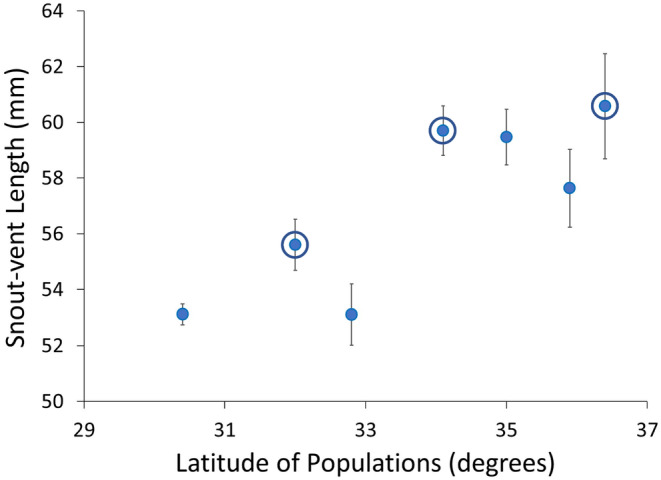
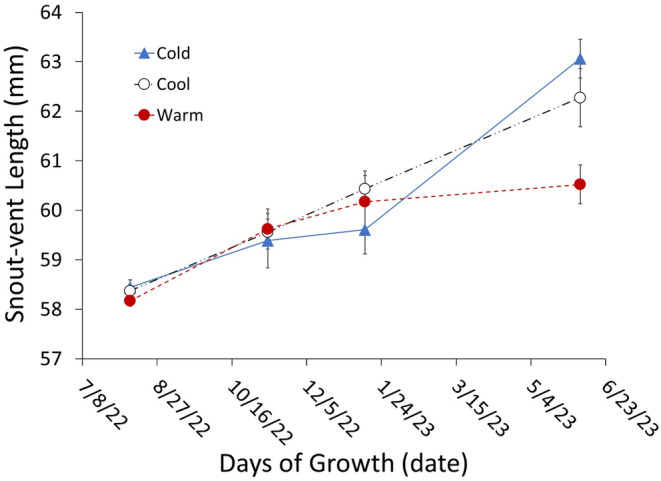
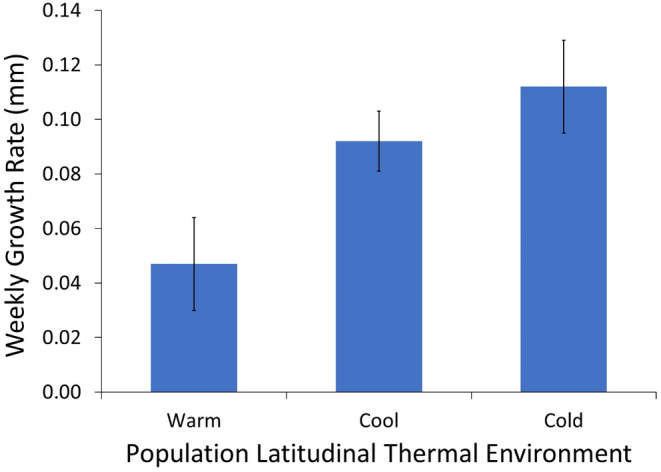
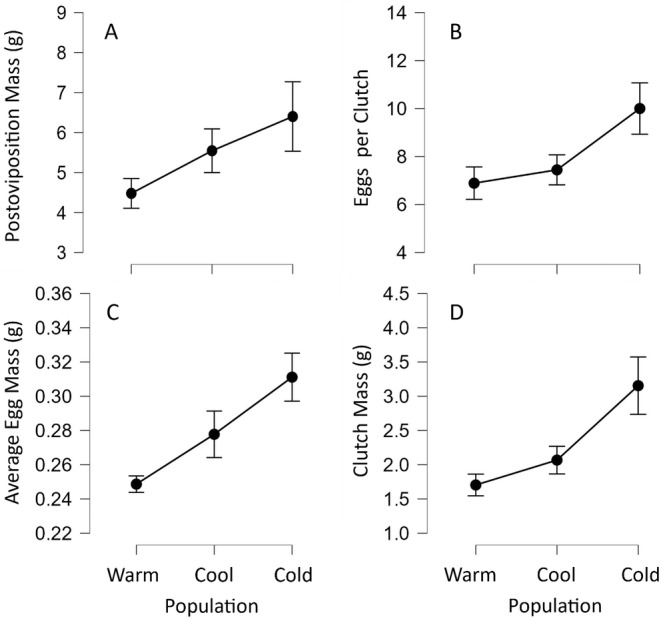
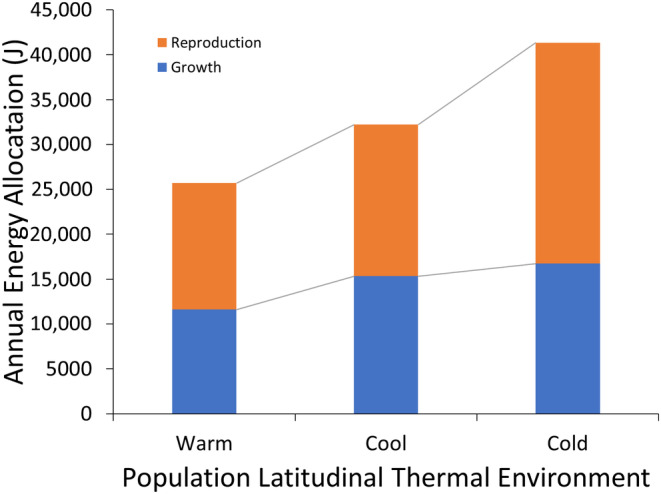
Although we have evidence that many organisms are exhibiting declines in body size in response to climate warming, we have little knowledge of underlying mechanisms or how associated phenotypic suites may coevolve. The better we understand coadaptations among physiology, morphology, and life history, the more accurate our predictions will be of organismal response to changing thermal environments. This is especially salient for ectotherms because they comprise 99% of species worldwide and are key to functioning ecosystems. Here, we assess body size, growth rates, and reproductive traits of a vertebrate ectotherm, the prairie lizard, Sceloporus consobrinus, for multiple populations along a latitudinal thermal gradient and compare body size clines between S. consobrinus and eastern fence lizard (S. undulatus) populations. We found that phenotypic values increased as environmental temperatures decreased for all traits examined, resulting in a pattern representative of countergradient variation. The positive covariation of phenotypes across the thermal gradient exemplifies the enigma of "master of all traits." This enigma was further illustrated by the energy expenditure toward growth and reproduction increasing as phenotypic values increased. The evolutionary responses appear to reveal overcompensation because annual energy expenditure toward growth and reproduction increased even as activity periods decreased. Overall, compensatory responses to cooler thermal environments were exhibited by prairie lizards in body size, growth rate, egg size, and clutch size, resulting in cold-adapted populations allocating more energy toward maintenance, growth, and reproduction than lower latitude, warm-adapted populations. If larger body size in ectotherms is a result of intrinsically faster physiological rates compensating for cooler temperatures and shorter activity periods, then smaller body sizes in warmer environments may be a result of greater reliance on available environmental temperatures for physiological rates and time for assimilating resources.

Keywords: Bergmann's cline; Sceloporus consobrinus; energy budgets; life history; thermal adaptations.


Conflict of interest statement

The authors declare no conflicts of interest.

Figures

FIGURE 1
FIGURE 1
All Sceloporus consobrinus and S. undulatus populations utilized in this study. Three populations of S. consobrinus were transported to the animal care facility at UNO, denoted by open triangles. Population‐specific data (letters) can be found in Appendix S1: Tables S1.
FIGURE 2
FIGURE 2
The negative temperature–size clines in both Sceloporus species across their latitudinal range distribution. Population‐specific body size measures such as snout–vent length were acquired from the literature and data from this study (Appendix S1: Tables S1).
FIGURE 3
FIGURE 3
Body size of adult female Sceloporus consobrinus across our seven latitudinally distinct populations. The three populations brought to the lab for further growth and reproduction data are circled. Points represent mean snout–vent length of lizards caught in the field. Error bars represent ±1 SE.
FIGURE 4
FIGURE 4
Growth of adult female lizards from populations across the latitudinal thermal gradient in a common environment. Growth was measured as changes in snout–vent length over time relative to initial snout–vent length. Populations exhibited innate responses to seasonal rhythms with shifts in growth rates after winter strong enough to see an overall countergradient pattern. Points represent mean snout–vent length of lizards measured in the lab. Error bars represent ±1 SE.
FIGURE 5
FIGURE 5
Growth rates of adult female lizards from populations across the latitudinal thermal gradient. Bars represent weekly growth rates averaged over the duration of the common environment experiment. Error bars represent ±1 standard error.
FIGURE 6
FIGURE 6
Reproductive characteristics of three lizard populations from across the latitudinal thermal gradient. General increases in size occur as native population environments become cooler and cause shorter annual activity periods (Table 2). Characteristics include (A) postoviposition mass of female lizards, (B) number of eggs per clutch, (C) average egg mass per clutch, and (D) average clutch mass produced by lizards from each population. Points represent estimated marginal means from each statistical analysis. Error bars represent ±1 standard error.
FIGURE 7
FIGURE 7
Estimated energy allocated toward growth and reproduction in populations along the latitudinal thermal gradient. Annual estimates are conservative because energy toward reproduction includes only one clutch and growth was over a 300‐day period. Wet masses of eggs and somatic growth were converted to calories based on relationships established in Vitt (1978). Calories were then converted to joules (Appendix S1: Figure S1).
FIGURE 8
FIGURE 8
Results of a principal components analysis (PCA) summarizing body size, growth, and reproductive data among three lizard populations along the latitudinal thermal gradient (warm, cool, and cold). Principal component one (PC 1) was comprised of high loadings for snout–vent length, postoviposition mass, eggs per clutch, and clutch mass. Principal component 2 (PC 2) was comprised of high loadings for weekly growth rate and average egg mass (Table 4). The PCA was employed with Promax rotation because the components were assumed to be partially correlated. Points reflect average PC scores across individuals from each population and error bars represent ±1 SE.
FIGURE 9
FIGURE 9
Hypothetical models of potential reaction norms of three populations (pop 1, pop 2, and pop 3) along an environmental gradient. Model A depicts how differences in a phenotypic response may be found across experimental environments when exhibiting “master of all environments.” Relationships such as these are considered to reflect countergradient variation when the phenotypic shifts among populations are compensatory and genetically influenced across the environmental gradient (Conover and Schultz 1995). Model B depicts how differences in a phenotypic response may be found in only one experimental environment. If the phenotype exhibited compensatory evolution in that environment, then countergradient variation would result along the environmental gradient. Model C depicts how trait values could be similar on average over multiple environments (however, unlikely) but result in phenotypic differences in singular environments. Across all models, if one environment was the most common in the wild and/or the preferred environment (e.g., experimental environment C) and the phenotypic shifts across populations exhibited compensatory evolution in that environment, then countergradient variation would result.

Similar articles

References

    1. Allen, J. A. 1877. “The Influence of Physical Conditions in the Genesis of Species.” Radical Review 1: 108–140.
    1. Andrew, N. R. , and Hughes L.. 2005. “Arthropod Community Structure Along a Latitudinal Gradient: Implications for Future Impacts of Climate Change.” Austral Ecology 30: 281–297. 10.1111/j.1442-9993.2005.01464.x. - DOI
    1. Andrews, R. M. 1998. “Geographic Variation in Field Body Temperature of Sceloporus Lizards.” Journal of Thermal Biology 23, no. 6: 329–334.
    1. Angilletta, M. J., Jr. 2001. “Variation in Metabolic Rate Between Populations of a Geographically Widespread Lizard.” Physiological and Biochemical Zoology 74, no. 1: 11–21. - PubMed
    1. Angilletta, M. J., Jr. , Niewiarowski P. H., Dunham A. E., Leaché A. D., and Porter W. P.. 2004. “Bergmann's Clines in Ectotherms: Illustrating a Life‐History Perspective With Sceloporine Lizards.” American Naturalist 164, no. 6: E168–E183. - PubMed

LinkOut - more resources