. 2024 Dec:109:487-594.
doi: 10.3114/sim.2024.109.08. Epub 2024 Oct 23.

Diaporthe species on palms - integrative taxonomic approach for species boundaries delimitation in the genus Diaporthe, with the description of D. pygmaeae sp. nov

Affiliations

Diaporthe species on palms - integrative taxonomic approach for species boundaries delimitation in the genus Diaporthe, with the description of D. pygmaeae sp. nov

D S Pereira et al. Stud Mycol. 2024 Dec.

Abstract

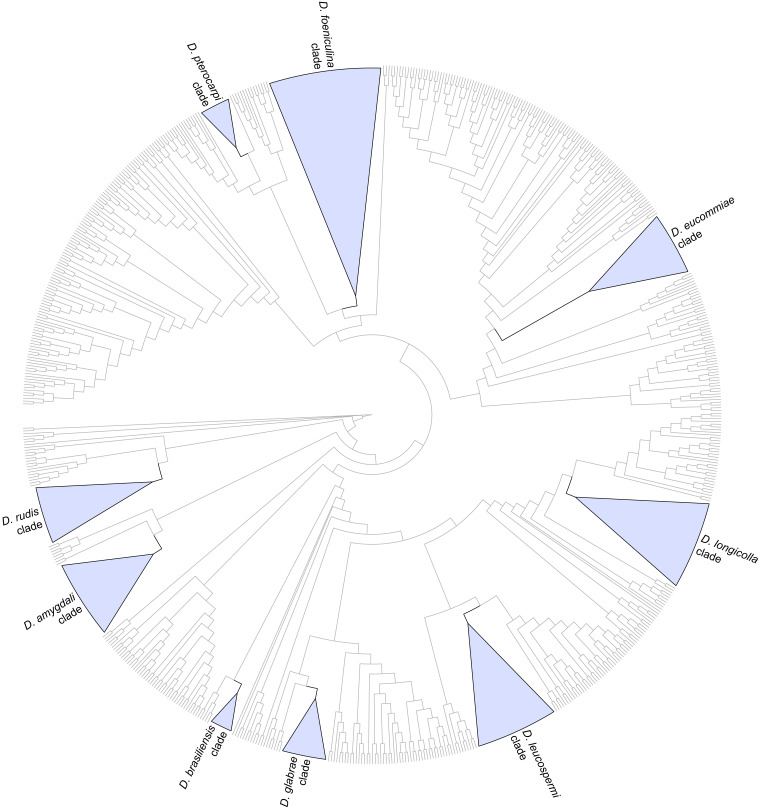
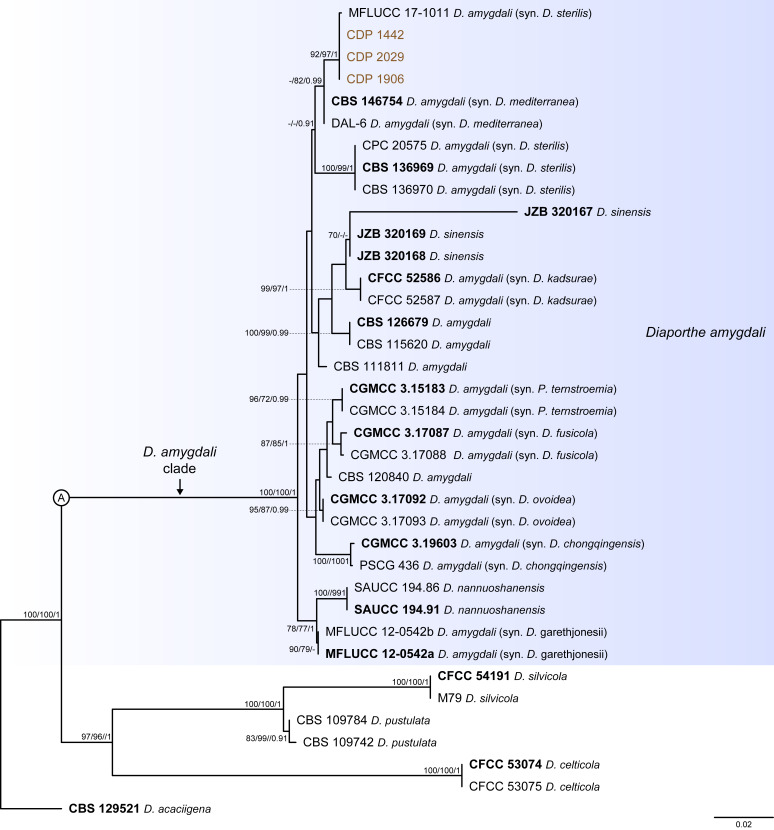
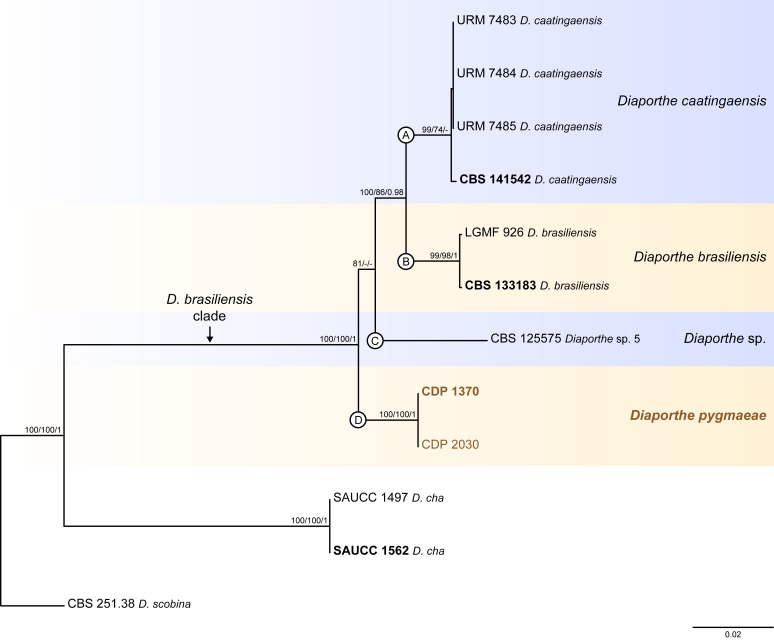
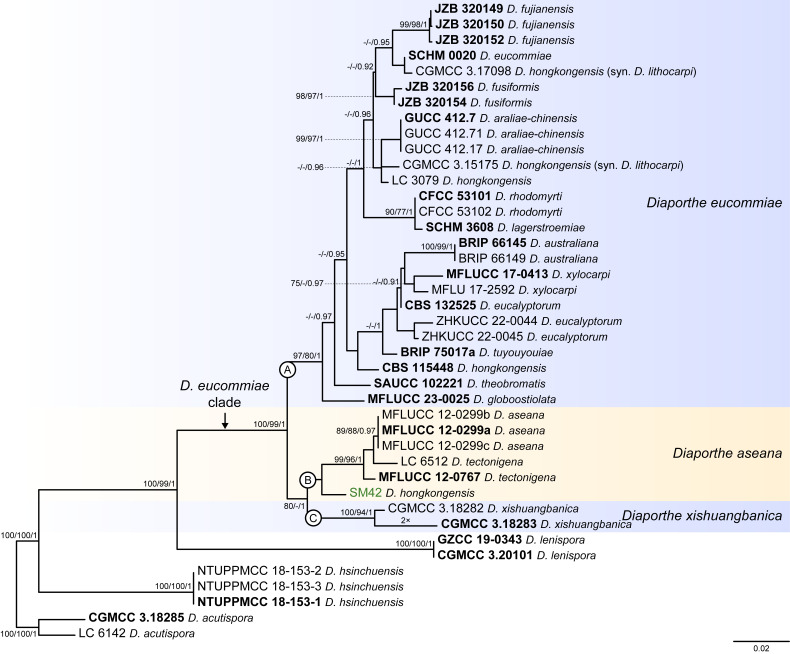
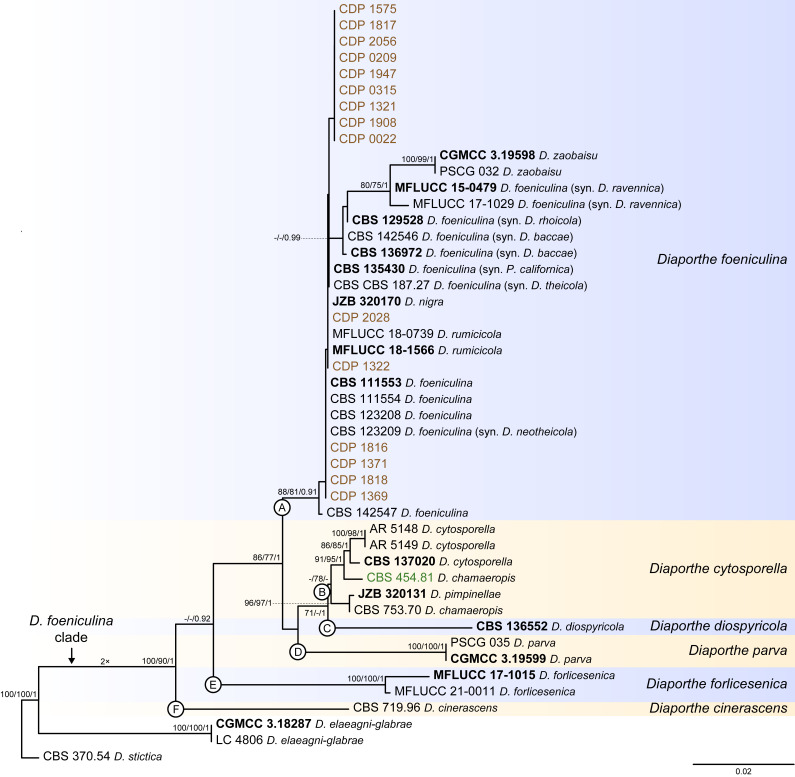
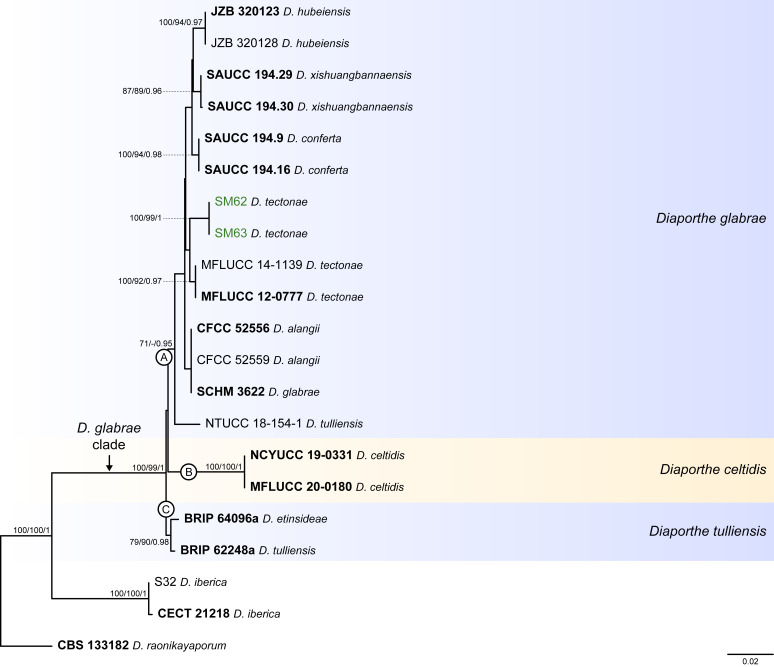
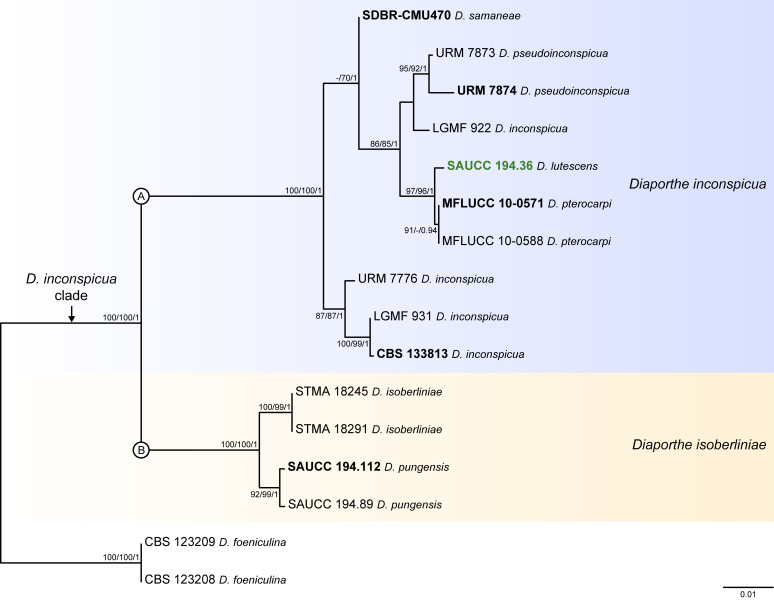
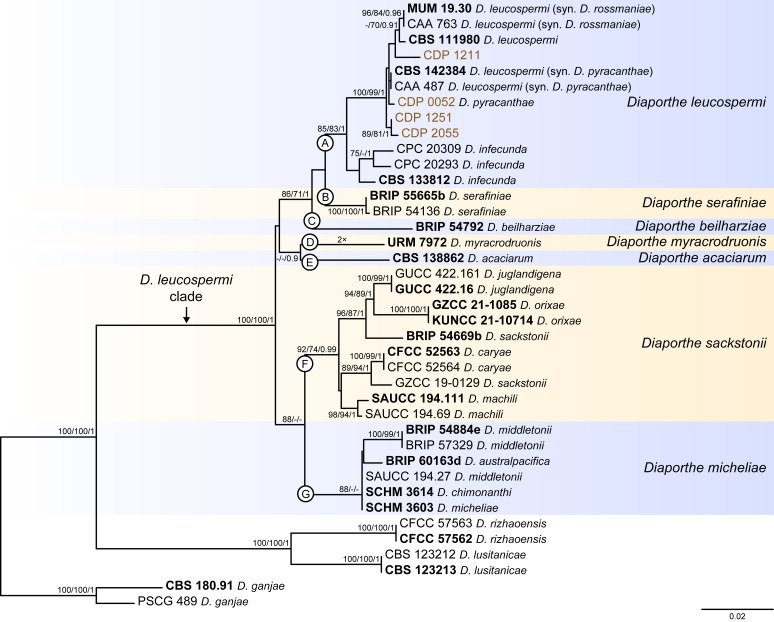
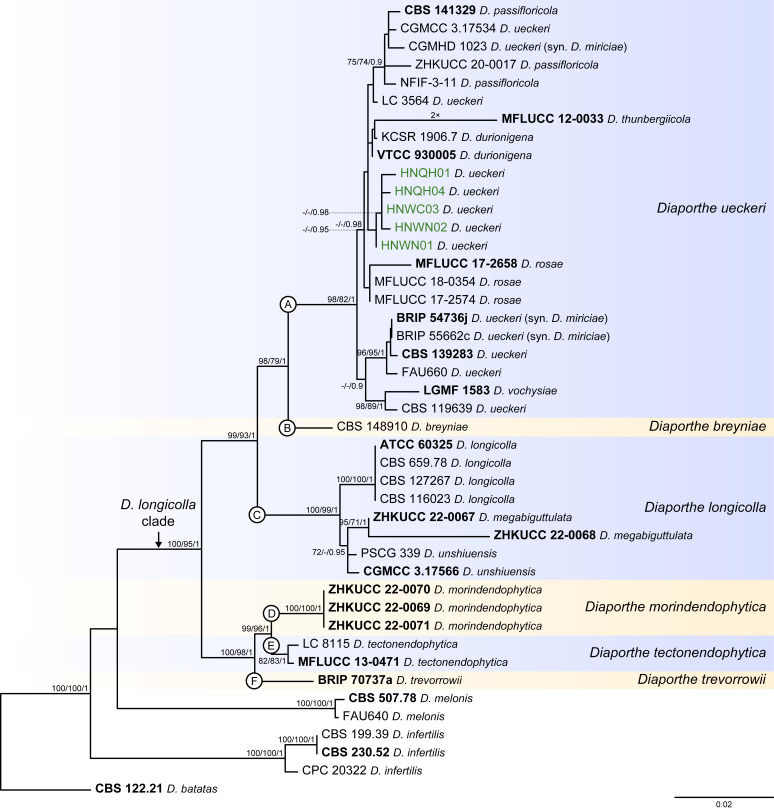
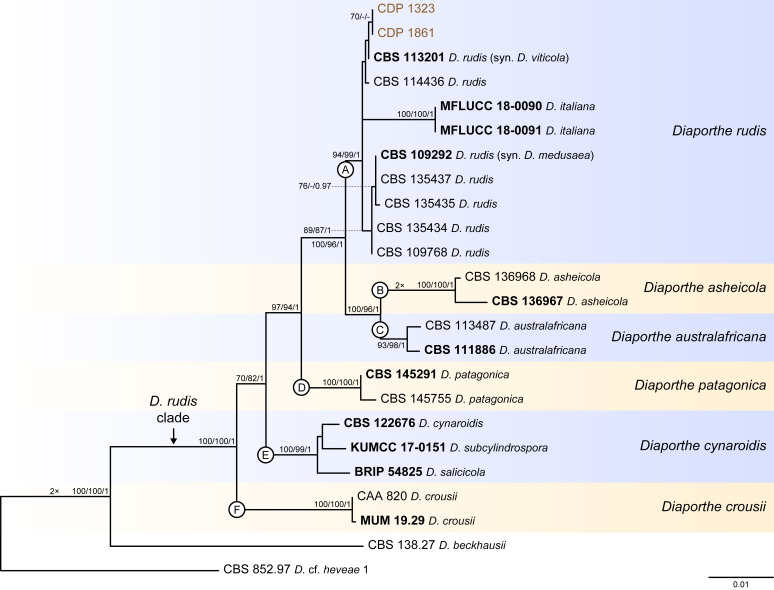
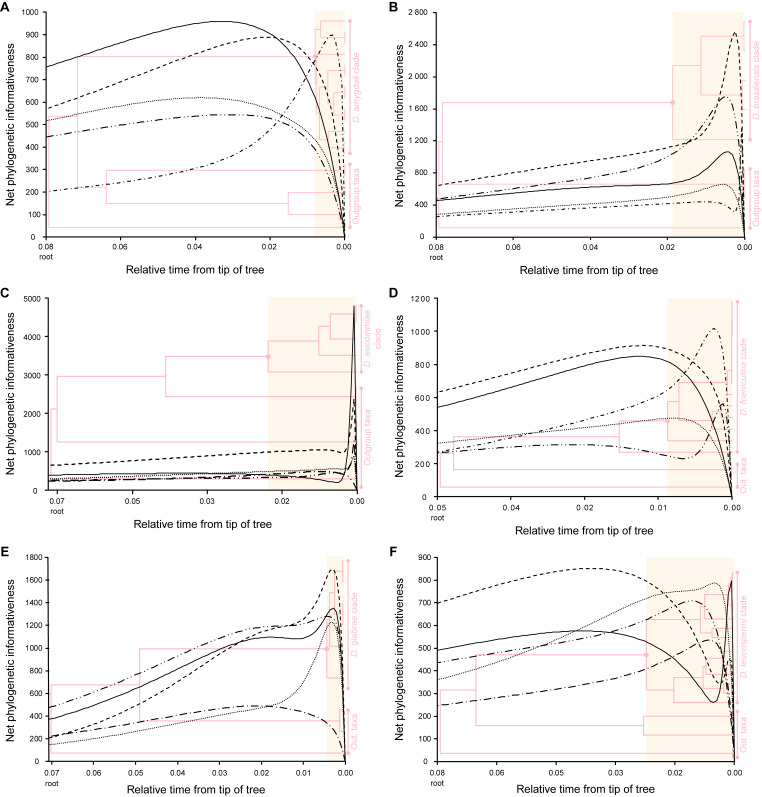
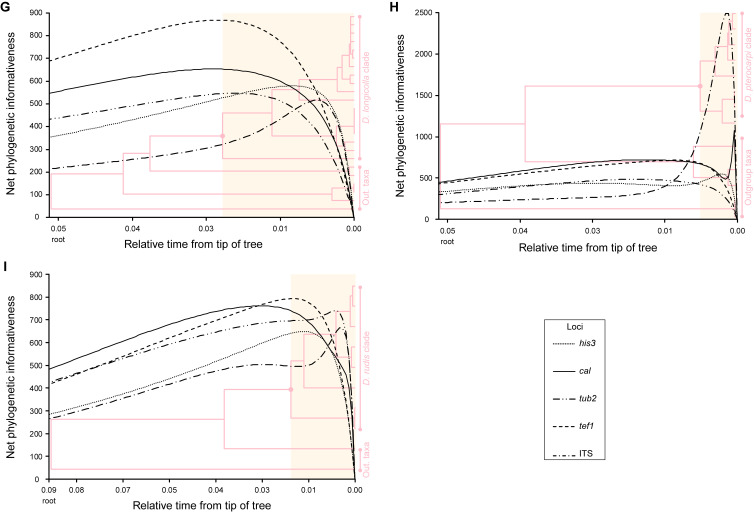
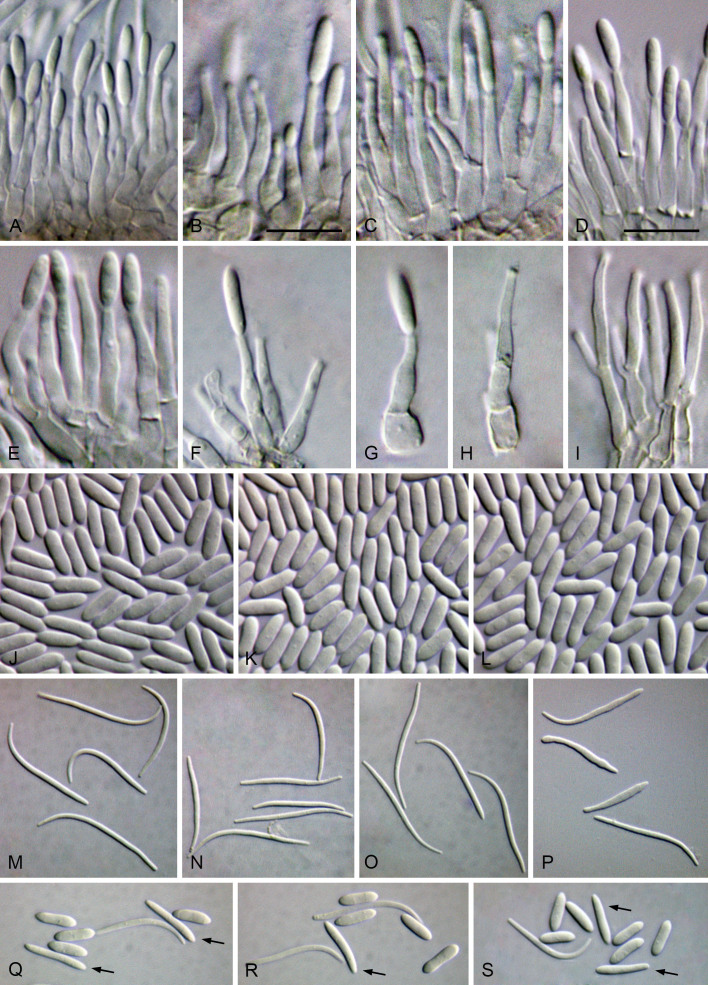
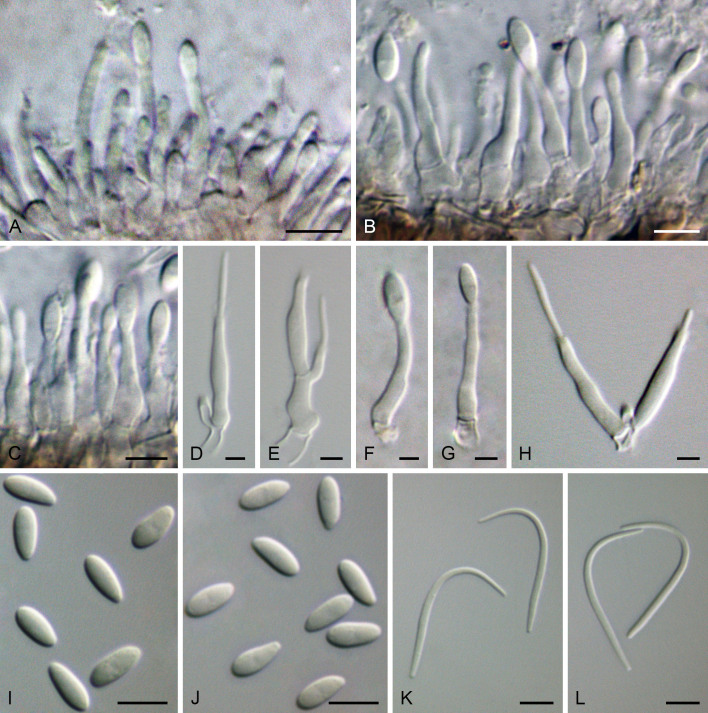
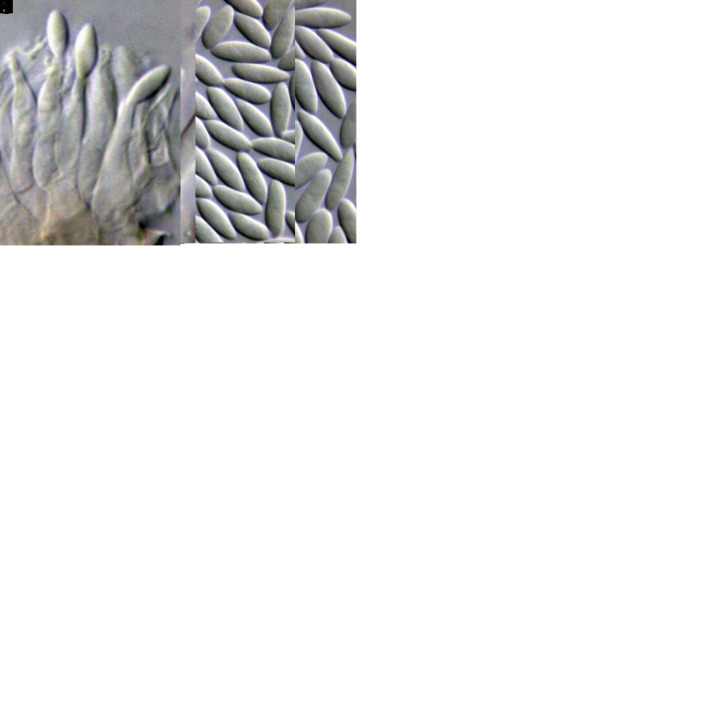
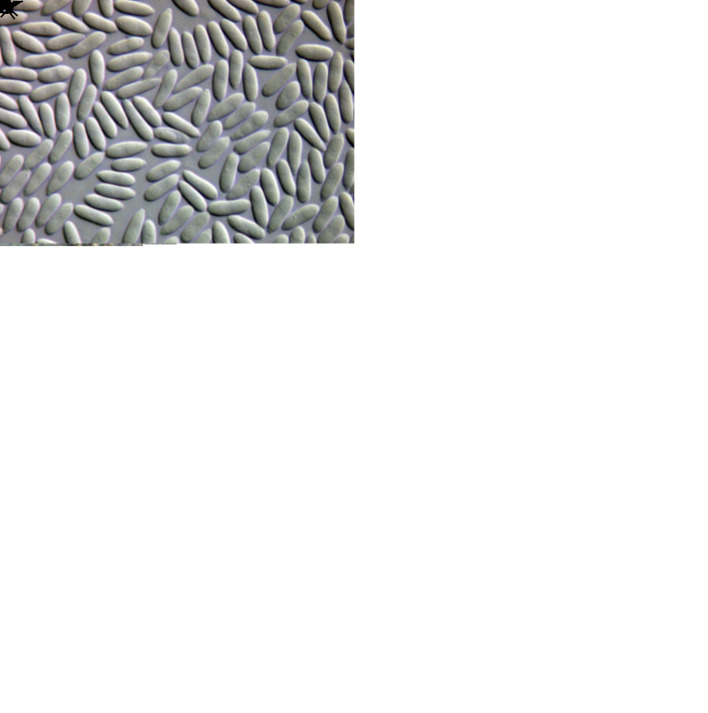
The application of traditional morphological and ecological species concepts to closely related, asexual fungal taxa is challenging due to the lack of distinctive morphological characters and frequent cosmopolitan and plurivorous behaviour. As a result, multilocus sequence analysis (MLSA) has become a powerful and widely used tool to recognise and delimit independent evolutionary lineages (IEL) in fungi. However, MLSA can mask discordances in individual gene trees and lead to misinterpretation of speciation events. This phenomenon has been extensively documented in Diaporthe, and species identifications in this genus remains an ongoing challenge. However, the accurate delimitation of Diaporthe species is critical as the genus encompasses several cosmopolitan pathogens that cause serious diseases on many economically important plant hosts. In this regard, following a survey of palm leaf spotting fungi in Lisbon, Portugal, Diaporthe species occurring on Arecaceae hosts were used as a case study to implement an integrative taxonomic approach for a reliable species identification in the genus. Molecular analyses based on the genealogical concordance phylogenetic species recognition (GCPSR) and DNA-based species delimitation methods revealed that speciation events in the genus have been highly overestimated. Most IEL identified by the GCPSR were also recognised by Poisson tree processes (PTP) coalescent-based methods, which indicated that phylogenetic lineages in Diaporthe are likely influenced by incomplete lineage sorting (ILS) and reticulation events. Furthermore, the recognition of genetic recombination signals and the evaluation of genetic variability based on sequence polymorphisms reinforced these hypotheses. New clues towards the intraspecific variation in the common loci used for phylogenetic inference of Diaporthe species are discussed. These results demonstrate that intraspecific variability has often been used as an indicator to introduce new species in Diaporthe, which has led to a proliferation of species names in the genus. Based on these data, 53 species are reduced to synonymy with 18 existing Diaporthe species, and a new species, D. pygmaeae, is introduced. Thirteen new plant host-fungus associations are reported, all of which represent new host family records for Arecaceae. This study has recognised and resolved a total of 14 valid Diaporthe species associated with Arecaceae hosts worldwide, some of which are associated with disease symptoms. This illustrates the need for more systematic research to examine the complex of Diaporthe taxa associated with palms and determine their potential pathogenicity. By implementing a more rational framework for future studies on species delimitation in Diaporthe, this study provides a solid foundation to stabilise the taxonomy of species in the genus. Guidelines for species recognition, definition and identification in Diaporthe are included. Taxonomic novelties: New species: Diaporthe pygmaeae D.S. Pereira & A.J.L. Phillips. New synonyms: Diaporthe afzeliae Monkai & Lumyong, Diaporthe alangii C.M. Tian & Q. Yang, Diaporthe araliae-chinensis S.Y. Wang et al., Diaporthe australiana R.G. Shivas et al., Diaporthe australpacifica Y.P. Tan & R.G. Shivas, Diaporthe bombacis Monkai & Lumyong, Diaporthe caryae C.M. Tian & Q. Yang, Diaporthe chimonanthi (C.Q. Chang et al.) Y.H. Gao & L. Cai, Diaporthe conferta H. Dong et al., Diaporthe diospyrina Y.K. Bai & X.L. Fan, Diaporthe durionigena L.D. Thao et al., Diaporthe etinsideae Y.P. Tan & R.G. Shivas, Diaporthe eucalyptorum Crous & R.G. Shivas, Diaporthe fujianensis Jayaward. et al., Diaporthe fusiformis Jayaward. et al., Diaporthe globoostiolata Monkai & Lumyong, Diaporthe hainanensis Qin Yang, Diaporthe hongkongensis R.R. Gomes et al., Diaporthe hubeiensis Dissan. et al., Diaporthe infecunda R.R. Gomes et al., Diaporthe italiana Chethana et al., Diaporthe juglandigena S.Y. Wang et al., Diaporthe lagerstroemiae (C.Q. Chang et al.) Y.H. Gao & L. Cai, Diaporthe lithocarpi (Y.H. Gao et al.) Y.H. Gao & L. Cai, Diaporthe lutescens S.T. Huang et al., Diaporthe machili S.T. Huang et al., Diaporthe megabiguttulata M. Luo et al., Diaporthe middletonii R.G. Shivas et al., Diaporthe morindae M. Luo et al., Diaporthe nannuoshanensis S.T. Huang et al., Diaporthe nigra Brahman. & K.D. Hyde, Diaporthe orixae Q.T. Lu & Zhen Zhang, Diaporthe passifloricola Crous & M.J. Wingf., Diaporthe pimpinellae Abeywickrama et al., Diaporthe pseudoinconspicua T.G.L Oliveira et al., Diaporthe pungensis S.T. Huang et al., Diaporthe rhodomyrti C.M. Tian & Qin Yang, Diaporthe rosae M.C. Samar. & K.D. Hyde, Diaporthe rumicicola Manawas et al., Diaporthe salicicola R.G. Shivas et al., Diaporthe samaneae Monkai & Lumyong, Diaporthe subcylindrospora S.K. Huang et al., Diaporthe tectonae Doilom et al., Diaporthe tectonigena Doilom et al., Diaporthe theobromatis H. Dong et al., Diaporthe thunbergiicola Udayanga & K.D. Hyde, Diaporthe tuyouyouiae Y.P. Tan et al., Diaporthe unshiuensis F. Huang et al., Diaporthe vochysiae S.A. Noriler et al., Diaporthe xishuangbannaensis Hongsanan & K.D. Hyde, Diaporthe xylocarpi M.S. Calabon & E.B.G. Jones, Diaporthe zaobaisu Y.S. Guo & G.P. Wang, Diaporthe zhaoqingensis M. Luo et al. Citation: Pereira DS, Phillips AJL (2024). Diaporthe species on palms - integrative taxonomic approach for species boundaries delimitation in the genus Diaporthe, with the description of D. pygmaeae sp. nov. Studies in Mycology 109: 487-594. doi: 10.3114/sim.2024.109.08.

Keywords: coalescent-based methods; genetic distance-based methods; integrative taxonomy; new taxa; species limits.


Conflict of interest statement

The authors declare that there is no conflict of interest.

Figures

Fig. 1
Fig. 1
Cladogram of the phylogenetic tree generated from a maximum likelihood analysis based on combined ITS, tef1, tub2, cal and his3 sequence data of the isolates from palms examined in this study and all species currently accepted in the genus Diaporthe. A total of 783 strains were included in the combined dataset that comprised 2 790 characters (including gaps) (576 characters for ITS, 507 for tef1, 560 for tub2, 614 for cal and 533 for his3) after alignment and manual adjustment. The analysis was conducted using the GTR+G+I nucleotide substitution model. Taxa names and phylogenetic support values have been removed for simplification purposes. The well-supported (ML-BS ≥ 95 %) clades containing the isolates from palms examined in this study have been collapsed and are highlighted with coloured triangles with their respective branches in black. Cladogram is rooted to Cytospora disciformis (CBS 116827 and CBS 118083).
Fig. 2
Fig. 2
Phylogenetic tree generated from a maximum likelihood analysis based on combined ITS, tef1, tub2, cal and his3 sequence data of the Diaporthe amygdali clade and closely related species. Bootstrap support values for maximum likelihood, maximum parsimony (ML-BS/MP-BS ≥ 70 %) and Bayesian posterior probabilities (PP ≥ 0.90) are shown at the nodes. Strains with type status are indicated in bold font. The isolates from this study are presented in brown typeface. Species boundaries within the D. amygdali clade are delimited with a coloured block and its respective branch is indicated by a lettered circle (A). The scale bar represents the expected number of nucleotide changes per site. The tree is rooted to D. acaciigena (CBS 129521).
Fig. 3
Fig. 3
Phylogenetic tree generated from a maximum likelihood analysis based on combined ITS, tef1, tub2, cal and his3 sequence data of the Diaporthe brasiliensis clade and closely related species. Bootstrap support values for maximum likelihood, maximum parsimony (ML-BS/MP-BS ≥ 70 %) and Bayesian posterior probabilities (PP ≥ 0.90) are shown at the nodes. Strains with type status are indicated in bold font. The isolates from this study are presented in brown typeface. Species boundaries within the D. brasiliensis clade are delimited with coloured blocks and their respective branches are indicated by lettered circles (A–D). The scale bar represents the expected number of nucleotide changes per site. The tree is rooted to D. scobina (CBS 251.38).
Fig. 4
Fig. 4
Phylogenetic tree generated from a maximum likelihood analysis based on combined ITS, tef1, tub2, cal and his3 sequence data of the Diaporthe eucommiae clade and closely related species. Bootstrap support values for maximum likelihood, maximum parsimony (ML-BS/MP-BS ≥ 70 %) and Bayesian posterior probabilities (PP ≥ 0.90) are shown at the nodes. Strains with type status are indicated in bold font. The isolate from palm tissues included in the analyses is presented in green typeface. Species boundaries within the D. eucommiae clade are delimited with coloured blocks and their respective branches are indicated by lettered circles (A–C). The scale bar represents the expected number of nucleotide changes per site. The tree is rooted to D. acutispora (CGMCC 3.18285 and LC 6142).
Fig. 5
Fig. 5
Phylogenetic tree generated from a maximum likelihood analysis based on combined ITS, tef1, tub2, cal and his3 sequence data of the Diaporthe foeniculina clade and closely related species. Bootstrap support values for maximum likelihood, maximum parsimony (ML-BS/MP-BS ≥ 70 %) and Bayesian posterior probabilities (PP ≥ 0.90) are shown at the nodes. Strains with type status are indicated in bold font. The isolates from this study are presented in brown typeface and the additional isolate from palm tissues included in the analyses is presented in green typeface. Species boundaries within the D. foeniculina clade are delimited with coloured blocks and their respective branches are indicated by lettered circles (A–F). The scale bar represents the expected number of nucleotide changes per site. The tree is rooted to D. stictica (CBS 370.54).
Fig. 6
Fig. 6
Phylogenetic tree generated from a maximum likelihood analysis based on combined ITS, tef1, tub2, cal and his3 sequence data of the Diaporthe glabrae clade and closely related species. Bootstrap support values for maximum likelihood, maximum parsimony (ML-BS/MP-BS ≥ 70 %) and Bayesian posterior probabilities (PP ≥ 0.90) are shown at the nodes. Strains with type status are indicated in bold font. The isolates from palm tissues included in the analyses are presented in green typeface. Species boundaries within the D. glabrae clade are delimited with coloured blocks and their respective branches are indicated by lettered circles (A–C). The scale bar represents the expected number of nucleotide changes per site. The tree is rooted to D. raonikayaporum (CBS 133182).
Fig. 7
Fig. 7
Phylogenetic tree generated from a maximum likelihood analysis based on combined ITS, tef1, tub2, cal and his3 sequence data of the Diaporthe inconspicua clade and closely related species. Bootstrap support values for maximum likelihood, maximum parsimony (ML-BS/MP-BS ≥ 70 %) and Bayesian posterior probabilities (PP ≥ 0.90) are shown at the nodes. Strains with type status are indicated in bold font. The isolate from palm tissues included in the analyses is presented in green typeface. Species boundaries within the D. inconspicua clade are delimited with coloured blocks and their respective branches are indicated by lettered circles (A and B). The scale bar represents the expected number of nucleotide changes per site. The tree is rooted to D. foeniculina (CBS 123208 and CBS 123209).
Fig. 8
Fig. 8
Phylogenetic tree generated from a maximum likelihood analysis based on combined ITS, tef1, tub2, cal and his3 sequence data of the Diaporthe leucospermi clade and closely related species. Bootstrap support values for maximum likelihood, maximum parsimony (ML-BS/MP-BS ≥ 70 %) and Bayesian posterior probabilities (PP ≥ 0.90) are shown at the nodes. Strains with type status are indicated in bold font. The isolates from this study are presented in brown typeface. Species boundaries within the D. leucospermi clade are delimited with coloured blocks and their respective branches are indicated by lettered circles (A–G). The scale bar represents the expected number of nucleotide changes per site. The tree is rooted to D. ganjae (CBS 180.91 and PSCG 489).
Fig. 9
Fig. 9
Phylogenetic tree generated from a maximum likelihood analysis based on combined ITS, tef1, tub2, cal and his3 sequence data of the Diaporthe longicolla clade and closely related species. Bootstrap support values for maximum likelihood, maximum parsimony (ML-BS/MP-BS ≥ 70 %) and Bayesian posterior probabilities (PP ≥ 0.90) are shown at the nodes. Strains with type status are indicated in bold font. The isolates from palm tissues included in the analyses are presented in green typeface. Species boundaries within the D. longicolla clade are delimited with coloured blocks and their respective branches are indicated by lettered circles (A–F). The scale bar represents the expected number of nucleotide changes per site. The tree is rooted to D. batatas (CBS 122.21).
Fig. 10
Fig. 10
Phylogenetic tree generated from a maximum likelihood analysis based on combined ITS, tef1, tub2, cal and his3 sequence data of the Diaporthe rudis clade and closely related species. Bootstrap support values for maximum likelihood, maximum parsimony (ML-BS/MP-BS ≥ 70 %) and Bayesian posterior probabilities (PP ≥ 0.90) are shown at the nodes. Strains with type status are indicated in bold font. The isolates from this study are presented in brown typeface. Species boundaries within the D. rudis clade are delimited with coloured blocks and their respective branches are indicated by lettered circles (A–F). The scale bar represents the expected number of nucleotide changes per site. The tree is rooted to D. cf. heveae 1 (CBS 852.97).
Fig. 11
Fig. 11
Net phylogenetic informativeness profiles (PIP) in arbitrary units of Diaporthe species through relative time scales for combined datasets of 5-loci (ITS, tef1, tub2, cal and his3). A. PIP of the D. amygdali clade and related species. B. PIP of the D. brasiliensis clade and related species. C. PIP of the D. eucommiae clade and related species. D. PIP of the D. foeniculina clade and related species. E. PIP of the D. glabrae clade and related species. F. PIP of the D. inconspicua clade and related species. G. PIP of the D. leucospermi clade and related species. H. PIP of the D. longicolla clade and related species. I. PIP of the D. rudis clade and related species. The lines represent individual loci profiles and are referred to in the chart legend. The respective time trees inferred by applying the RelTime-ML method are shown in the background of each panel, in corresponding time scales. All divergence times shown are relative times as no calibrations were used. Nodes of radiation of each Diaporthe clade are highlighted by dots and the corresponding graph areas are emphasised by coloured blocks.
Fig. 11
Fig. 11
Net phylogenetic informativeness profiles (PIP) in arbitrary units of Diaporthe species through relative time scales for combined datasets of 5-loci (ITS, tef1, tub2, cal and his3). A. PIP of the D. amygdali clade and related species. B. PIP of the D. brasiliensis clade and related species. C. PIP of the D. eucommiae clade and related species. D. PIP of the D. foeniculina clade and related species. E. PIP of the D. glabrae clade and related species. F. PIP of the D. inconspicua clade and related species. G. PIP of the D. leucospermi clade and related species. H. PIP of the D. longicolla clade and related species. I. PIP of the D. rudis clade and related species. The lines represent individual loci profiles and are referred to in the chart legend. The respective time trees inferred by applying the RelTime-ML method are shown in the background of each panel, in corresponding time scales. All divergence times shown are relative times as no calibrations were used. Nodes of radiation of each Diaporthe clade are highlighted by dots and the corresponding graph areas are emphasised by coloured blocks.
Fig. 12
Fig. 12
Species delimitation analyses of the Diaporthe amygdali clade. A. Comparison of species delimitation results for the D. amygdali clade based on a combined dataset of 5-loci (ITS, tef1, tub2, cal and his3), unless indicated otherwise (see Materials and Methods for further explanation). Schematic phylogenetic relationships are shown using the species delimitation scheme obtained from the PTP analysis, in which putative species clusters are represented as transitions from blue-coloured (speciation process) to red-coloured (population process) branches or as terminal, blue-coloured branches. Dot-bounded bars in the right-hand columns show the results of the genealogical concordance- (pink column; GCPSR), coalescence- (blue column; PTP and mPTP) and distance-based (yellow column; ABGD, ASAP and SPN) species delimitation analyses, which are referred to at the top. Incongruent results in relation to the GCPSR are highlighted in red. B–D. NeighborNet phylogenetic networks of D. amygdali and related species based on the LogDet transformation for a combined dataset of 5-loci (ITS, tef1, tub2, cal and his3). The D. amygdali clade and respective species are delimited by dashed and coloured shapes, respectively. The PHI test results are presented next to each set of species tested and if positive for recombination is indicated by an asterisk (*). Strains with type status are indicated in bold font. The isolates from this study are presented in brown typeface. The scale bars represent the expected number of nucleotide changes per site.
Fig. 13
Fig. 13
Species delimitation analyses of the Diaporthe brasiliensis clade. A. Comparison of species delimitation results for the D. brasiliensis clade based on a combined dataset of 5-loci (ITS, tef1, tub2, cal and his3), unless indicated otherwise (see Materials and Methods for further explanation). Schematic phylogenetic relationships are shown using the species delimitation scheme obtained from the PTP analysis, in which putative species clusters are represented as transitions from blue-coloured (speciation process) to red-coloured (population process) branches or as terminal, blue-coloured branches. Dot-bounded bars in the right-hand columns show the results of the genealogical concordance- (pink column; GCPSR), coalescence- (blue column; PTP and mPTP) and distance-based (yellow column; ABGD, ASAP and SPN) species delimitation analyses, which are referred to at the top. B–D. NeighborNet phylogenetic networks of D. brasiliensis and related species based on the LogDet transformation for a combined dataset of 5-loci (ITS, tef1, tub2, cal and his3). The D. brasiliensis clade and respective species are delimited by dashed and coloured shapes, respectively. The PHI test results are presented next to each set of species tested and if positive for recombination is indicated by an asterisk (*). Strains with type status are indicated in bold font. The isolates from this study are presented in brown typeface. The scale bars represent the expected number of nucleotide changes per site.
Fig. 14
Fig. 14
Species delimitation analyses of the Diaporthe eucommiae clade. A. Comparison of species delimitation results for the D. eucommiae clade based on a combined dataset of 5-loci (ITS, tef1, tub2, cal and his3), unless indicated otherwise (see Materials and Methods for further explanation). Schematic phylogenetic relationships are shown using the species delimitation scheme obtained from the PTP analysis, in which putative species clusters are represented as transitions from blue-coloured (speciation process) to red-coloured (population process) branches. Dot-bounded bars in the right-hand columns show the results of the genealogical concordance- (pink column; GCPSR), coalescent- (blue column; PTP and mPTP) and distance-based (yellow column; ABGD, ASAP and SPN) species delimitation analyses, which are referred to at the top. Incongruent results in relation to the GCPSR are highlighted in red. Empty dots indicate taxa excluded from the analysis due to lack of sequence data. B, C. NeighborNet phylogenetic networks of D. eucommiae and related species based on the LogDet transformation for a combined dataset of 5-loci (ITS, tef1, tub2, cal and his3). The D. eucommiae clade and respective species are delimited by dashed and coloured shapes, respectively. The PHI test results are presented next to each set of species tested and if positive for recombination is indicated by an asterisk (*). Strains with type status are indicated in bold font. The isolate from palm tissues included in the analyses is presented in green typeface. The scale bars represent the expected number of nucleotide changes per site.
Fig. 15
Fig. 15
Species delimitation analyses of the Diaporthe foeniculina clade. A. Comparison of species delimitation results for the D. foeniculina clade based on a combined dataset of 5-loci (ITS, tef1, tub2, cal and his3), unless indicated otherwise (see Materials and Methods for further explanation). Schematic phylogenetic relationships are shown using the species delimitation scheme obtained from the PTP analysis, in which putative species clusters are represented as transitions from blue-coloured (speciation process) to red-coloured (population process) branches or as terminal, blue-coloured branches. Dots and dot-bounded bars in the right-hand columns show the results of the genealogical concordance- (pink column; GCPSR), coalescence- (blue column; PTP and mPTP) and distance-based (yellow column; ABGD, ASAP and SPN) species delimitation analyses, which are referred to at the top. Incongruent results in relation to the GCPSR are highlighted in red. Empty dots indicate taxa excluded from the analysis due to lack of sequence data. B. NeighborNet phylogenetic networks of D. foeniculina and related species based on the LogDet transformation for a combined dataset of 5-loci (ITS, tef1, tub2, cal and his3). The D. foeniculina clade and respective species are delimited by dashed and coloured shapes, respectively. The PHI test results are presented next to each set of species tested and if positive for recombination is indicated by an asterisk (*). Strains with type status are indicated in bold font. The isolates from this study are presented in brown typeface and the additional isolate from palm tissues included in the analyses is presented in green typeface. The scale bars represent the expected number of nucleotide changes per site.
Fig. 16
Fig. 16
Species delimitation analyses of the Diaporthe glabrae clade. A. Comparison of species delimitation results for the D. glabrae clade based on a combined dataset of 5-loci (ITS, tef1, tub2, cal and his3), unless indicated otherwise (see Materials and Methods for further explanation). Schematic phylogenetic relationships are shown using the species delimitation scheme obtained from the PTP analysis, in which putative species clusters are represented as transitions from blue-coloured (speciation process) to red-coloured (population process) branches or as terminal, blue-coloured branches. Dots and dot-bounded bars in the right-hand columns show the results of the genealogical concordance- (pink column; GCPSR), coalescent- (blue column; PTP and mPTP) and distance-based (yellow column; ABGD, ASAP and SPN) species delimitation analyses, which are referred to at the top. Incongruent results in relation to the GCPSR are highlighted in red. Empty dots indicate taxa excluded from the analysis due to lack of sequence data. B, C. NeighborNet phylogenetic networks of D. glabrae and related species based on the LogDet transformation for a combined dataset of 5-loci (ITS, tef1, tub2, cal and his3). The D. glabrae clade and respective species are delimited by dashed and coloured shapes, respectively. The PHI test results are presented next to each set of species tested and if positive for recombination is indicated by an asterisk (*). Strains with type status are indicated in bold font. The isolates from palm tissues included in the analyses are presented in green typeface. The scale bars represent the expected number of nucleotide changes per site.
Fig. 17
Fig. 17
Species delimitation analyses of the Diaporthe inconspicua clade. A. Comparison of species delimitation results for the D. inconspicua clade based on a combined dataset of 5-loci (ITS, tef1, tub2, cal and his3), unless indicated otherwise (see Materials and Methods for further explanation). Schematic phylogenetic relationships are shown using the species delimitation scheme obtained from the PTP analysis, in which putative species clusters are represented as transitions from blue-coloured (speciation process) to red-coloured (population process) branches. Dot-bounded bars in the right-hand columns show the results of the genealogical concordance- (pink column; GCPSR), coalescent- (blue column; PTP and mPTP) and distance-based (yellow column; ABGD, ASAP and SPN) species delimitation analyses, which are referred to at the top. B, C. NeighborNet phylogenetic networks of D. inconspicua and related species based on the LogDet transformation for a combined dataset of 5-loci (ITS, tef1, tub2, cal and his3). The D. inconspicua clade and respective species are delimited by dashed and coloured shapes, respectively. The PHI test results are presented next to each set of species tested and if positive for recombination is indicated by an asterisk (*). Strains with type status are indicated in bold font. The isolate from palm tissues included in the analyses is presented in green typeface. The scale bars represent the expected number of nucleotide changes per site.
Fig. 18
Fig. 18
Species delimitation analyses of the Diaporthe leucospermi clade. A. Comparison of species delimitation results for the D. leucospermi clade based on a combined dataset of 5-loci (ITS, tef1, tub2, cal and his3), unless indicated otherwise (see Materials and Methods for further explanation). Schematic phylogenetic relationships are shown using the species delimitation scheme obtained from the PTP analysis, in which putative species clusters are represented as transitions from blue-coloured (speciation process) to red-coloured (population process) branches or as terminal, blue-coloured branches. Dots and dot-bounded bars in the right-hand columns show the results of the genealogical concordance- (pink column; GCPSR), coalescent-(blue column; PTP and mPTP) and distance-based (yellow column; ABGD, ASAP and SPN) species delimitation analyses, which are referred to at the top. B–D. NeighborNet phylogenetic networks of D. leucospermi and related species based on the LogDet transformation for a combined dataset of 5-loci (ITS, tef1, tub2, cal and his3). The D. leucospermi clade and respective species are delimited by dashed and coloured shapes, respectively. The PHI test results are presented next to each set of species tested and if positive for recombination is indicated by an asterisk (*). Strains with type status are indicated in bold font. The isolates from this study are presented in brown typeface. The scale bars represent the expected number of nucleotide changes per site.
Fig. 19
Fig. 19
Species delimitation analyses of the Diaporthe longicolla clade. A. Comparison of species delimitation results for the D. longicolla clade based on a combined dataset of 5-loci (ITS, tef1, tub2, cal and his3), unless indicated otherwise (see Materials and Methods for further explanation). Schematic phylogenetic relationships are shown using the species delimitation scheme obtained from the PTP analysis, in which putative species clusters are represented as transitions from blue-coloured (speciation process) to red-coloured (population process) branches or as terminal, blue-coloured branches. Dots and dot-bounded bars in the right-hand columns show the results of the genealogical concordance- (pink column; GCPSR), coalescent- (blue column; PTP and mPTP) and distance-based (yellow column; ABGD, ASAP and SPN) species delimitation analyses, which are referred to at the top. B. NeighborNet phylogenetic networks of D. longicolla and related species based on the LogDet transformation for a combined dataset of 5-loci (ITS, tef1, tub2, cal and his3). The D. longicolla clade and respective species are delimited by dashed and coloured shapes, respectively. The PHI test results are presented next to each set of species tested and if positive for recombination is indicated by an asterisk (*). Strains with type status are indicated in bold font. The isolates from palm tissues included in the analyses are presented in green typeface. The scale bars represent the expected number of nucleotide changes per site.
Fig. 20
Fig. 20
Species delimitation analyses of the Diaporthe rudis clade. A. Comparison of species delimitation results for the D. rudis clade based on a combined dataset of 5-loci (ITS, tef1, tub2, cal and his3), unless indicated otherwise (see Materials and Methods for further explanation). Schematic phylogenetic relationships are shown using the species delimitation scheme obtained from the PTP analysis, in which putative species clusters are represented as transitions from blue-coloured (speciation process) to red-coloured (population process) branches or as terminal, blue-coloured branches. Dots and dot-bounded bars in the right-hand columns show the results of the genealogical concordance- (pink column; GCPSR), coalescent- (blue column; PTP and mPTP) and distance-based (yellow column; ABGD, ASAP and SPN) species delimitation analyses, which are referred to at the top. B–D. NeighborNet phylogenetic networks of D. rudis and related species based on the LogDet transformation for a combined dataset of 5-loci (ITS, tef1, tub2, cal and his3). The D. rudis clade and respective species are delimited by dashed and coloured shapes, respectively. The PHI test results are presented next to each set of species tested and if positive for recombination is indicated by an asterisk (*). Strains with type status are indicated in bold font. The isolates from this study are presented in brown typeface. The scale bars represent the expected number of nucleotide changes per site.
Fig. 21
Fig. 21
Dendrograms obtained by hierarchical cluster analysis of Diaporthe clades using Euclidean distance and UPGMA algorithm. A. Dendrogram of the D. amygdali clade based on the length-to-width ratio (L/W) of alpha conidia and elements of the conidiogenous layer. B. Dendrogram of the D. brasiliensis clade based on the L/W of alpha conidia and elements of the conidiogenous layer. C. Dendrogram of the D. eucommiae clade based on the L/W of alpha and beta conidia. D. Dendrogram of the D. foeniculina clade based on the L/W of alpha and beta conidia and elements of the conidiogenous layer. E. Dendrogram of the D. glabrae clade based on the L/W of alpha and beta conidia and elements of the conidiogenous layer. F. Dendrogram of the D. inconspicua clade based on the L/W of alpha and beta conidia and elements of the conidiogenous layer. G. Dendrogram of the D. leucospermi clade based on the L/W of alpha and beta conidia and elements of the conidiogenous layer. H. Dendrogram of the D. longicolla clade based on the L/W of alpha and beta conidia. I. Dendrogram of the D. rudis clade based on the L/W of alpha and beta conidia and elements of the conidiogenous layer. The taxa included in each analysis were those with available measurements for the micromorphological structure used to infer the respective dendrogram. The horizontal dashed lines indicate the putative distance cut-of level used to produce clusters. Euclidean distance values greater than 0.00 are shown at the nodes. Clusters are highlighted with coloured lines. Phylogenetic species are highlighted by different coloured typefaces and referred to in the chart legend. The cophenetic correlation coefficient (c) is noted below the chart legend.
Fig. 21
Fig. 21
Dendrograms obtained by hierarchical cluster analysis of Diaporthe clades using Euclidean distance and UPGMA algorithm. A. Dendrogram of the D. amygdali clade based on the length-to-width ratio (L/W) of alpha conidia and elements of the conidiogenous layer. B. Dendrogram of the D. brasiliensis clade based on the L/W of alpha conidia and elements of the conidiogenous layer. C. Dendrogram of the D. eucommiae clade based on the L/W of alpha and beta conidia. D. Dendrogram of the D. foeniculina clade based on the L/W of alpha and beta conidia and elements of the conidiogenous layer. E. Dendrogram of the D. glabrae clade based on the L/W of alpha and beta conidia and elements of the conidiogenous layer. F. Dendrogram of the D. inconspicua clade based on the L/W of alpha and beta conidia and elements of the conidiogenous layer. G. Dendrogram of the D. leucospermi clade based on the L/W of alpha and beta conidia and elements of the conidiogenous layer. H. Dendrogram of the D. longicolla clade based on the L/W of alpha and beta conidia. I. Dendrogram of the D. rudis clade based on the L/W of alpha and beta conidia and elements of the conidiogenous layer. The taxa included in each analysis were those with available measurements for the micromorphological structure used to infer the respective dendrogram. The horizontal dashed lines indicate the putative distance cut-of level used to produce clusters. Euclidean distance values greater than 0.00 are shown at the nodes. Clusters are highlighted with coloured lines. Phylogenetic species are highlighted by different coloured typefaces and referred to in the chart legend. The cophenetic correlation coefficient (c) is noted below the chart legend.
Fig. 22
Fig. 22
Diaporthe amygdali (CDP 1442). A, B. Conidiogenous layer. C–G. Conidiophores and conidiogenous cells. H, I. Alpha conidia (black arrow in panel H points at a gamma conidium). Scale bars: A–D, H, I = 5 μm, E–G = 2.5 μm.
Fig. 23
Fig. 23
Diaporthe foeniculina. A–C, F–J, M, Q–S: CDP 1369; D, E, P: CDP 0022; K, N: CDP 1818; L, O: CDP 1947. A–E. Conidiogenous layer. F–I. Conidiophores and conidiogenous cells. J–L. Alpha conidia. M–P. Beta conidia. Q–S. Alpha, beta and gamma (black arrows) conidia. Scale bars: A–F, J–S = 5 μm, G–I = 2.5 μm.
Fig. 24
Fig. 24
Diaporthe leucospermi (CDP 0052). A–C. Conidiogenous layer. D–H. Conidiophores and conidiogenous cells. I, J. Alpha conidia. K, L. Beta conidia. Scale bars: A–C, I–L = 5 μm, D–H = 2.5 μm.
Fig. 25
Fig. 25
Diaporthe pygmaeae. A–F, H–K, N: CDP 1370, ex-type; G, L, M: CDP 2030. A–D. Conidiogenous layer. E–J. Conidiophores and conidiogenous cells. K–N. Alpha conidia. M. Pigmented alpha conidia. N. Microcyclic conidiogenesis (black arrow). Scale bars: A–C, K, L = 5 μm, D–J = 2.5 μm.
Fig. 26
Fig. 26
Diaporthe rudis (CDP 1323). A–D. Conidiogenous layer. E–I. Conidiophores and conidiogenous cells (black arrows point to collarettes). J, K. Alpha conidia. Scale bars: A–D, J, K = 5 μm, E–I = 2.5 μm.

Similar articles

  • What are the 100 most cited fungal genera?
    Bhunjun CS, Chen YJ, Phukhamsakda C, Boekhout T, Groenewald JZ, McKenzie EHC, Francisco EC, Frisvad JC, Groenewald M, Hurdeal VG, Luangsa-Ard J, Perrone G, Visagie CM, Bai FY, Błaszkowski J, Braun U, de Souza FA, de Queiroz MB, Dutta AK, Gonkhom D, Goto BT, Guarnaccia V, Hagen F, Houbraken J, Lachance MA, Li JJ, Luo KY, Magurno F, Mongkolsamrit S, Robert V, Roy N, Tibpromma S, Wanasinghe DN, Wang DQ, Wei DP, Zhao CL, Aiphuk W, Ajayi-Oyetunde O, Arantes TD, Araujo JC, Begerow D, Bakhshi M, Barbosa RN, Behrens FH, Bensch K, Bezerra JDP, Bilański P, Bradley CA, Bubner B, Burgess TI, Buyck B, Čadež N, Cai L, Calaça FJS, Campbell LJ, Chaverri P, Chen YY, Chethana KWT, Coetzee B, Costa MM, Chen Q, Custódio FA, Dai YC, Damm U, Santiago ALCMA, De Miccolis Angelini RM, Dijksterhuis J, Dissanayake AJ, Doilom M, Dong W, Álvarez-Duarte E, Fischer M, Gajanayake AJ, Gené J, Gomdola D, Gomes AAM, Hausner G, He MQ, Hou L, Iturrieta-González I, Jami F, Jankowiak R, Jayawardena RS, Kandemir H, Kiss L, Kobmoo N, Kowalski T, Landi L, Lin CG, Liu JK, Liu XB, Loizides M, Luangharn T, Maharachchikumbura SSN, Mkhwanazi GJM, Manawasinghe IS, Marin-Felix Y, McTaggart AR, Moreau PA, Morozova OV, Mostert L, … See abstract for full author list ➔ Bhunjun CS, et al. Stud Mycol. 2024 Jul;108:1-411. doi: 10.3114/sim.2024.108.01. Epub 2024 Jul 15. Stud Mycol. 2024. PMID: 39100921 Free PMC article.
  • Worldwide forest surveys reveal forty-three new species in Phytophthora major Clade 2 with fundamental implications for the evolution and biogeography of the genus and global plant biosecurity.
    Jung T, Milenković I, Balci Y, Janoušek J, Kudláček T, Nagy ZÁ, Baharuddin B, Bakonyi J, Broders KD, Cacciola SO, Chang TT, Chi NM, Corcobado T, Cravador A, Đorđević B, Durán A, Ferreira M, Fu CH, Garcia L, Hieno A, Ho HH, Hong C, Junaid M, Kageyama K, Kuswinanti T, Maia C, Májek T, Masuya H, Magnano di San Lio G, Mendieta-Araica B, Nasri N, Oliveira LSS, Pane A, Pérez-Sierra A, Rosmana A, Sanfuentes von Stowasser E, Scanu B, Singh R, Stanivuković Z, Tarigan M, Thu PQ, Tomić Z, Tomšovský M, Uematsu S, Webber JF, Zeng HC, Zheng FC, Brasier CM, Horta Jung M. Jung T, et al. Stud Mycol. 2024 Mar;107:251-388. doi: 10.3114/sim.2024.107.04. Epub 2024 Feb 27. Stud Mycol. 2024. PMID: 38600961 Free PMC article.
  • Expression of Concern.
    Authors Listed N. Authors Listed N. Eur Rev Med Pharmacol Sci. 2025 Jun;29(6):287-288. doi: 10.26355/eurrev_202506_37270. Eur Rev Med Pharmacol Sci. 2025. PMID: 40613620
  • Systemic pharmacological treatments for chronic plaque psoriasis: a network meta-analysis.
    Sbidian E, Chaimani A, Garcia-Doval I, Doney L, Dressler C, Hua C, Hughes C, Naldi L, Afach S, Le Cleach L. Sbidian E, et al. Cochrane Database Syst Rev. 2021 Apr 19;4(4):CD011535. doi: 10.1002/14651858.CD011535.pub4. Cochrane Database Syst Rev. 2021. Update in: Cochrane Database Syst Rev. 2022 May 23;5:CD011535. doi: 10.1002/14651858.CD011535.pub5. PMID: 33871055 Free PMC article. Updated.
  • Signs and symptoms to determine if a patient presenting in primary care or hospital outpatient settings has COVID-19.
    Struyf T, Deeks JJ, Dinnes J, Takwoingi Y, Davenport C, Leeflang MM, Spijker R, Hooft L, Emperador D, Domen J, Tans A, Janssens S, Wickramasinghe D, Lannoy V, Horn SRA, Van den Bruel A; Cochrane COVID-19 Diagnostic Test Accuracy Group. Struyf T, et al. Cochrane Database Syst Rev. 2022 May 20;5(5):CD013665. doi: 10.1002/14651858.CD013665.pub3. Cochrane Database Syst Rev. 2022. PMID: 35593186 Free PMC article.

Cited by

References

    1. Achari SR, Kaur J, Dinh Q. et al. (2020). Phylogenetic relationship between Australian Fusarium oxysporum isolates and resolving the species complex using the multispecies coalescent model. BMC Genomics 21: 248. - PMC - PubMed
    1. Adaskaveg JE, Förster H, Connell JH. (1999). First report of fruit rot and associated branch dieback of almond in California caused by a Phomopsis species tentatively identified as P. amygdali. Plant Disease 83: 1073. - PubMed
    1. Ahrens D, Fujisawa T, Krammer H-J, et al. (2016). Rarity and incomplete sampling in DNA-based species delimitation. Systematic Biology 65: 478–494. - PubMed
    1. Aiello D, Guarnaccia V, Costanzo MB. et al. (2022). Woody canker and shoot blight caused by Botryosphaeriaceae and Diaporthaceae on mango and litchi in Italy. Horticulturae 8: 330.
    1. Aime MC, Miller AN, Aoki T. et al. (2021). How to publish a new fungal species, or name, version 3.0. IMA Fungus 12: 11. - PMC - PubMed

LinkOut - more resources