. 2024 Dec:109:57-153.
doi: 10.3114/sim.2024.109.02. Epub 2024 Jun 27.

Proposal of one new family, seven new genera and seventy new basidiomycetous yeast species mostly isolated from Tibet and Yunnan provinces, China

Affiliations

Proposal of one new family, seven new genera and seventy new basidiomycetous yeast species mostly isolated from Tibet and Yunnan provinces, China

Y-L Jiang et al. Stud Mycol. 2024 Dec.

Abstract

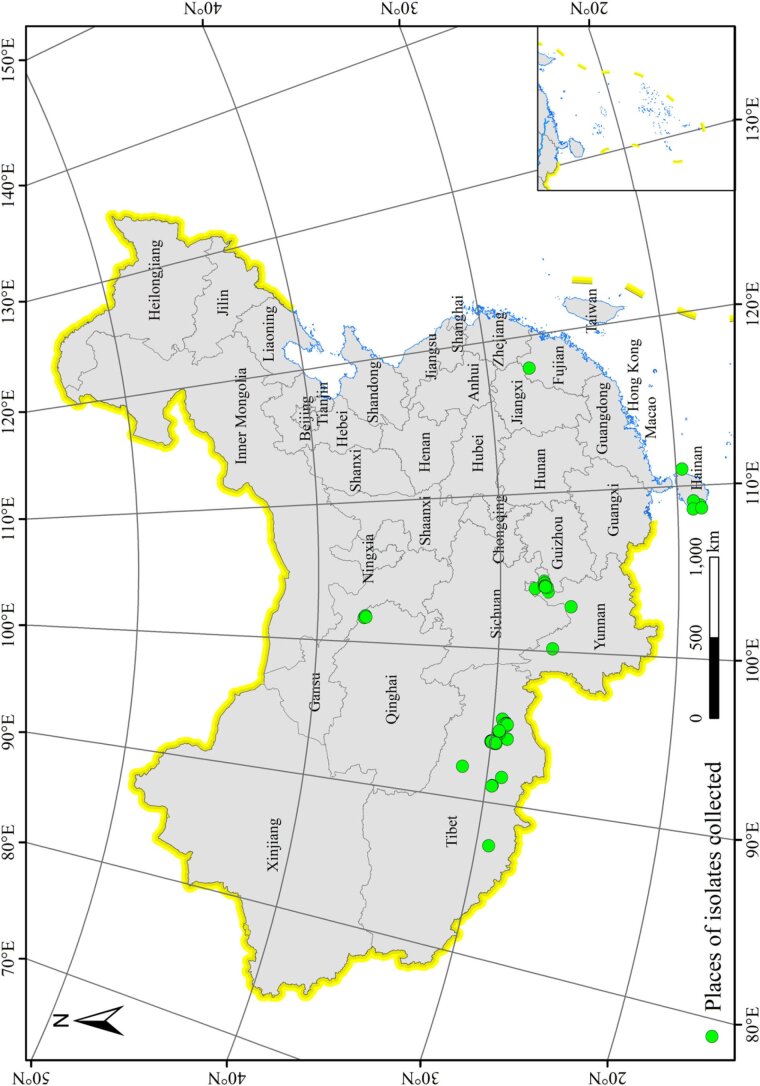
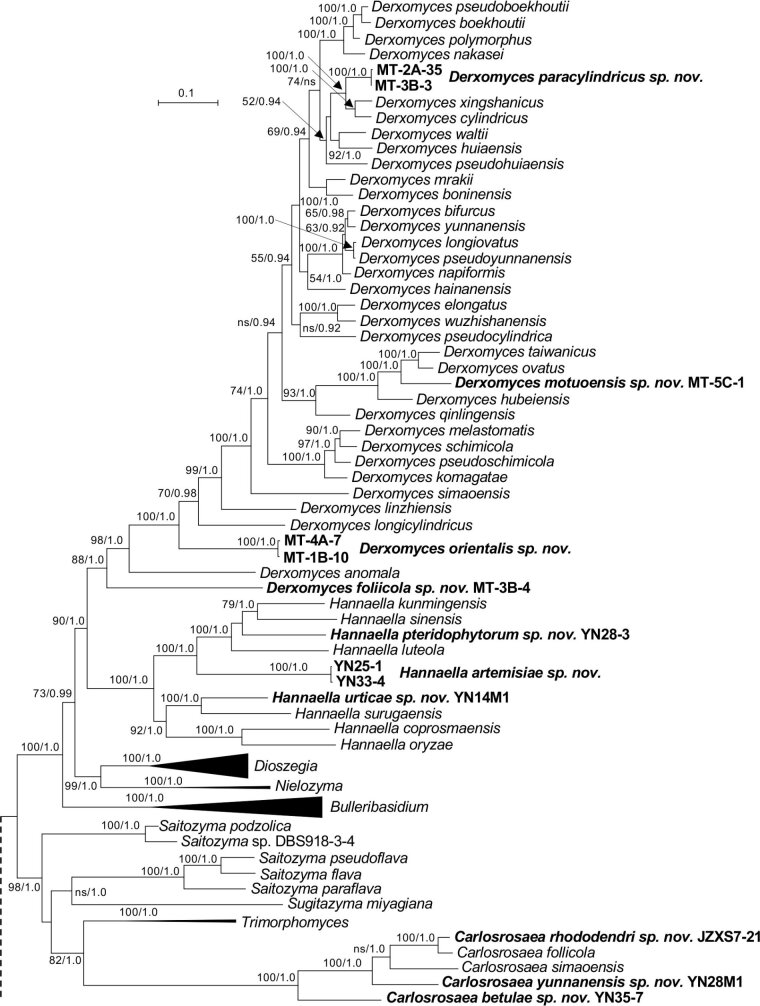
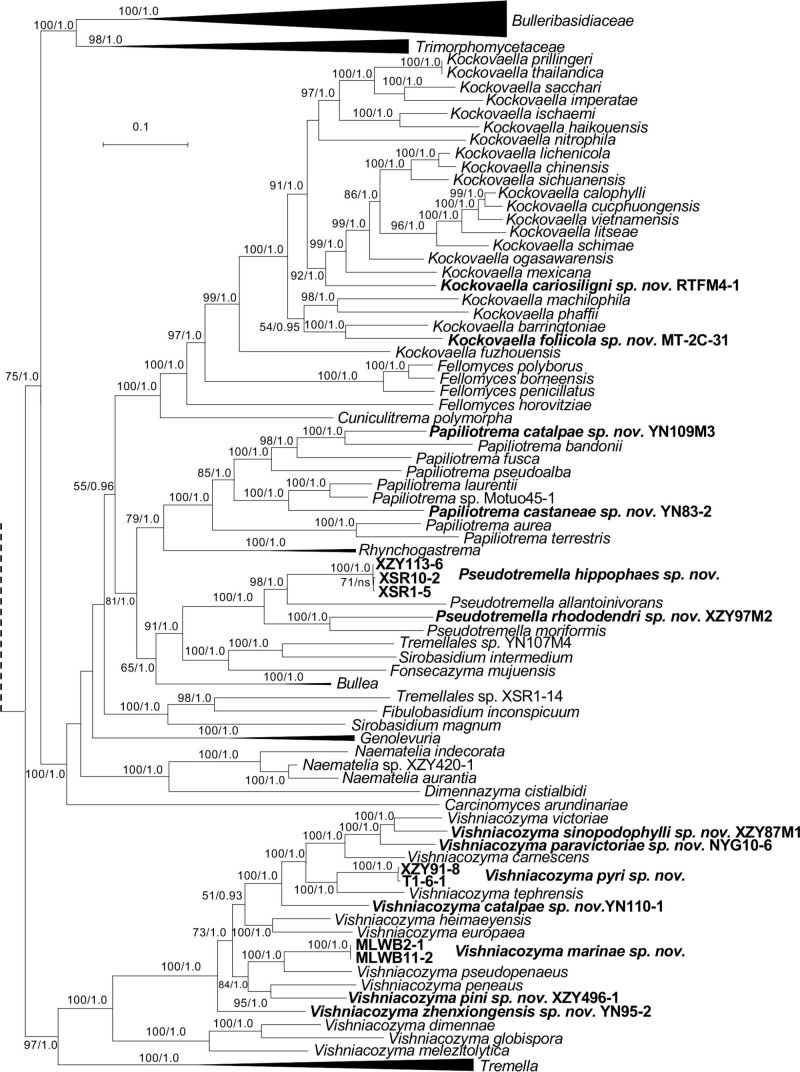
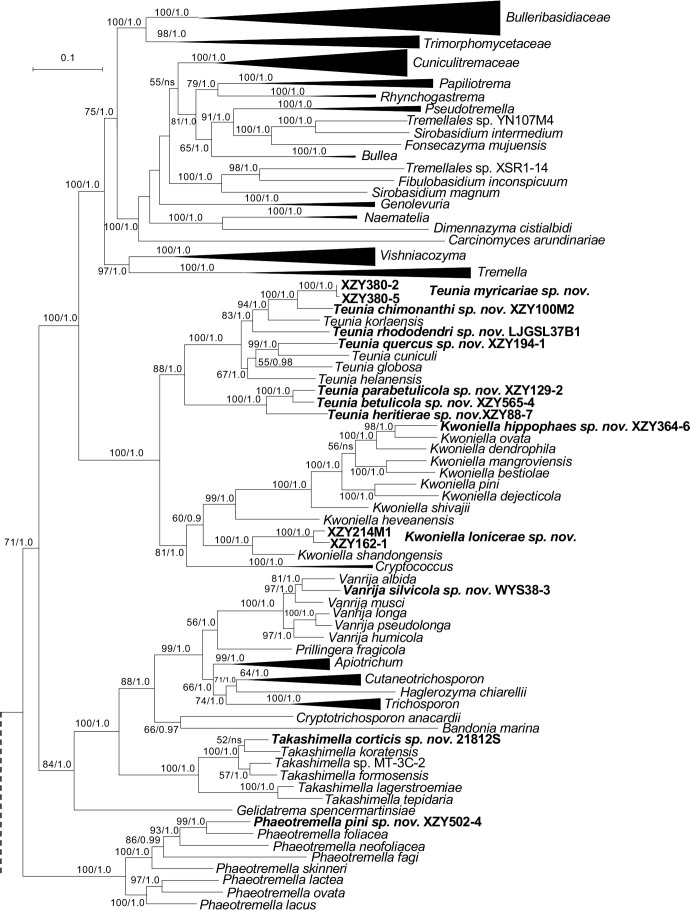
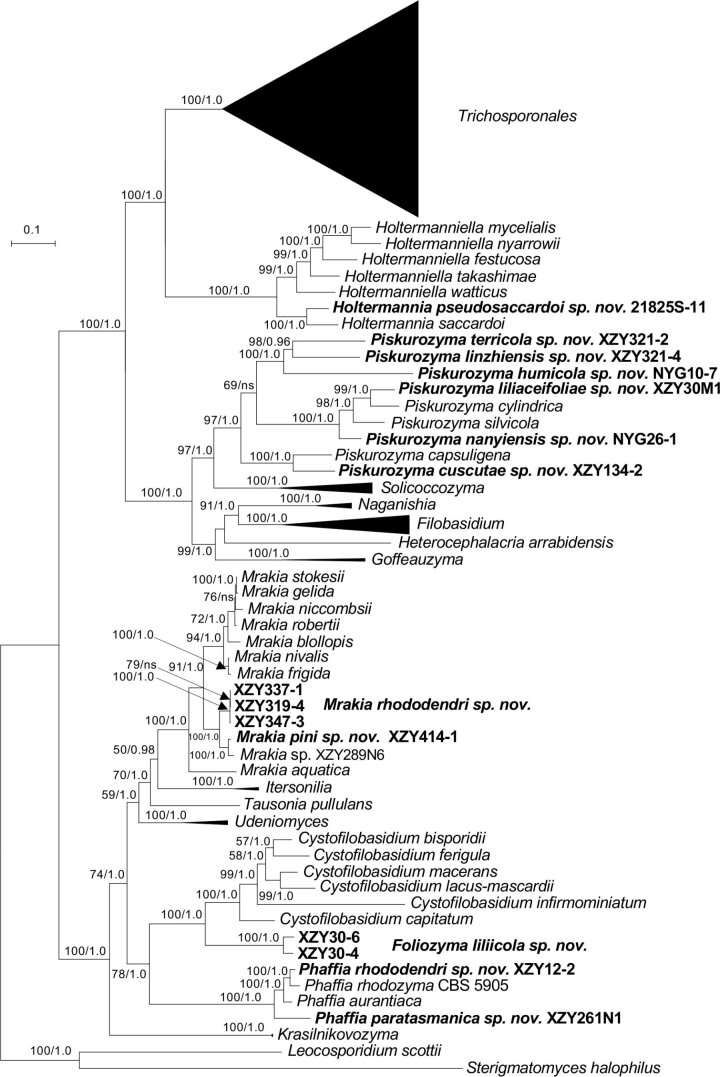
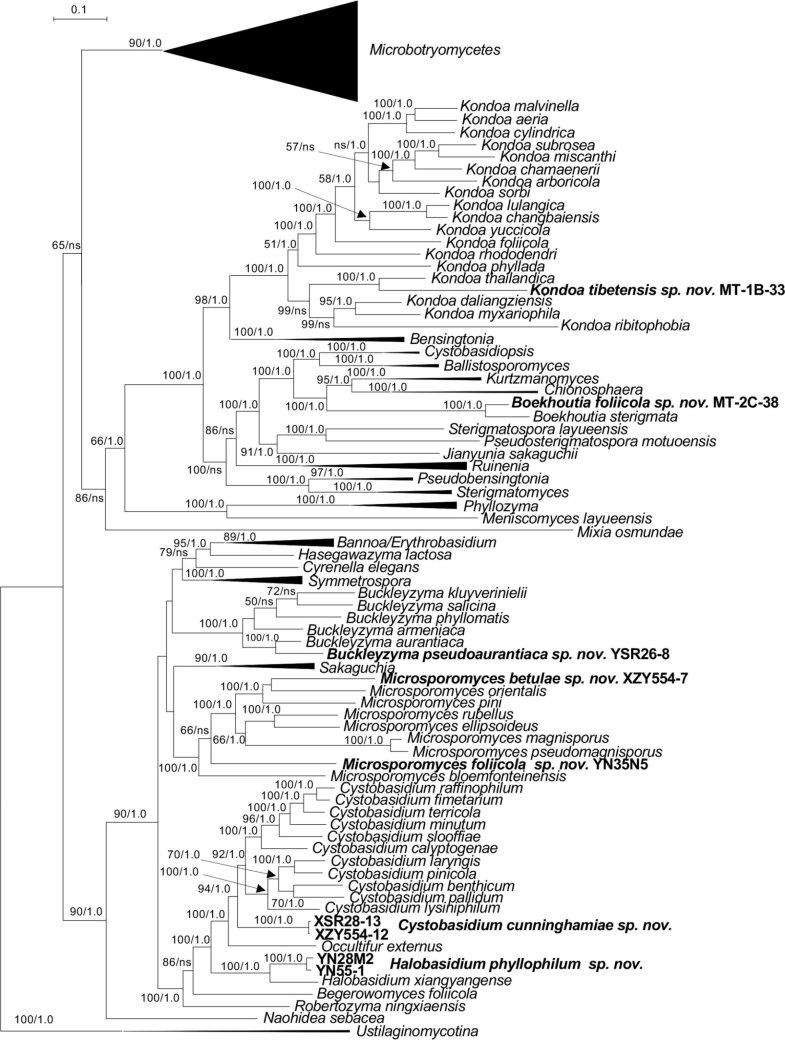
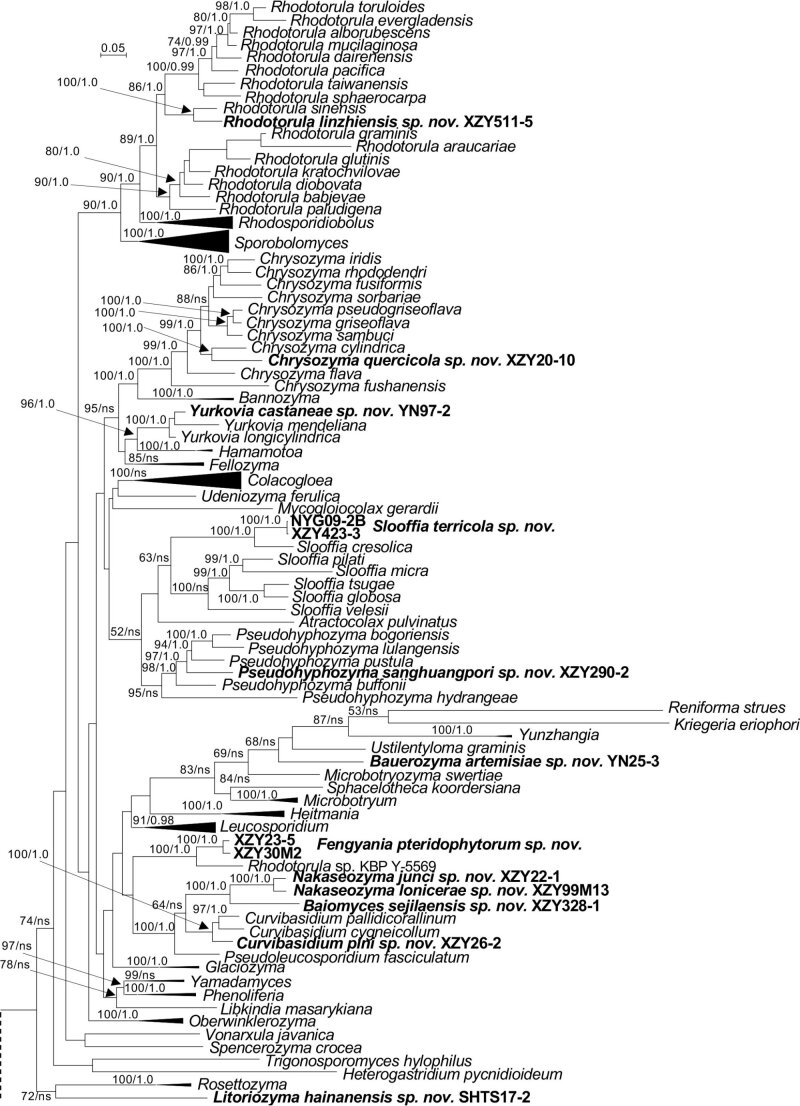
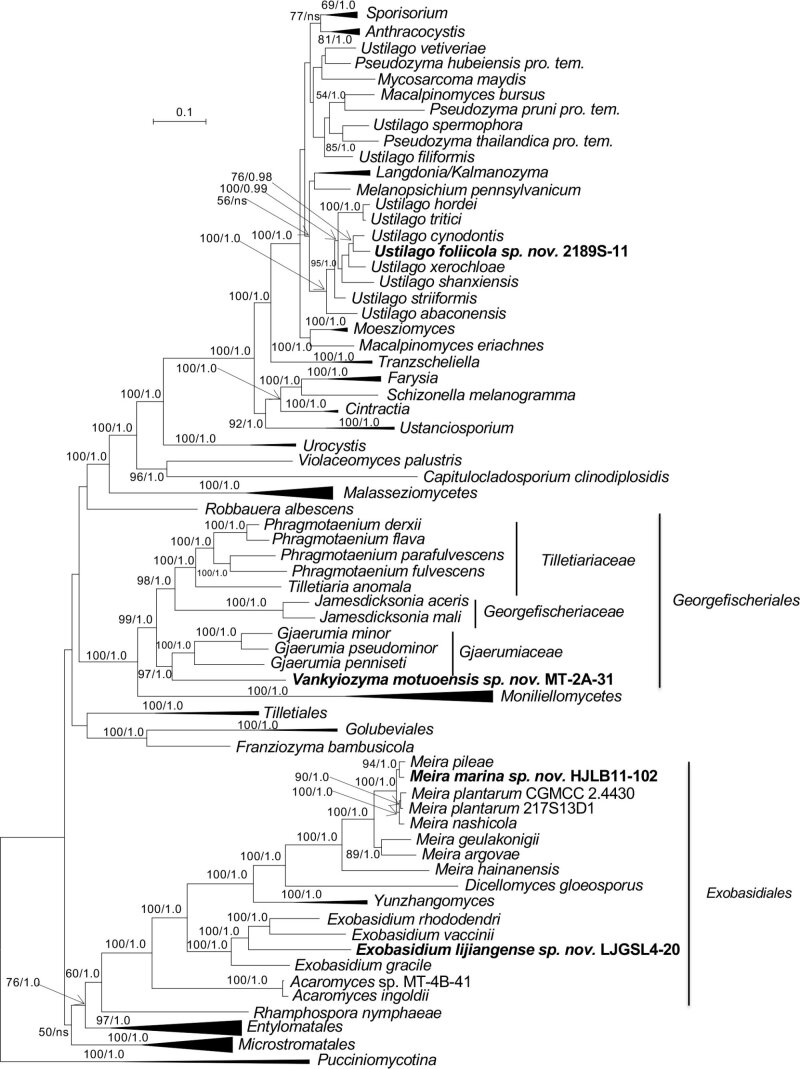
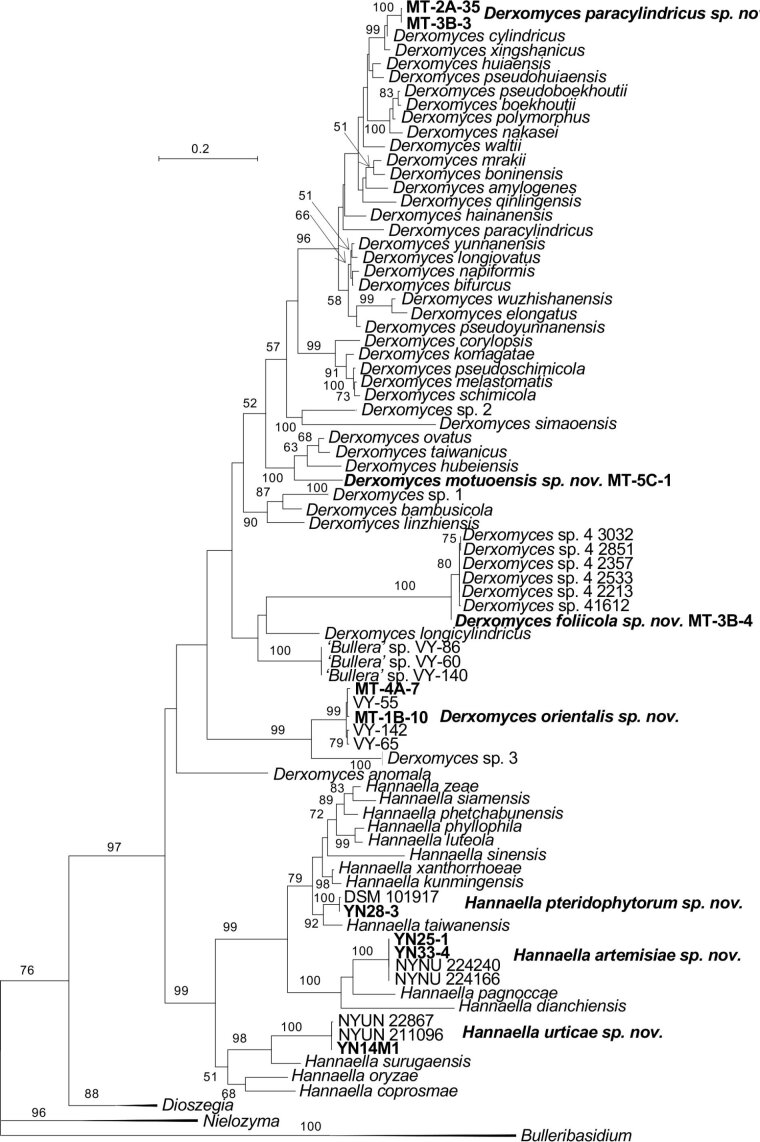
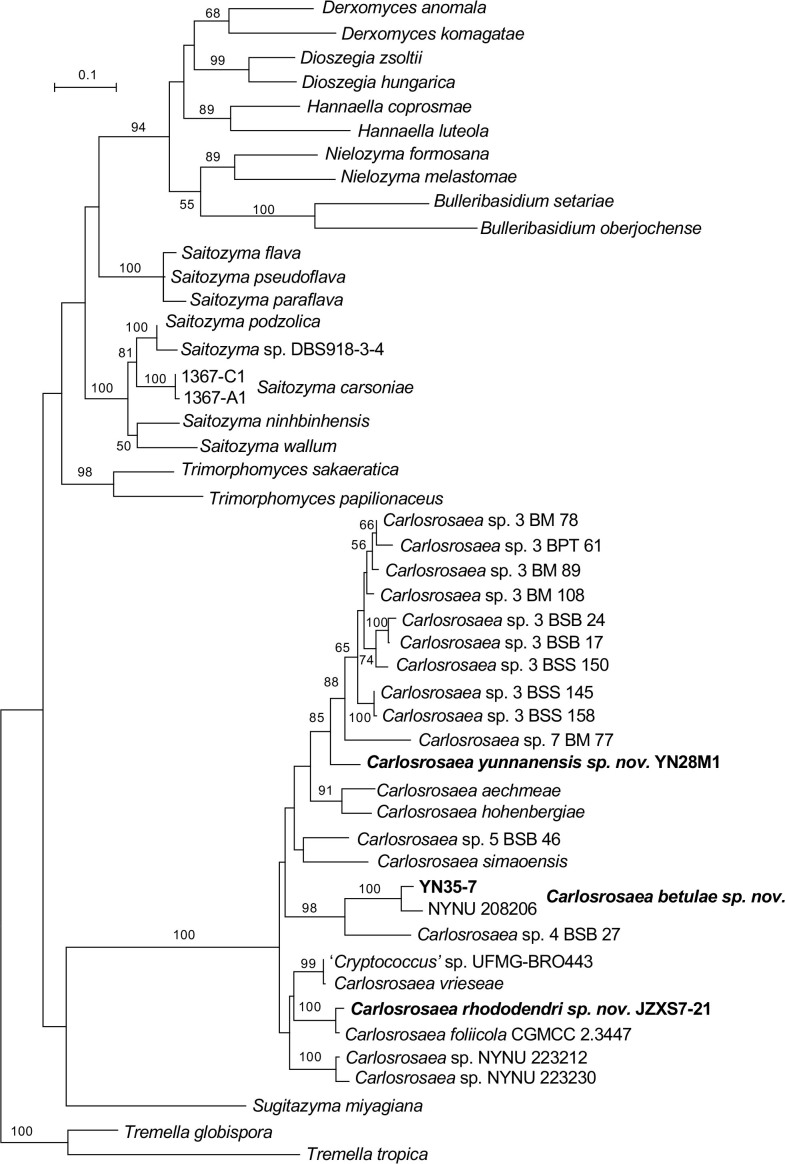
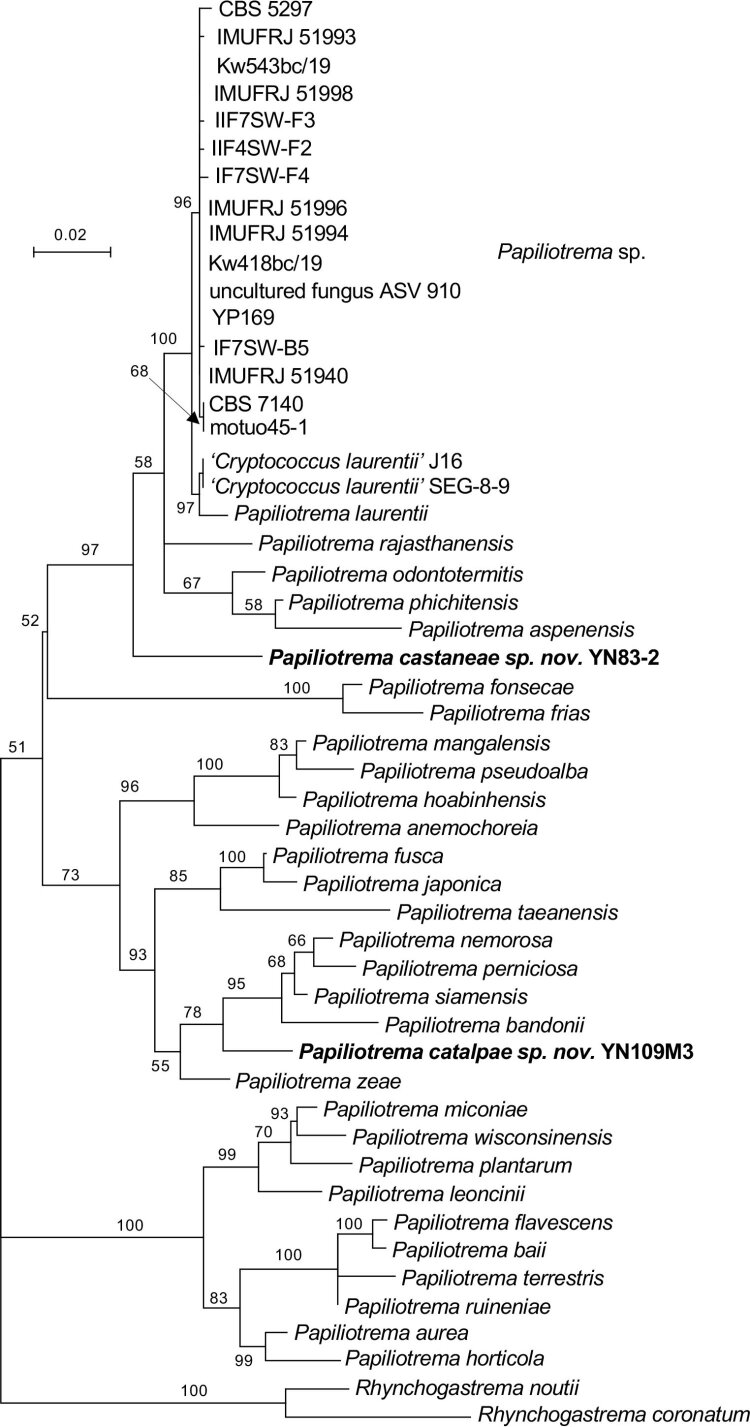
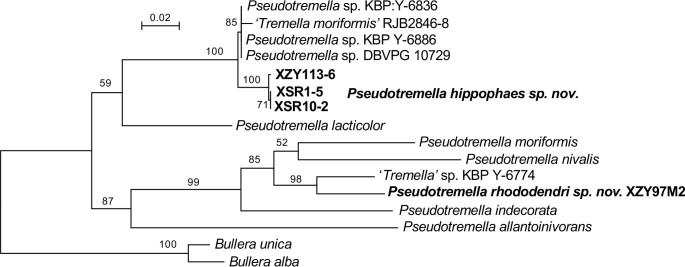
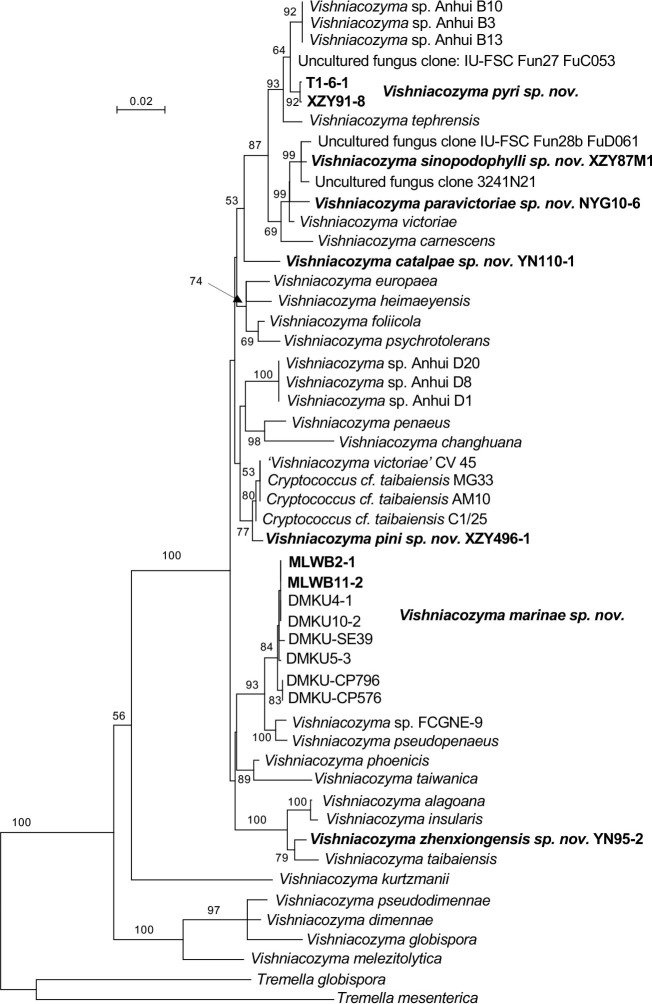
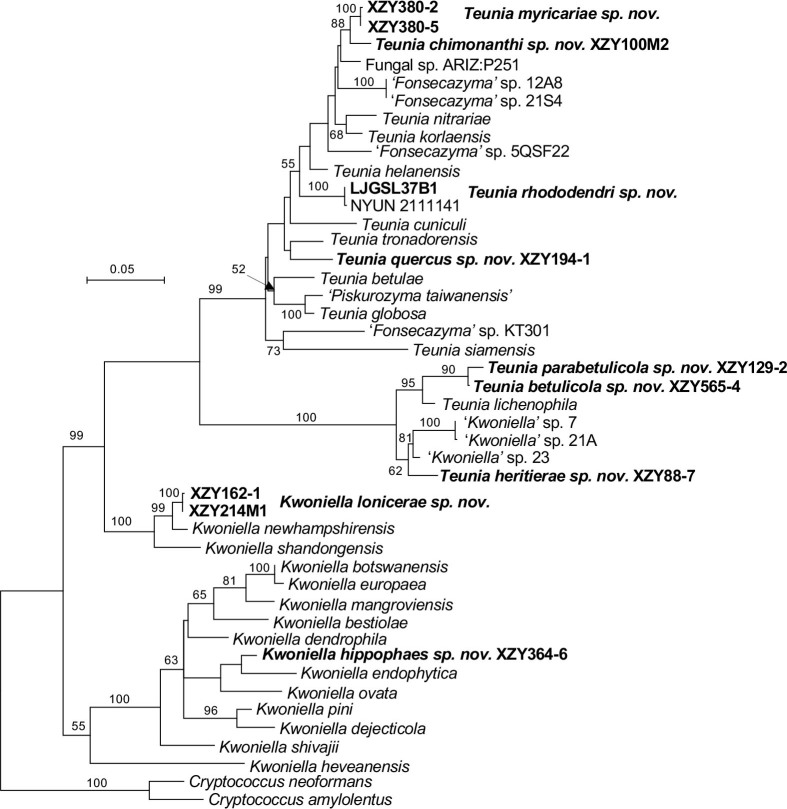
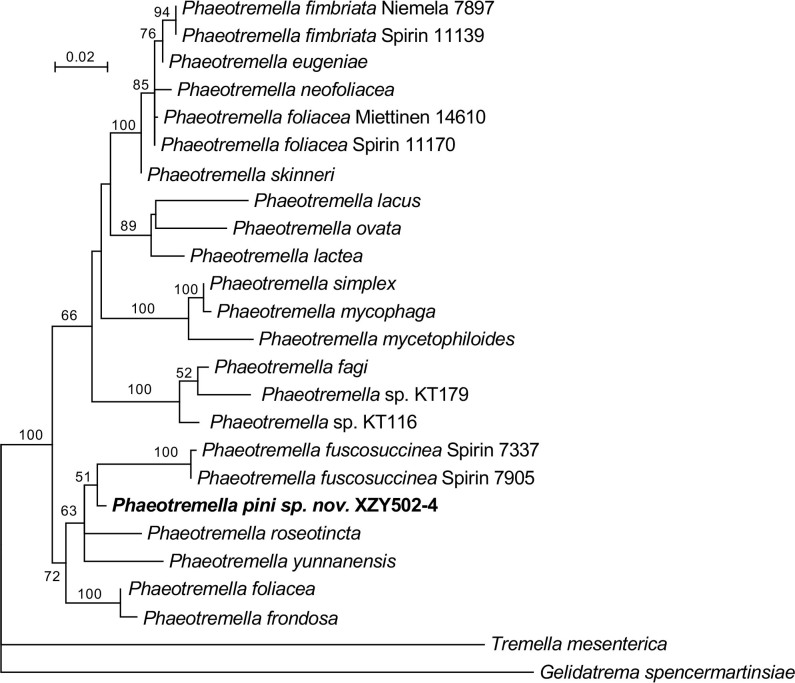
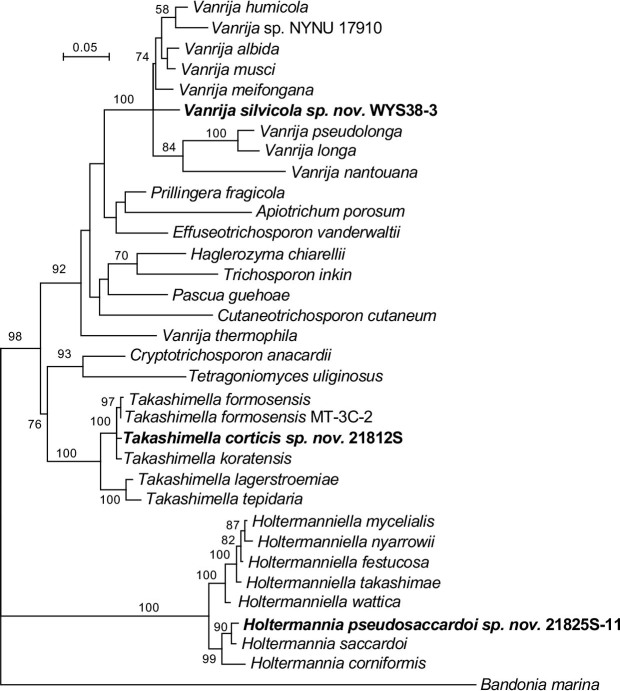
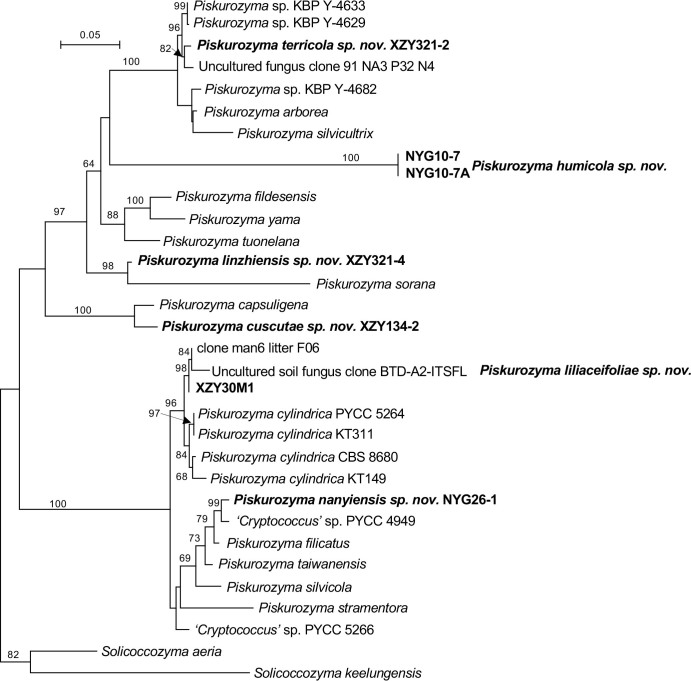
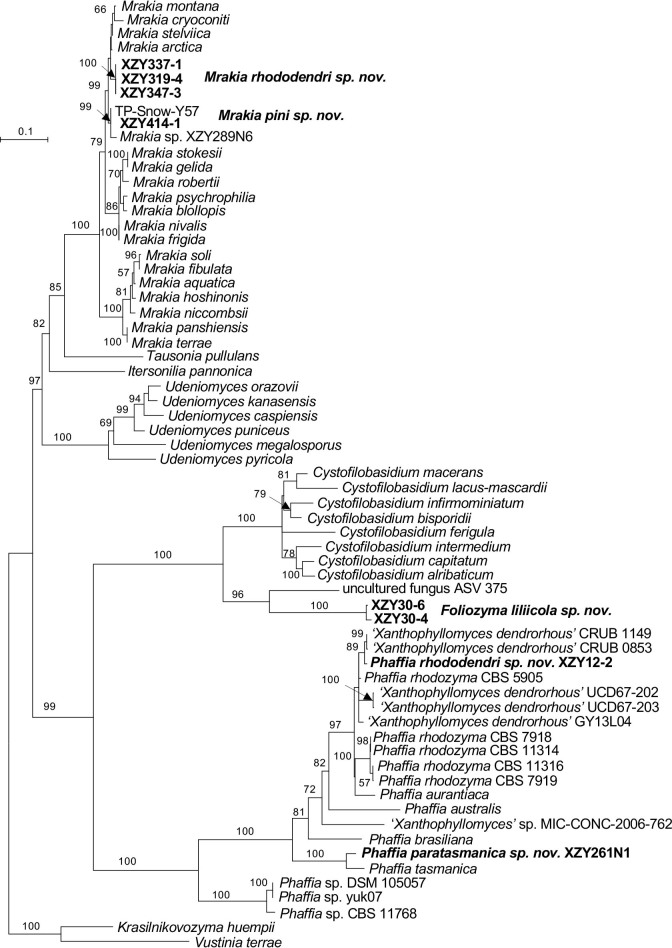
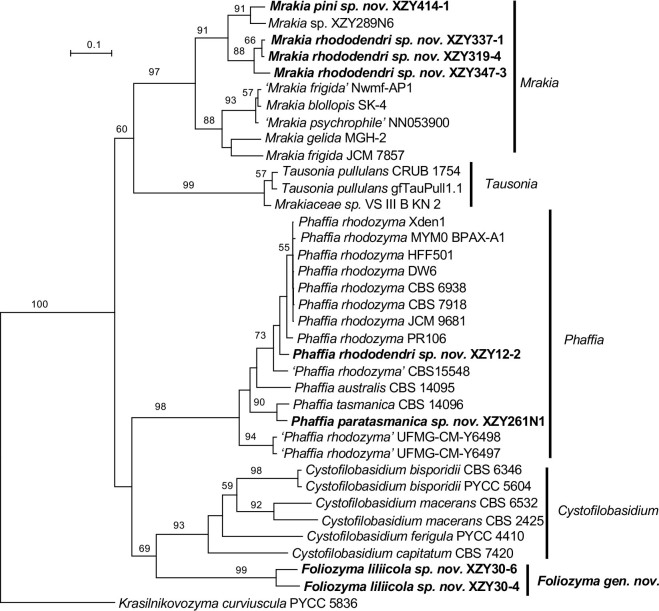
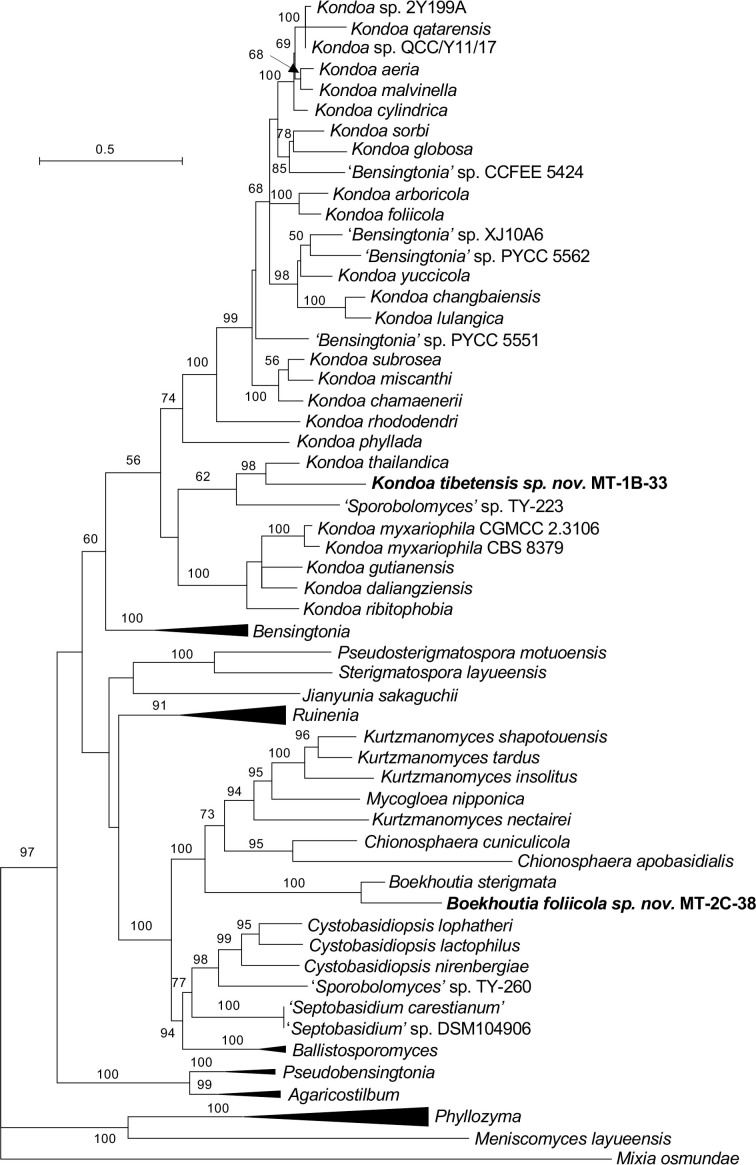
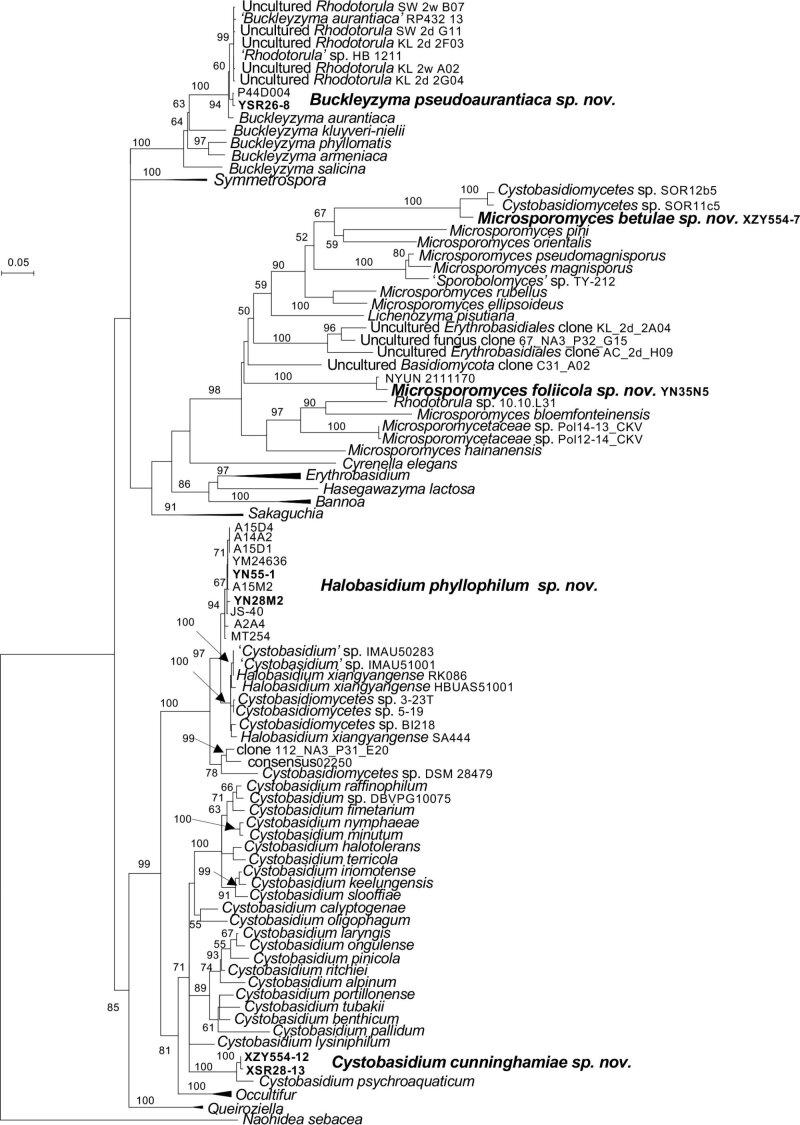
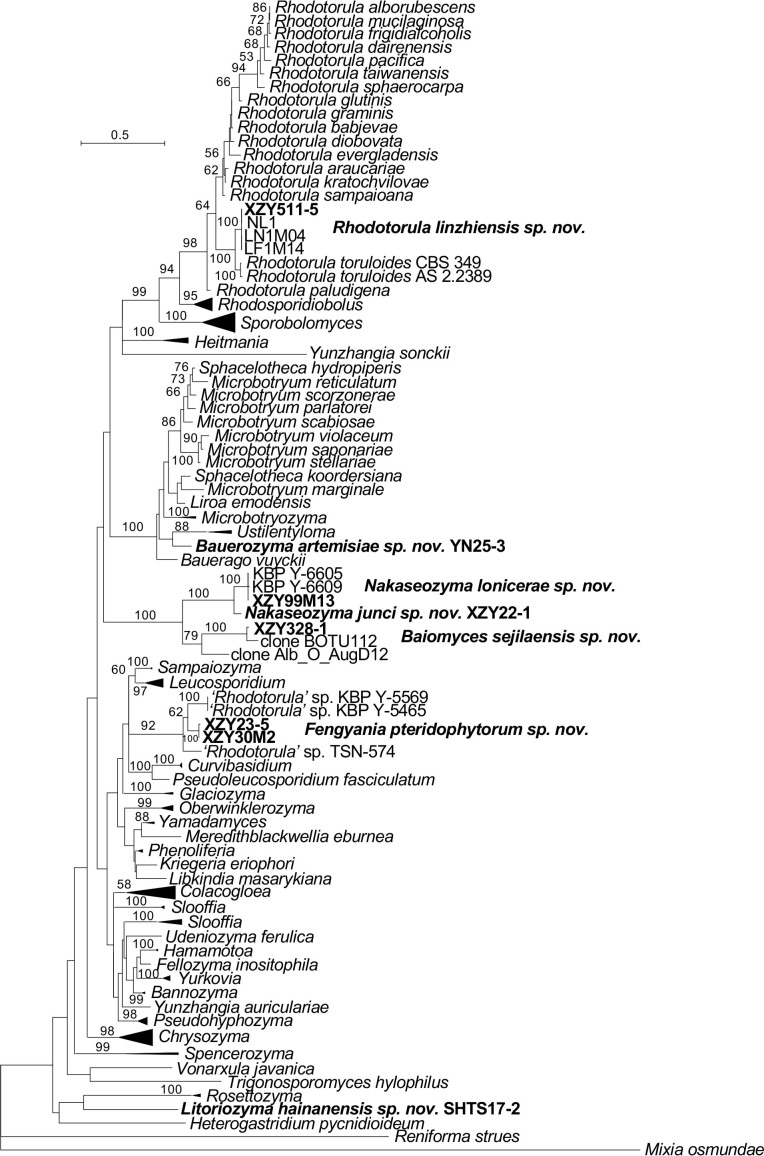
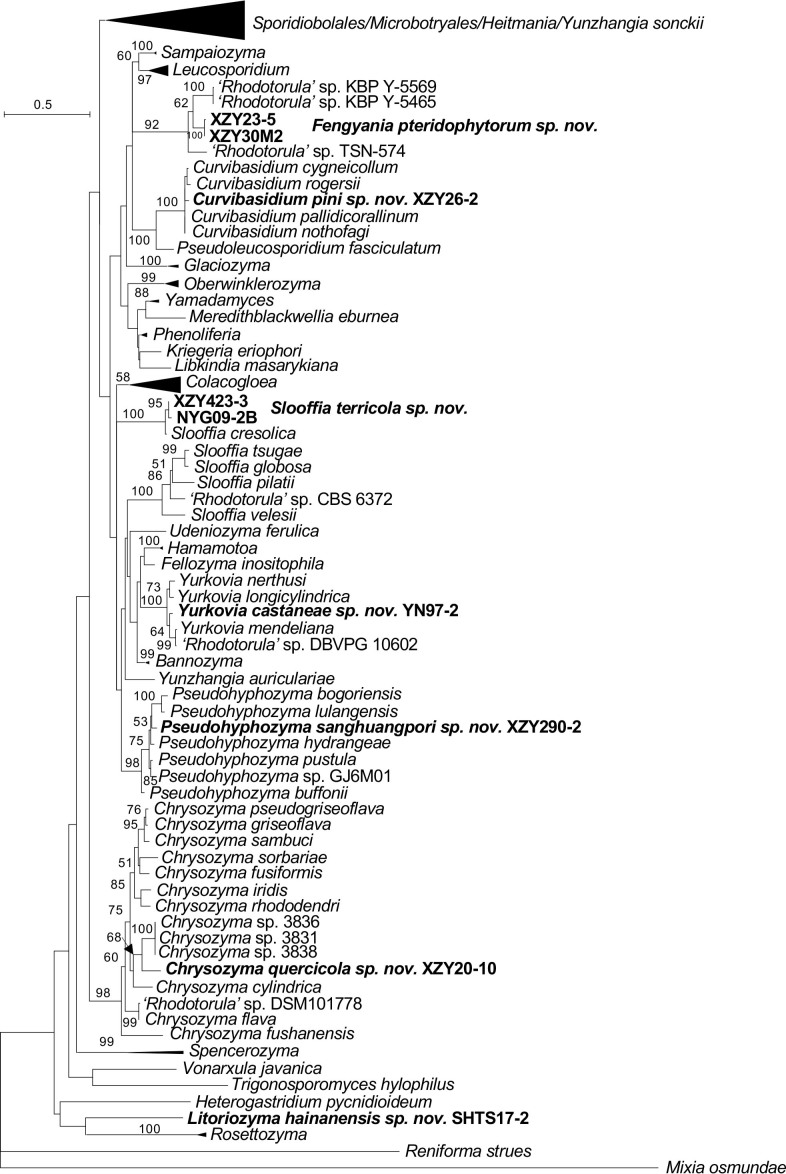
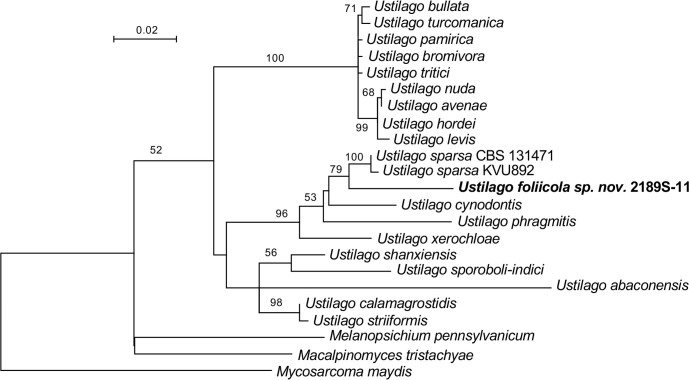
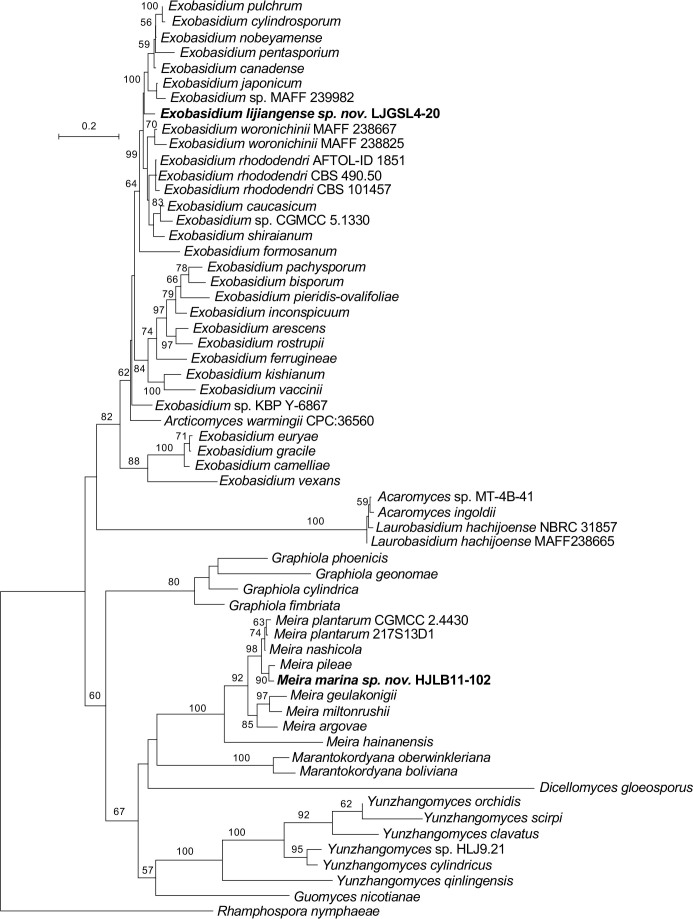
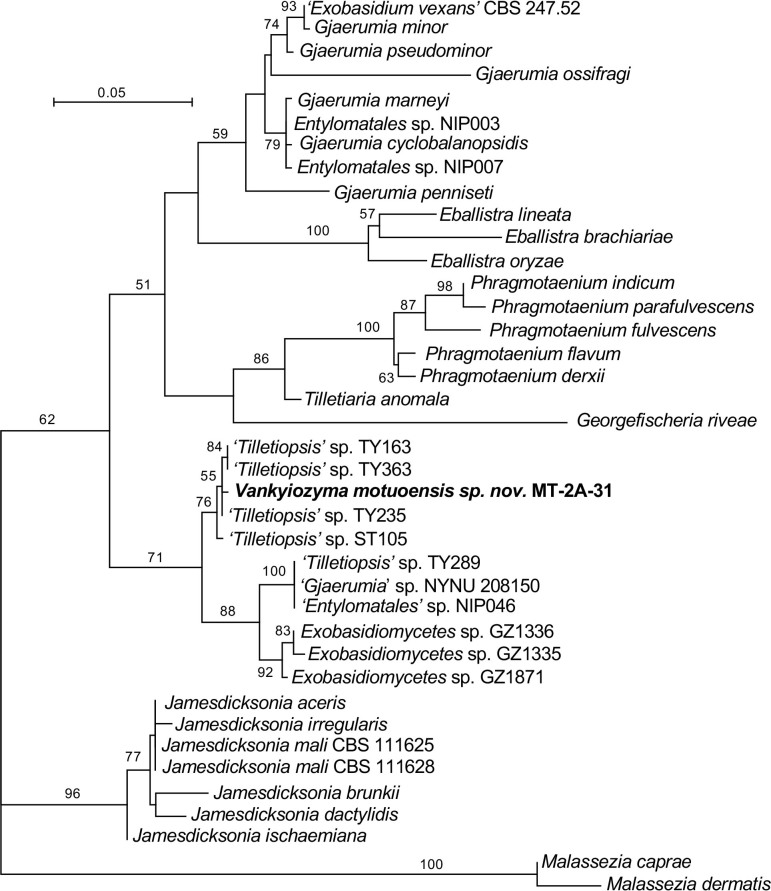
More than 2 000 yeast strains isolated from 1 200 samples mostly collected from Tibet and Yunnan provinces in China were identified as 462 species according to the internal transcribed spacer including the 5.8S rDNA (ITS) and the D1/D2 domains of the large subunit rDNA (LSU) sequence analyses. Among them, 70 new basidiomycetous yeast species were proposed based on the multi-locus phylogenetic analyses including the D1/D2 domains, the ITS, the small subunit rDNA (SSU), the largest subunit of RNA polymerase II (RPB1), the second largest subunit of RNA polymerase II (RPB2) and translation elongation factor 1-α (TEF1), as well as the phenotypic comparisons. The average nucleotide identity (ANI) analysis with the genomic metric was also used in the evaluation of the species delimitation for the genera Holtermannia, Mrakia and Takashimella that contain closely related species with low sequence heterogeneity in both ITS and D1/D2 regions. Forty-six new species belonged to 16 genera in the Agaricomycotina, 13 new species occurred in 12 genera in the Pucciniomycotina, three new species were distributed in three genera in the Ustilaginomycotina, and eight new species were classified in seven newly established genera. One new family was also proposed based on one of these new genera. The analyses revealed several inaccurate species names attributed to genomes deposited in GenBank, indicating the necessity of a more rigorous quality checks of the genomes deposited in the public databases. Taxonomic novelties: New family: Vankyiozymaceae Q.-M. Wang; New genera: Baiomyces Q.-M. Wang, Bauerozyma Q.-M. Wang, Fengyania Q.-M. Wang, Foliozyma Q.-M. Wang, Litoriozyma Q.-M. Wang, Nakaseozyma Q.-M. Wang, Vankyiozyma Q.-M. Wang; New species: Baiomyces sejilaensis Q.-M. Wang, Bauerozyma artemisiae Q.-M. Wang, Boekhoutia foliicola Q.-M. Wang, Buckleyzyma pseudoaurantiaca Q.-M. Wang, Carlosrosaea betulae Q.-M. Wang, Carlosrosaea rhododendri Q.-M. Wang, Carlosrosaea yunnanensis Q.-M. Wang, Chrysozyma quercicola Q.-M. Wang, Curvibasidium pini Q.-M. Wang, Cystobasidium cunninghamiae Q.-M. Wang, Derxomyces foliicola Q.-M. Wang, Derxomyces motuoensis Q.-M. Wang, Derxomyces orientalis Q.-M. Wang, Derxomyces paracylindricus Q.-M. Wang, Exobasidium lijiangense Q.-M. Wang, Fengyania pteridophytorum Q.-M. Wang, Foliozyma liliicola Q.-M. Wang, Halobasidium phyllophilum Q.-M. Wang, Hannaella artemisiae Q.-M. Wang, Hannaella pteridophytorum Q.-M. Wang, Hannaella urticae Q.-M. Wang, Holtermannia pseudosaccardoi Q.-M. Wang, Kockovaella cariosiligni Q.-M. Wang, Kockovaella foliicola Q.-M. Wang, Kondoa tibetensis Q.-M. Wang, Kwoniella hippophaes Q.-M. Wang, Kwoniella lonicerae Q.-M. Wang, Litoriozyma hainanensis Q.-M. Wang, Meira marina Q.-M. Wang, Microsporomyces betulae Q.-M. Wang, Microsporomyces foliicola Q.-M. Wang, Mrakia pini Q.-M. Wang, Mrakia rhododendri Q.-M. Wang, Nakaseozyma junci Q.-M.Wang, Nakaseozyma lonicerae Q.-M. Wang, Papiliotrema castaneae Q.-M. Wang, Papiliotrema catalpae Q.-M. Wang, Phaeotremella pini Q.-M. Wang, Phaffia paratasmanica Q.-M. Wang, Phaffia rhododendri Q.-M. Wang, Piskurozyma cuscutae Q.-M. Wang, Piskurozyma humicola Q.-M. Wang, Piskurozyma liliaceifoliae Q.-M. Wang, Piskurozyma linzhiensis Q.-M. Wang, Piskurozyma nanyiensis Q.-M. Wang, Piskurozyma terricola Q.-M. Wang, Pseudohyphozyma sanghuangpori Q.-M. Wang, Pseudotremella hippophaes Q.-M. Wang, Pseudotremella rhododendri Q.-M. Wang, Rhodotorula linzhiensis Q.-M. Wang, Slooffia terricola Q.-M. Wang, Takashimella corticis Q.-M. Wang, Teunia betulicola Q.-M. Wang, Teunia chimonanthi Q.-M. Wang, Teunia heritierae Q.-M. Wang, Teunia myricariae Q.-M. Wang, Teunia parabetulicola Q.-M. Wang, Teunia quercus Q.-M. Wang, Teunia rhododendri Q.-M. Wang, Ustilago foliicola Q.-M. Wang, Vankyiozyma motuoensis Q.-M. Wang, Vanrija silvicola Q.-M. Wang, Vishniacozyma catalpae Q.-M. Wang, Vishniacozyma marinae Q.-M. Wang, Vishniacozyma paravictoriae Q.-M. Wang, Vishniacozyma pini Q.-M. Wang, Vishniacozyma pyri Q.-M. Wang, Vishniacozyma sinopodophylli Q.-M. Wang, Vishniacozyma zhenxiongensis Q.-M. Wang, Yurkovia castaneae Q.-M. Wang. Citation: Jiang Y-L, Bao W-J, Liu F, Wang G-S, Yurkov AM, Ma Q, Hu Z-D, Chen X-H, Zhao W-N, Li A-H, Wang Q-M (2024). Proposal of one new family, seven new genera and seventy new basidiomycetous yeast species mostly isolated from Tibet and Yunnan provinces, China. Studies in Mycology 109: 57-153. doi: 10.3114/sim.2024.109.02.

Keywords: Average nucleotide identity (ANI); basidiomycetous yeasts; genomic metrics; molecular phylogeny; seventy-eight new taxa.


Conflict of interest statement

The authors declare that there is no conflict of interest.

Figures

Fig. 1
Fig. 1
Localisation of sampling sites in China.
Fig. 2
Fig. 2
Phylogenetic tree inferred using the combined sequences of SSU rDNA, ITS (including 5.8S rDNA), LSU rDNA D1/D2 domains, RPB1, RPB2 and TEF1, depicting the phylogenetic positions of new taxa (in bold) within Agaricomycotina. The tree backbone was constructed using maximum likelihood analysis. Bootstrap percentages of maximum likelihood analysis over 50 % from 1 000 bootstrap replicates and posterior probabilities of Bayesian inference above 0.9 are shown respectively from left to right on the deep and major branches. Scale bar represents 0.1 substitutions per nucleotide position. Note: ns, not supported (BP < 50 % or PP < 0.9).
Fig. 2
Fig. 2
Phylogenetic tree inferred using the combined sequences of SSU rDNA, ITS (including 5.8S rDNA), LSU rDNA D1/D2 domains, RPB1, RPB2 and TEF1, depicting the phylogenetic positions of new taxa (in bold) within Agaricomycotina. The tree backbone was constructed using maximum likelihood analysis. Bootstrap percentages of maximum likelihood analysis over 50 % from 1 000 bootstrap replicates and posterior probabilities of Bayesian inference above 0.9 are shown respectively from left to right on the deep and major branches. Scale bar represents 0.1 substitutions per nucleotide position. Note: ns, not supported (BP < 50 % or PP < 0.9).
Fig. 3
Fig. 3
Phylogenetic tree inferred using the combined sequences of SSU rDNA, ITS (including 5.8S rDNA), LSU rDNA D1/D2 domains, RPB1, RPB2 and TEF1, depicting the phylogenetic positions of new taxa (in bold) within Pucciniomycotina. The tree backbone was constructed using maximum likelihood analysis. Bootstrap percentages of maximum likelihood analysis over 50 % from 1 000 bootstrap replicates and posterior probabilities of Bayesian inference above 0.9 are shown respectively from left to right on the deep and major branches. Scale bar represents 0.1 substitutions per nucleotide position. Note: ns, not supported (BP < 50 % or PP < 0.9).
Fig. 3
Fig. 3
Phylogenetic tree inferred using the combined sequences of SSU rDNA, ITS (including 5.8S rDNA), LSU rDNA D1/D2 domains, RPB1, RPB2 and TEF1, depicting the phylogenetic positions of new taxa (in bold) within Pucciniomycotina. The tree backbone was constructed using maximum likelihood analysis. Bootstrap percentages of maximum likelihood analysis over 50 % from 1 000 bootstrap replicates and posterior probabilities of Bayesian inference above 0.9 are shown respectively from left to right on the deep and major branches. Scale bar represents 0.1 substitutions per nucleotide position. Note: ns, not supported (BP < 50 % or PP < 0.9).
Fig. 4
Fig. 4
Phylogenetic tree inferred using the combined sequences of SSU rDNA, ITS (including 5.8S rDNA), LSU rDNA D1/D2 domains, RPB1, RPB2 and TEF1, depicting the phylogenetic positions of new taxa (in bold) within Ustilaginomycotina. The tree backbone was constructed using maximum likelihood analysis. Bootstrap percentages of maximum likelihood analysis over 50 % from 1 000 bootstrap replicates and posterior probabilities of Bayesian inference above 0.9 are shown respectively from left to right on the deep and major branches. Bar = 0.1 substitutions per nucleotide position. Note: ns, not supported (BP < 50 % or PP < 0.9).
Fig. 5
Fig. 5
Phylogeny of new taxa (in bold) in the Bulleribasidiaceae (Tremellales, Tremellomycetes, Agaricomycotina) inferred from the combined sequences of the LSU rDNA D1/D2 domains and ITS region (including 5.8S rDNA) by maximum likelihood analysis and over 50 % from 1 000 bootstrap replicates is shown. Scale bar represents 0.2 substitutions per nucleotide position.
Fig. 6
Fig. 6
Phylogeny of new taxa (in bold) in the Trimorphomycetaceae (Tremellales, Tremellomycetes, Agaricomycotina) inferred from the combined sequences of the LSU rDNA D1/D2 domains and ITS region (including 5.8S rDNA) by maximum likelihood analysis and over 50 % from 1 000 bootstrap replicates is shown. Scale bar represents 0.1 substitutions per nucleotide position.
Fig. 7
Fig. 7
Phylogeny of new taxa (in bold) in the Rhynchogastremaceae (Tremellales, Tremellomycetes, Agaricomycotina) inferred from the combined sequences of the LSU rDNA D1/D2 domains and ITS region (including 5.8S rDNA) by maximum likelihood analysis and over 50 % from 1 000 bootstrap replicates is shown. Scale bar represents 0.02 substitutions per nucleotide position.
Fig. 8
Fig. 8
Phylogeny of new taxa (in bold) in the Bulleraceae (Tremellales, Tremellomycetes, Agaricomycotina) inferred from the combined sequences of the LSU rDNA D1/D2 domains and ITS region (including 5.8S rDNA) by maximum likelihood analysis and over 50 % from 1 000 bootstrap replicates is shown. Scale bar represents 0.02 substitutions per nucleotide position.
Fig. 9
Fig. 9
Phylogeny of new taxa (in bold) in the Vishniacozyma (Bulleribasidiaceae, Tremellales, Tremellomycetes, Agaricomycotina) inferred from the combined sequences of the LSU rDNA D1/D2 domains and ITS region (including 5.8S rDNA) by maximum likelihood analysis and over 50 % from 1 000 bootstrap replicates is shown. Scale bar represents 0.02 substitutions per nucleotide position.
Fig. 10
Fig. 10
Phylogeny of new taxa (in bold) in the Cryptococcaceae (Tremellales, Tremellomycetes, Agaricomycotina) inferred from the combined sequences of the LSU rDNA D1/D2 domains and ITS region (including 5.8S rDNA) by maximum likelihood analysis and over 50 % from 1 000 bootstrap replicates is shown. Scale bar represents 0.05 substitutions per nucleotide position.
Fig. 11
Fig. 11
Phylogeny of new taxa (in bold) in the Phaeotremella (Phaeotremellaceae, Tremellales, Tremellomycetes, Agaricomycotina) inferred from the combined sequences of the LSU rDNA D1/D2 domains and ITS region (including 5.8S rDNA) by maximum likelihood analysis and over 50 % from 1 000 bootstrap replicates is shown. Scale bar represents 0.2 substitutions per nucleotide position.
Fig. 12
Fig. 12
Phylogeny of new taxa (in bold) in the Trichosporonales and Holtermanniales (Tremellomycetes, Agaricomycotina) inferred from the combined sequences of the LSU rDNA D1/D2 domains and ITS region (including 5.8S rDNA) by maximum likelihood analysis and over 50 % from 1 000 bootstrap replicates is shown. Scale bar represents 0.05 substitutions per nucleotide position.
Fig. 13
Fig. 13
Phylogeny of new taxa (in bold) in the Piskurozyma (Piskurozymaceae, Filobasidiales, Tremellomycetes, Agaricomycotina) inferred from the combined sequences of the LSU rDNA D1/D2 domains and ITS region (including 5.8S rDNA) by maximum likelihood analysis and over 50 % from 1 000 bootstrap replicates is shown. Scale bar represents 0.05 substitutions per nucleotide position.
Fig. 14
Fig. 14
Phylogeny of new taxa (in bold) in the Mrakiaceae (Cystofilobasidiales, Tremellomycetes, Agaricomycotina) inferred from the combined sequences of the LSU rDNA D1/D2 domains and ITS region (including 5.8S rDNA) by maximum likelihood analysis and over 50 % from 1 000 bootstrap replicates is shown. Scale bar represents 0.1 substitutions per nucleotide position.
Fig. 15
Fig. 15
Phylogenomic analysis of new taxa (in bold) in Cystofilobasidiales (Tremellomycetes, Agaricomycotina) inferred from the combined 1 341 single-copy genes by maximum likelihood analysis and over 50 % from 1 000 bootstrap replicates is shown. Scale bar represents 0.1 substitutions per nucleotide position.
Fig. 16
Fig. 16
Phylogeny of new taxa (in bold) in the Agaricostilbomycetes (Pucciniomycotina) inferred from the combined sequences of the LSU rDNA D1/D2 domains and ITS region (including 5.8S rDNA) by maximum likelihood analysis and over 50 % from 1 000 bootstrap replicates is shown. Scale bar represents 0.5 substitutions per nucleotide position.
Fig. 17
Fig. 17
Phylogeny of new taxa (in bold) in the Cystobasidiomycetes (Pucciniomycotina) inferred from the combined sequences of the LSU rDNA D1/D2 domains and ITS region (including 5.8S rDNA) by maximum likelihood analysis and over 50 % from 1 000 bootstrap replicates is shown. Scale bar represents 0.05 substitutions per nucleotide position.
Fig. 18
Fig. 18
Phylogeny of new taxa (in bold) in the Microbotryomycetes (Pucciniomycotina) inferred from the combined sequences of the LSU rDNA D1/D2 domains and ITS region (including 5.8S rDNA) by maximum likelihood analysis and over 50 % from 1 000 bootstrap replicates is shown. Scale bar represents 0.5 substitutions per nucleotide position.
Fig. 18
Fig. 18
Phylogeny of new taxa (in bold) in the Microbotryomycetes (Pucciniomycotina) inferred from the combined sequences of the LSU rDNA D1/D2 domains and ITS region (including 5.8S rDNA) by maximum likelihood analysis and over 50 % from 1 000 bootstrap replicates is shown. Scale bar represents 0.5 substitutions per nucleotide position.
Fig. 19
Fig. 19
Phylogeny of new taxa (in bold) in the Ustilago (Ustilaginaceae, Ustilaginales, Ustilaginomycetes, Ustialginomycotina) inferred from the combined sequences of the LSU rDNA D1/D2 domains and ITS region (including 5.8S rDNA) by maximum likelihood analysis and over 50 % from 1 000 bootstrap replicates is shown. Scale bar represents 0.02 substitutions per nucleotide position.
Fig. 20
Fig. 20
Phylogeny of new taxa (in bold) in the Exobasidiales (Exobasidiomycetes, Ustialginomycotina) inferred from the combined sequences of the LSU rDNA D1/D2 domains and ITS region (including 5.8S rDNA) by maximum likelihood analysis and over 50 % from 1 000 bootstrap replicates is shown. Scale bar represents 0.2 substitutions per nucleotide position.
Fig. 21
Fig. 21
Phylogeny of new taxa (in bold) in the Georgefischeriales (Exobasidiomycetes, Ustialginomycotina) inferred from the sequences of the LSU rDNA D1/D2 domains by maximum likelihood analysis and over 50 % from 1 000 bootstrap replicates is shown. Scale bar represents 0.05 substitutions per nucleotide position.
Fig. 22
Fig. 22
The streak culture grown in YM agar, vegetative cells grown in YM broth for 7 d at 17 °C, and ballistoconidia produced on corn meal agar after 7 d at 17 °C. A–C. Der. paracylindricus CGMCC 2.6875T. D–F. Der. motuoensis CGMCC 2.6874T. G–I. Der. orientalis CGMCC 2.6871T. J–L. Der. foliicola CGMCC 2.6872T. Scale bars = 10 μm.
Fig. 23
Fig. 23
The streak culture grown in YM agar and vegetative cells grown in YM broth for 7 d at 17 °C. A, B. Han. pteridophytorum CGMCC 2.6903T. C, D. Han. artemisiae CGMCC 2.6904T. E, F. Han. urticae CGMCC 2.6905T. G, H. Car. rhododendri CGMCC 2.6895T. Scale bars = 10 μm.
Fig. 24
Fig. 24
The streak culture grown in YM agar, vegetative cells grown in YM broth for 7 d at 17 °C, and ballistoconidia produced on corn meal agar after 7 d at 17 °C. A, B. Car. yunnanensis CGMCC 2.6913T. C, D. Car. betulae CGMCC 2.6900T. E–G. Koc. foliicola CGMCC 2.6867T. H–J. Koc. cariosiligni CGMCC 2.6892T. Scale bars = 10 μm.
Fig. 25
Fig. 25
The streak culture grown in YM agar and vegetative cells grown in YM broth for 7 d at 17 °C. A, B. Papi. catalpae CGMCC 2.6897T. C, D. Papi. castaneae CGMCC 2.6898T. E, F. Pse. hippophaes CGMCC 2.6838T. G, H. Pse. rhododendri CGMCC 2.6854T. Scale bars = 10 μm.
Fig. 26
Fig. 26
The streak culture grown in YM agar and vegetative cells grown in YM broth for 7 d at 17 °C. A, B. Vis. sinopodophylli CGMCC 2.6857T. C, D. Vis. paravictoriae CGMCC 2.6918T. E, F. Vis. pyri CGMCC 2.6870T. G, H. Vis. catalpae CGMCC 2.6902T. Scale bars = 10 μm.
Fig. 27
Fig. 27
The streak culture grown in YM agar and vegetative cells grown in YM broth for 7 d at 17 °C. A, B. Vis. marinae CGMCC 2.6837T. C, D. Vis. pini CGMCC 2.6849T. E, F. Vis. zhenxiongensis CGMCC 2.6901T. G, H. Teu. myricariae CGMCC 2.6846T. Scale bars = 10 μm.
Fig. 28
Fig. 28
The streak culture grown in YM agar and vegetative cells grown in YM broth for 7 d at 17 °C. A, B. Teu. chimonanthi CGMCC 2.6916T. C, D. Teu. rhododendri CGMCC 2.6896T. E, F. Teu. quercus. G, H. Teu. heritierae CGMCC 2.6856T. Scale bars = 10 μm.
Fig. 29
Fig. 29
The streak culture grown in YM agar and vegetative cells grown in YM broth for 7 d at 17 °C. A, B. Teu. betulicola CGMCC 2.7195T. C, D. Teu. parabetulicola CGMCC 2.6852T. E, F. Kwo. hippophaes CGMCC 2.6893T. G, H. Kwo. lonicerae CGMCC 2.6883T. Scale bars = 10 μm.
Fig. 30
Fig. 30
Vegetative cells grown in YM broth for 7 d at 17 °C, the streak culture grown in YM agar and ballistoconidia produced on corn meal agar after 7 d at 17 °C. A, B. Pha. pini CGMCC 2.6848T. C, D. Van. silvicola CGMCC 2.4340T. E, F. Tak. corticis CGMCC 2.6836T. G–I. Hol. pseudosaccardoi CGMCC 2.6835T. Scale bars = 10 μm.
Fig. 31
Fig. 31
The streak culture grown in YM agar and vegetative cells grown in YM broth for 7 d at 17 °C. A, B. Pis. terricola CGMCC 2.6888T. C, D. Pis. linzhiensis CGMCC 2.6919T. E, F. Pis. humicola CGMCC 2.6879T. G, H. Pis. liliaceifoliae CGMCC 2.6862T. Scale bars = 10 μm.
Fig. 32
Fig. 32
The streak culture grown in YM agar and vegetative cells grown in YM broth for 7 d at 17 °C. A, B. Pis. nanyiensis CGMCC 2.6880T. C, D. Pis. cuscutae CGMCC 2.6853T. E, F. Mra. rhododendri CGMCC 2.6914T. G, H. Mra. pini CGMCC 2.6847T. Scale bars = 10 μm.
Fig. 33
Fig. 33
The streak culture grown in YM agar and vegetative cells grown in YM broth for 7 d at 17 °C. A–C. Fol. liliicola CGMCC 2.6861T. D, E. Phaf. rhododendri CGMCC 2.6920T. F, G. Phaf. paratasmanica CGMCC 2.7159T. H, I. Kon. tibetensis CGMCC 2.6877T. Scale bars: B, E, G, I = 10 μm; C = 5 μm.
Fig. 34
Fig. 34
The streak culture grown in YM agar and vegetative cells grown in YM broth for 7 d at 17 °C. A, B. Boe. foliicola CGMCC 2.6878T. C, D. Buc. pseudoaurantiaca CGMCC 2.6834T. E, F. Mic. betulae CGMCC 2.6850T. G, H. Mic. foliicola CGMCC 2.6907T. Scale bars = 10 μm.
Fig. 35
Fig. 35
The streak culture grown in YM agar and vegetative cells grown in YM broth for 7 d at 17 °C. A, B. Hal. phyllophilum CGMCC 2.6906T. C, D. Cys. cunninghamiae CGMCC 2.6841T. E, F. Rho. linzhiensis CGMCC 2.6911T. G–I. Bau. artemisiae CGMCC 2.6908T. Scale bars: B, D, F, H = 10 μm; I = 5 μm.
Fig. 36
Fig. 36
The streak culture grown in YM agar and vegetative cells grown in YM broth for 7 d at 17 °C. A–C. Bai. sejilaensis CGMCC 2.6923T. D–F. Nak. lonicerae CGMCC 2.6922T. G, H. Nak. junci CGMCC 2.7158T. I– K. Fen. pteridophytorum CGMCC 2.6915T. Scale bars: B, E, H, J, K = 10 μm; C, F = 5 μm.
Fig. 37
Fig. 37
The streak culture grown in YM agar and vegetative cells grown in YM broth for 7 d at 17 °C. A, B. Cur. pini CGMCC 2.6865T. C, D. Chr. quercicola CGMCC 2.6863T. E, F. Yur. castaneae CGMCC 2.6909T. G, H. Pseu. sanghuangpori CGMCC 2.6891T. Scale bars = 10 μm.
Fig. 38
Fig. 38
The streak culture grown in YM agar and vegetative cells grown in YM broth for 7 d at 17 °C. A, B. Slo. terricola CGMCC 2.6882T. C–E. Lit. hainanensis CGMCC 2.6843T. F, G. Ust. foliicola CGMCC 2.6890T. H, I. Exo. lijiangense CGMCC 2.6921T. Scale bars: B, D, G, I = 10 μm; E = 5 μm.
Fig. 39
Fig. 39
The streak culture grown in YM agar and vegetative cells grown in YM broth for 7 d at 17 °C. A, B. Mei. marina CGMCC 2.6912T. C–E. Van. motuoensis CGMCC 2.6855T. Scale bars = 10 μm.

Similar articles

Cited by

References

    1. Bankevich A, Nurk S, Antipov D. et al. (2012). SPAdes: a new genome assembly algorithm and its applications to single-cell sequencing. Journal of Computational Biology 19: 455–477. - PMC - PubMed
    1. Begerow D, Kemler M, Feige A. et al. (2017). Parasitism in yeasts. In: Yeasts in natural ecosystems: Ecology. (Buzzini P, Lachance MA, Yurkov A, eds). Springer Cham; Switserland: 179–210.
    1. Belisle M, Mendenhall CD, Brenes FO. et al. (2014). Temporal variation in fungal communities associated with tropical hummingbirds and nectarivorous bats. Fungal Ecology 12: 44–51.
    1. Bing J, Han PJ, Liu WQ. et al. (2014). Evidence for a Far East Asian origin of lager beer yeast. Current Biology 24: R380–R381. - PubMed
    1. Boekhout T, Aime MC, Begerow D. et al. (2021). The evolving species concepts used for yeasts: from phenotypes and genomes to speciation networks. Fungal Diversity 109: 27–55. - PMC - PubMed

LinkOut - more resources