. 2024 Dec:109:155-272.
doi: 10.3114/sim.2024.109.03. Epub 2024 Jun 27.

Sporocadaceae revisited

Affiliations

Sporocadaceae revisited

P Razaghi et al. Stud Mycol. 2024 Dec.

Abstract

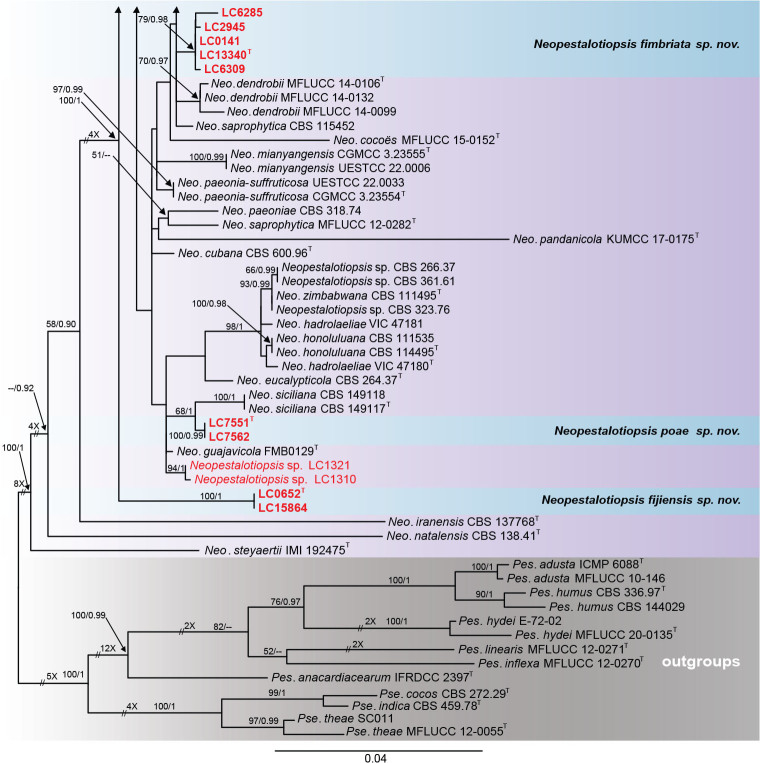
Sporocadaceae is a species-rich and cosmopolitan fungal family including species of plant pathogens, endophytes or saprobes, and parasites of humans and animals. The taxonomy of Sporocadaceae has recently been revised using a polyphasic approach. However, much remains unknown about the diversity of species and their host associations. A collection of 488 strains, mostly from China and associated with 129 host plant species, was studied based on morphological comparisons and multi-locus (LSU, ITS, tef-1α, tub2, and rpb2) phylogenies. Our results revealed that they belonged to 86 species, one new genus (Cavernicola gen. nov.) and seven known genera, including Discosia, Monochaetia, Neopestalotiopsis, Pestalotiopsis, Seimatosporium, Seiridium and Sporocadus. Of these, 43 new species and three new combinations (Dis. kaki, Mon. bulbophylli, and Neo. keteleeriae) are proposed in this paper. In addition, Neo. vaccinii, Pes. kaki and Pes. nanjingensis are synonymised under Neo. hispanica, Pes. menhaiensis and Pes. sichuanensis, respectively. We also corrected seven problematic sequences of type materials of previously published species, namely Neo. iranensis (tef-1α, ITS, tub2), Pes. jesteri (tef-1α), Pes. photinicola (ITS, tub2) and Pes. yunnanensis (ITS). Based on this study, Pestalotiopsis and Neopestalotiopsis are the most commonly detected genera within the Sporocadaceae family, associated with 84 and 70 plant species, respectively. Furthermore, considering the importance of Sporocadaceae and the fact that commonly used loci provide little valid information for species delimitation in this family, especially for Neopestalotiopsis and Pestalotiopsis, we initiated a phylogenomic project in this study. It will not only contribute to the knowledge of species boundaries but will also provide an important basis for evolutionary studies and research on secondary metabolites in Sporocadaceae. Taxonomic novelties: New genus: Cavernicola P. Razaghi, F. Liu & L. Cai. New species: Cavernicola guangxiensis P. Razaghi, F. Liu & L. Cai, Discosia ascidiata P. Razaghi, F. Liu & L. Cai, Discosia jiangxiensis P. Razaghi, F. Liu & L. Cai, Discosia navicularis P. Razaghi, F. Liu & L. Cai, Neopestalotiopsis ageratinae P. Razaghi, F. Liu & L. Cai, Neopestalotiopsis castanopsidis P. Razaghi, F. Liu & L. Cai, Neopestalotiopsis celtidis P. Razaghi, F. Liu, M. Raza & L. Cai, Neopestalotiopsis collariata P. Razaghi, F. Liu & L. Cai, Neopestalotiopsis dimorphospora P. Razaghi, F. Liu & L. Cai, Neopestalotiopsis dolichoconidiophora P. Razaghi, F. Liu & L. Cai, Neopestalotiopsis fijiensis P. Razaghi, F. Liu & L. Cai, Neopestalotiopsis fimbriata P. Razaghi, F. Liu & L. Cai, Neopestalotiopsis fuzhouensis P. Razaghi, F. Liu & L. Cai, Neopestalotiopsis guangxiensis P. Razaghi, F. Liu, M. Raza & L. Cai, Neopestalotiopsis guizhouensis P. Razaghi, F. Liu, M. Raza & L. Cai, Neopestalotiopsis jiangxiensis P. Razaghi, F. Liu & L. Cai, Neopestalotiopsis liquidambaris P. Razaghi, F. Liu & L. Cai, Neopestalotiopsis machili P. Razaghi, F. Liu & L. Cai, Neopestalotiopsis megabetaspora P. Razaghi, F. Liu, M. Raza & L. Cai, Neopestalotiopsis moniliformis P. Razaghi, F. Liu & L. Cai, Neopestalotiopsis nanningensis P. Razaghi, F. Liu, M. Raza & L. Cai, Neopestalotiopsis phyllostachydis P. Razaghi, F. Liu, M. Raza & L. Cai, Neopestalotiopsis poae P. Razaghi, F. Liu & L. Cai, Neopestalotiopsis smilacis P. Razaghi, F. Liu, M. Raza & L. Cai, Pestalotiopsis alloschemones P. Razaghi, F. Liu & L. Cai, Pestalotiopsis americana P. Razaghi, F. Liu & L. Cai, Pestalotiopsis biappendiculata P. Razaghi, F. Liu & L. Cai, Pestalotiopsis cratoxyli P. Razaghi, F. Liu, M. Raza & L. Cai, Pestalotiopsis exudata P. Razaghi, F. Liu & L. Cai, Pestalotiopsis fusiformis P. Razaghi, F. Liu & L. Cai, Pestalotiopsis ganzhouensis P. Razaghi, F. Liu & L. Cai, Pestalotiopsis leucospermi P. Razaghi, F. Liu & L. Cai, Pestalotiopsis lobata P. Razaghi, F. Liu & L. Cai, Pestalotiopsis machili P. Razaghi, F. Liu & L. Cai, Pestalotiopsis multiappendiculata P. Razaghi, F. Liu & L. Cai, Pestalotiopsis pruni P. Razaghi, F. Liu & L. Cai, Pestalotiopsis rubrae P. Razaghi, F. Liu, M. Raza & L. Cai, Pestalotiopsis wulichongensis P. Razaghi, F. Liu, M. Raza & L. Cai, Seimatosporium tibetense P. Razaghi, F. Liu & L. Cai, Seiridium rhododendri P. Razaghi, F. Liu & L. Cai, Sporocadus cavernicola P. Razaghi, F. Liu & L. Cai, Sporocadus hyperici P. Razaghi, F. Liu & L. Cai, Sporocadus tibetensis P. Razaghi, F. Liu & L. Cai. New combinations: Discosia kaki (Kaz. Tanaka et al.) P. Razaghi, F. Liu & L. Cai, Monochaetia bulbophylli (S.F. Ran & Yong Wang bis) P. Razaghi, F. Liu & L. Cai, Neopestalotiopsis keteleeriae (Y. Song et al.) P. Razaghi, F. Liu & L. Cai. Citation: Razaghi P, Raza M, Han SL, Ma ZY, Cai L, Zhao P, Chen Q, Phurbu D, Liu F (2024). Sporocadaceae revisited. Studies in Mycology 109: 155-272. doi: 10.3114/sim.2024.109.03.

Keywords: Fungal diversity; Neopestalotiopsis; Pestalotiopsis; new taxa; plant pathogens; taxonomy.


Conflict of interest statement

The authors declare that there is no conflict of interest.

Figures

Fig. 1
Fig. 1
A. The map shows sampling sites in China, generated by ArcGIS v. 10.5. B. Heatmap of relative abundances of different host plant families in each species of Sporocadaceae obtained in this study. C. Host distribution and habitats of all Sporocadaceae strains studied here.
Fig. 2
Fig. 2
Phylogenetic tree generated from Maximum likelihood analysis (RAxML) based on combined ITS, LSU, and rpb2 sequence data of Sporocadaceae and allied families. The tree topology of the ML analysis was similar to the BI. Maximum likelihood bootstrap support values greater than 50 % and Bayesian posterior probabilities greater than 0.80 are indicated on the branches (ML/PP). Novel species and new records are in red and bold font and “T” indicates the type specimen.
Fig. 2
Fig. 2
Phylogenetic tree generated from Maximum likelihood analysis (RAxML) based on combined ITS, LSU, and rpb2 sequence data of Sporocadaceae and allied families. The tree topology of the ML analysis was similar to the BI. Maximum likelihood bootstrap support values greater than 50 % and Bayesian posterior probabilities greater than 0.80 are indicated on the branches (ML/PP). Novel species and new records are in red and bold font and “T” indicates the type specimen.
Fig. 3
Fig. 3
Phylogenetic tree generated from Maximum likelihood analysis (RAxML) based on combined ITS, tef-1α, and tub2 sequence data of Neopestalotiopsis. The tree topology of the ML analysis was similar to the BI. Maximum likelihood bootstrap support values greater than 50 % and Bayesian posterior probabilities greater than 0.80 are indicated on the branches (ML/PP). Novel species are in red and bold font and “T” indicates the type specimen.
Fig. 3
Fig. 3
Phylogenetic tree generated from Maximum likelihood analysis (RAxML) based on combined ITS, tef-1α, and tub2 sequence data of Neopestalotiopsis. The tree topology of the ML analysis was similar to the BI. Maximum likelihood bootstrap support values greater than 50 % and Bayesian posterior probabilities greater than 0.80 are indicated on the branches (ML/PP). Novel species are in red and bold font and “T” indicates the type specimen.
Fig. 4
Fig. 4
Phylogenetic tree generated from Maximum likelihood analysis (RAxML) based on combined ITS, tef-1α, and tub2 sequence data of Pestalotiopsis. The tree topology of the ML analysis was similar to the BI. Maximum likelihood bootstrap support values greater than 50 % and Bayesian posterior probabilities greater than 0.80 are indicated on the branches (ML/PP). Novel species are in red and bold font and “T” indicates the type specimen.
Fig. 4
Fig. 4
Phylogenetic tree generated from Maximum likelihood analysis (RAxML) based on combined ITS, tef-1α, and tub2 sequence data of Pestalotiopsis. The tree topology of the ML analysis was similar to the BI. Maximum likelihood bootstrap support values greater than 50 % and Bayesian posterior probabilities greater than 0.80 are indicated on the branches (ML/PP). Novel species are in red and bold font and “T” indicates the type specimen.
Fig. 5
Fig. 5
Phylogenetic tree generated from Maximum likelihood analysis (RAxML) based on combined ITS, tef-1α, tub2, LSU, and rpb2 sequence data of Discosia. The tree topology of the ML analysis was similar to the BI. Maximum likelihood bootstrap support values greater than 50 % and Bayesian posterior probabilities greater than 0.80 are indicated on the branches (ML/PP). The new species and new record(s) studied here are in red and bold font and “T” indicates the type specimen.
Fig. 6
Fig. 6
Phylogenetic tree generated from Maximum likelihood analysis (RAxML) based on combined ITS, tef-1α, tub2, LSU, and rpb2 sequence data of Seimatosporium. The tree topology of the ML analysis was similar to the BI. Maximum likelihood bootstrap support values greater than 50 % and Bayesian posterior probabilities greater than 0.80 are indicated on the branches (ML/PP). Novel species are in red and bold font and “T” indicates the type specimen.
Fig. 7
Fig. 7
Phylogenetic tree generated from Maximum likelihood analysis (RAxML) based on combined ITS, tef-1α, tub2, LSU, and rpb2 sequence data of Seiridium. The tree topology of the ML analysis was similar to the BI. Maximum likelihood bootstrap support values greater than 50 % and Bayesian posterior probabilities greater than 0.90 are indicated on the branches (ML/PP). The new species and new record(s) studied here are in red and bold font and “T” indicates the type specimen.
Fig. 8
Fig. 8
Phylogenetic tree generated from Maximum likelihood analysis (RAxML) based on combined ITS, tef-1α, tub2, LSU, and rpb2 sequence data of Sporocadus. The tree topology of the ML analysis was similar to the BI. Maximum likelihood bootstrap support values greater than 50 % and Bayesian posterior probabilities greater than 0.90 are indicated on the branches (ML/PP). Novel species are in red and bold font and “T” indicates the type specimen.
Fig. 9
Fig. 9
Maximum likelihood phylogenomic tree generated from a concatenated alignment of sets of orthologous protein sequences in Sporocadaceae. A total of 4 432 single-copy orthologs were retained. The tree was estimated based on the WAG substitution model. Strains studied here are in bold font and ex-type strains are indicated with “*” at the end of the taxa labels. Genome and assembly features are shown on the right side of the phylogenetic tree. From left to right: Genomes (Mb): genome size in Mb; Genes: number of predicted genes; Repeat sequences (Mb): genome sizes showing the proportion of repeat elements in these genomes; EggNOG annotated genes: number of predicted protein-coding genes with and without functional annotation based on EggNOG database; CAZymes: gene number with the distribution of CAZyme classes, auxiliary activities (AA), carbohydrate-binding molecules (CBM), carbohydrate esterases (CE), glycoside hydrolases (GH), glycosyl transferases (GT), polysaccharide lyases (PL); Effectors & transporters: number of predicted effectors and transporters.
Fig. 10
Fig. 10
Cavernicola guangxiensis (ex-holotype culture CGMCC 3.23472 = LC12544). A–D. Upper and reverse views of cultures on PDA after 14 d (A, B) and SNA after 7 d (C, D). E. Exudate droplets on PDA. F. Conidiomata on SNA. G–I. Conidiogenous cells and conidia. J. Conidia. Scale bars = 5 μm.
Fig. 11
Fig. 11
Discosia ascidiata (ex-holotype culture CGMCC 3.23485 = LC3414). A–D. Upper and reverse views of cultures on PDA (A, B) and SNA (C, D) after 14 d. E. Ascomata covered by hyphae on SNA. F. Section of ascomata. G. Ascomatal wall. H–J. Asci, ascospores and paraphyses. K. Ascospores. L. Anastomosis between ascospores. Scale bars: F = 10 μm, G–L = 5 μm.
Fig. 12
Fig. 12
Discosia jiangxiensis (ex-holotype culture CGMCC 3.23483 = LC2775). A–D. Upper and reverse views of cultures on PDA (A, B) and SNA (C, D) after 14 d. E. Exudate droplets on PDA. F, G. Conidiogenous cells and conidia. H. Conidia. Scale bars = 5 μm.
Fig. 13
Fig. 13
Discosia navicularis (ex-holotype culture CGMCC 3.23482 = LC2755). A–D. Upper and reverse views of cultures on PDA after 7 d (A, B) and on SNA after 14 d (C, D). E. Conidiomata on pine needle. F. Exudate droplets on PDA. G–I. Conidiogenous cells and conidia. J–O. Conidia. Scale bars = 5 μm.
Fig. 14
Fig. 14
Discosia pini (living culture CGMCC 3.23484 = LC3404). A–D. Upper and reverse views of cultures on PDA after 7 d (A, B) and on SNA after 14 d (C, D). E. Exudate droplets on PDA. F. Conidiomata on SNA. G, H. Conidiogenous cells and conidia. I. Conidia. Scale bars = 5 μm.
Fig. 15
Fig. 15
Neopestalotiopsis ageratinae (ex-holotype culture CGMCC 3.23468 = LC11319). A–D. Upper and reverse views of cultures on PDA after 14 d (A, B) and on SNA after 7 d (C, D). E. Conidiomata on PDA. F–H. Conidiogenous cells and conidia. I, J. Conidia. Scale bars = 5 μm.
Fig. 16
Fig. 16
Neopestalotiopsis castanopsidis (ex-holotype culture CGMCC 3.23478 = LC13333). A–D. Upper and reverse views of cultures on PDA (A, B) and on SNA (C, D) after 7 d. E. exudate droplets on PDA. F. Conidiomata on pine needle. G, H. α-conidiogenous cells and α-conidia. I–M. α-conidia. N, O. β-conidiogenous cells and β-conidia. P. β-conidia. Scale bars = 5 μm.
Fig. 17
Fig. 17
Neopestalotiopsis celtidis (ex-holotype culture CGMCC 3.23513 = LC8947). A–D. Upper and reverse views of cultures on PDA after 35 d (A, B) and on SNA after 7 d (C, D). E. Conidiomata on PDA. F. Conidiomata on pine needle. G, H. Conidiogenous cells and conidia. I–M. Conidia. Scale bars = 5 μm.
Fig. 18
Fig. 18
Neopestalotiopsis collariata (ex-holotype culture CGMCC 3.23493 = LC4212). A–D. Upper and reverse views of cultures on PDA (A, B) and on SNA (C, D) after 7 d. E. Conidiomata on PDA. F. Conidiomata on pine needle. G–I. Conidiogenous cells and conidia. J–N. Conidia. Scale bars: G, I = 5 μm, H, J–N = 10 μm.
Fig. 19
Fig. 19
Neopestalotiopsis dimorphospora (ex-holotype culture CGMCC 3.23497 = LC4444). A–D. Upper and reverse views of cultures on PDA after 14 d (A, B) and on SNA after 7 d (C, D). E. Conidiomata on PDA. F. Conidiomata on pine needle. G–I. α-conidiogenous cells and α-conidia. J–N. α-conidia. O, P. β-conidiogenous cells and β-conidia. Q. β-conidia. Scale bars: G–O, Q = 5 μm, P = 10 μm.
Fig. 20
Fig. 20
Neopestalotiopsis dolichoconidiophora (ex-holotype culture CGMCC 3.23490 = LC3634). A–D. Upper and reverse views of cultures on PDA (A, B) and on SNA (C, D) after 7 d. E. Conidiomata on PDA. F. Conidiomata on pine needle. G–I. Conidiogenous cells and conidia. J. Conidia. Scale bars = 10 μm.
Fig. 21
Fig. 21
Neopestalotiopsis fijiensis (ex-holotype culture CGMCC 3.23465 = LC0652). A–D. Upper and reverse views of cultures on PDA (A, B) and on SNA (C, D) after 7 d. E. Conidiomata on PDA. F. Conidiomata on pine needle. G, H. Paraphyses. I, J. Ascospores. K, L. Conidiogenous cells. M–Q. Conidia. Scale bars: G = 10 μm, H–Q = 5 μm.
Fig. 22
Fig. 22
Neopestalotiopsis fimbriata (ex-holotype culture CGMCC 3.23479 = LC13340). A–D. Upper and reverse views of cultures on PDA after 14 d (A, B) and on SNA after 7 d (C, D). E. Exudate droplets on PDA. F. Conidiomata on SNA. G–I. α-conidiogenous cells and α-conidia. J–N. α-conidia. O–Q. β-conidiogenous cells and β-conidia. R. β-conidia. Scale bars = 5 μm.
Fig. 23
Fig. 23
Neopestalotiopsis fuzhouensis (ex-holotype culture CGMCC 3.23509 = LC8457). A–D. Upper and reverse views of cultures on PDA (A, B) and on SNA (C, D) after 7 d. E–G. Conidiomata on PDA, SNA and pine needle, respectively. H–J. Conidiogenous cells and conidia. K–P. Conidia. Scale bars = 5 μm.
Fig. 24
Fig. 24
Neopestalotiopsis guangxiensis (ex-holotype culture CGMCC 3.23505 = LC7542). A–D. Upper and reverse views of cultures on PDA after 14 d (A, B) and on SNA after 7 d (C, D). E. Conidiomata on PDA. F. Conidiomata on pine needle. G–I. Conidiogenous cells and conidia. J–N. Conidia. Scale bars = 5 μm.
Fig. 25
Fig. 25
Neopestalotiopsis guizhouensis (ex-holotype culture CGMCC 3.23501 = LC5337). A–D. Upper and reverse views of cultures on PDA after 14 d (A, B) and on SNA after 7 d (C, D). E. Conidiomata on pine needle. F–H. Conidiogenous cells and conidia. I–M. Conidia. Scale bars = 5 μm.
Fig. 26
Fig. 26
Neopestalotiopsis hyperici (living culture CGMCC 3.23504 = LC7093). A–D. Upper and reverse views of cultures on PDA (A, B) and on SNA (C, D) after 7 d. E. Conidiomata on pine needle. F–G. α-, β-conidiogenous cells and conidia. H–L. α-conidia. M. β-conidia. Scale bars = 5 μm.
Fig. 27
Fig. 27
Neopestalotiopsis jiangxiensis (ex-holotype culture CGMCC 3.23492 = LC4209). A–D. Upper and reverse views of cultures on PDA (A, B) and on SNA (C, D) after 7 d. E. Conidiomata on PDA. F. Conidiomata on pine needle. G–I. α-conidiogenous cells and α-conidia. J–N. α-conidia. O–Q. β-conidiogenous cells and β-conidia. R. β-conidia. Scale bars: G–J, L–O, Q, R = 10 μm, K, P = 5 μm.
Fig. 28
Fig. 28
Neopestalotiopsis liquidambaris (ex-holotype culture CGMCC 3.23508 = LC8381). A–D. Upper and reverse views of cultures on PDA (A, B) and on SNA (C, D) after 7 d. E. Conidiomata on pine needle. F–H. α-conidiogenous cells and α-conidia. I. α-conidia. J, K. β-conidiogenous cells and β-conidia. L. β-conidia. Scale bars = 5 μm.
Fig. 29
Fig. 29
Neopestalotiopsis machili (ex-holotype culture CGMCC 3.23477 = LC13302). A–D. Upper and reverse views of cultures on PDA after 14 d (A, B) and on SNA after 7 d (C, D). E. Conidiomata on pine needle. F, G. Conidiogenous cells. H–L. Conidia. Scale bars = 5 μm.
Fig. 30
Fig. 30
Neopestalotiopsis megabetaspora (ex-holotype culture CGMCC 3.23474 = LC13119). A–D. Upper and reverse views of cultures on PDA after 14 d (A, B) and on SNA after 7 d (C, D). E. Conidiomata on pine needle. F, G. α-conidiogenous cells and α-conidia. H–L. α-conidia. M–O. β-conidiogenous cells and β-conidia. P, Q. β-conidia. Scale bars: F–N, P, Q = 5 μm, O = 10 μm.
Fig. 31
Fig. 31
Neopestalotiopsis moniliformis (ex-holotype culture CGMCC 3.23498 = LC4495). A–D. Upper and reverse views of cultures on PDA (A, B) and on SNA (C, D) after 7 d. E. Conidiomata on SNA. F. Exudate droplets on PDA. G, H. Conidiogenous cells and conidia. I–K. Conidia. Scale bars = 5 μm.
Fig. 32
Fig. 32
Neopestalotiopsis nanningensis (ex-holotype culture CGMCC 3.23475 = LC13212). A–D. Upper and reverse views of cultures on PDA (A, B) and on SNA (C, D) after 7 d. E. Conidiomata on PDA. F. Conidiomata on pine needle. G, H. Conidiogenous cells. I–M. Conidia. Scale bars = 5 μm.
Fig. 33
Fig. 33
Neopestalotiopsis phyllostachydis (ex-holotype culture CGMCC 3.23491 = LC4208). A–D. Upper and reverse views of cultures on PDA (A, B) and on SNA (C, D) after 7 d. E. Conidiomata on PDA. F. Conidiomata on pine needle. G–I. Conidiogenous cells and conidia. J–M. Conidia. Scale bars: G–L = 5 μm, M = 10 μm.
Fig. 34
Fig. 34
Neopestalotiopsis poae (ex-holotype culture CGMCC 3.23506 = LC7551). A–D. Upper and reverse views of cultures on PDA (A, B) and on SNA (C, D) after 7 d. E. Conidiomata on PDA. F. Conidiomata on pine needle. G–I. Conidiogenous cells and conidia. J–N. Conidia. Scale bars = 5 μm.
Fig. 35
Fig. 35
Neopestalotiopsis smilacis (ex-holotype culture CGMCC 3.23500 = LC4596). A–D. Upper and reverse views of cultures on PDA (A, B) and on SNA (C, D) after 7 d. E. Conidiomata on pine needle. F. Conidiomata on PDA. G, H. Conidiogenous cells and conidia. I–M. Conidia. Scale bars = 5 μm.
Fig. 36
Fig. 36
Pestalotiopsis alloschemones (ex-holotype culture CGMCC 3.23480 = LC13372). A–D. Upper and reverse views of cultures on PDA after 14 d (A, B) and on SNA after 7 d (C, D). E. Conidiomata on pine needle. F–H. Conidiophores, conidiogenous cells, and conidia. I. Conidia. Scale bars = 5 μm.
Fig. 37
Fig. 37
Pestalotiopsis biappendiculata (ex-holotype culture CGMCC 3.23487 = LC3574). A–D. Upper and reverse views of cultures on PDA after 14 d (A, B) and on SNA after 7 d (C, D). E. Conidiomata on PDA. F. Conidiomata on SNA. G–I. Conidiogenous cells and conidia. J–M. Conidia. Scale bars = 5 μm.
Fig. 38
Fig. 38
Pestalotiopsis cratoxyli (ex-holotype culture CGMCC 3.23512 = LC8773). A–D. Upper and reverse views of cultures on PDA (A, B) and on SNA (C, D) after 7 d. E. Conidiomata on PDA. F. Conidiomata on pine needle. G–J. Conidiogenous cells and conidia. K–P. Conidia. Scale bars = 5 μm.
Fig. 39
Fig. 39
Pestalotiopsis exudata (ex-holotype culture CGMCC 3.23488 = LC3582). A–D. Upper and reverse views of cultures on PDA after 14 d (A, B) and on SNA after 7 d (C, D). E. Conidiomata on PDA. F. Conidiomata on pine needle. G–I. Conidiogenous cells and conidia. J–M. Conidia. Scale bars = 5 μm.
Fig. 40
Fig. 40
Pestalotiopsis ficicrescens (living culture CGMCC 3.23471 = LC12337). A–D. Upper and reverse views of cultures on PDA (A, B) and on SNA (C, D) after 7 d. E. Sterile structures on PDA. F. Conidiomata on SNA. G, H. Conidiogenous cells and conidia. I–M. Conidia. Scale bars = 5 μm.
Fig. 41
Fig. 41
Pestalotiopsis fusiformis (ex-holotype culture CGMCC 3.23495 = LC4365). A–D. Upper and reverse views of cultures on PDA after 14 d (A, B) and on SNA after 7 d (C, D). E. Conidiomata on pine needle. F–H. Conidiogenous cells and conidia. I, J. Conidia. Scale bars = 5 μm.
Fig. 42
Fig. 42
Pestalotiopsis ganzhouensis (ex-holotype culture CGMCC 3.23489 = LC3629). A–D. Upper and reverse views of cultures on PDA (A, B) and on SNA (C, D) after 7 d. E. Conidiomata on SNA. F. Conidiomata on pine needle. G–I. Conidiogenous cells and conidia. J–N. Conidia. Scale bars = 5 μm.
Fig. 43
Fig. 43
Pestalotiopsis lobata (ex-holotype culture CGMCC 3.23467 = LC1102). A–D. Upper and reverse views of cultures on PDA after 14 d (A, B) and on SNA after 7 d (C, D). E. Conidiomata on PDA. F. Conidiomata on SNA. G–I. Conidiogenous cells and conidia. J. Conidia. Scale bars = 5 μm.
Fig. 44
Fig. 44
Pestalotiopsis machili (ex-holotype culture CGMCC 3.23511 = LC8736). A–D. Upper and reverse views of cultures on PDA (A, B) and on SNA (C, D) after 7 d. E. Exudate droplets on PDA. F. Conidiomata on pine needle. G, H. Conidiogenous cells and conidia. I–M. Conidia. Scale bars = 5 μm.
Fig. 45
Fig. 45
Pestalotiopsis multiappendiculata (ex-holotype culture CGMCC 3.23514 = LC2911). A–D. Upper and reverse views of cultures on PDA after 14 d (A, B) and on SNA after 7 d (C, D). E. Conidiomata on PDA. F. Conidiomata on pine needle. G–I. Conidiogenous cells and conidia. J–N. Conidia. Scale bars = 5 μm.
Fig. 46
Fig. 46
Pestalotiopsis multicolor (living culture CGMCC 3.23171 = LC3616). A–D. Upper and reverse views of cultures on PDA (A, B) and on SNA (C, D) after 7 d. E. Conidiomata on pine needle. F–H. Conidiogenous cells. I–L. Conidia. Scale bars = 5 μm.
Fig. 47
Fig. 47
Pestalotiopsis pruni (ex-holotype culture CGMCC 3.23507 = LC8252). A–D. Upper and reverse views of cultures on PDA after 14 d (A, B) and on SNA after 7 d (C, D). E. Conidiomata on PDA. F. Conidiomata on pine needle. G, H. Conidiogenous cells and conidia. I. Conidia. Scale bars = 5 μm.
Fig. 48
Fig. 48
Pestalotiopsis rubrae (ex-holotype culture CGMCC 3.23499 = LC4567). A–D. Upper and reverse views of cultures on PDA (A, B) and on SNA (C, D) after 7 d. E. Conidiomata on pine needle. F. Conidiomata on PDA. G. Conidiomata on SNA. H, I. Conidiogenous cells and conidia. J–M. Conidia. Scale bars = 5 μm.
Fig. 49
Fig. 49
Pestalotiopsis tumida (living culture CGMCC 3.23502 = LC6057). A–D. Upper and reverse views of cultures on PDA after 14 d (A, B) and on SNA after 7 d (C, D). E. Conidiomata on PDA. F. Conidiomata on SNA. G–I. Conidiogenous cells and conidia. J–N. Conidia. Scale bars: G–J, L–N = 5 μm, K = 10 μm.
Fig. 50
Fig. 50
Pestalotiopsis wulichongensis (ex-holotype culture CGMCC 3.23469 = LC11341). A–D. Upper and reverse views of cultures on PDA (A, B) and on SNA (C, D) after 7 d. E. Conidiomata on PDA. F. Conidiomata on pine needle. G–I. Conidiogenous cells and conidia. J–N. Conidia. Scale bars = 5 μm.
Fig. 51
Fig. 51
Seimatosporium tibetense (ex-holotype culture CGMCC 3.23503 = LC6093). A–D. Upper and reverse views of cultures on PDA (A, B) and on SNA after 14 d (C, D). E. Conidiomata on SNA. F–H. Conidiogenous cells and conidia. I–L, N–Q. Conidia. M. Anastomosis between conidia. Scale bars = 5 μm.
Fig. 52
Fig. 52
Seiridium guangyuanum (living culture CGMCC 3.23470 = LC12295). A–D. Upper and reverse views of cultures on PDA (A, B) and on SNA after 14 d (C, D). E. Conidiomata on pine needle. F–H. Conidiophores, conidiogenous cells, and conidia. I–N. Conidia. Scale bars = 5 μm.
Fig. 53
Fig. 53
Seiridium rhododendri (ex-holotype culture CGMCC 3.23494 = LC4317). A–D. Upper and reverse views of cultures on PDA after 14 d (A, B) and on SNA after 7 d (C, D). E. Exudate droplets on PDA. F. Conidiomata on SNA. G–I. Conidiophores, conidiogenous cells, and conidia. J. Conidia. K, L. Microcyclic conidiogenesis. Scale bars = 5 μm.
Fig. 54
Fig. 54
Seiridium vernicola (living culture CGMCC 3.23510 = LC8621). A–D. Upper and reverse views of cultures on PDA (A, B) and on SNA (C, D) after 7 d. E. Conidiomata on SNA. F–H. Conidiophores, conidiogenous cells, and conidia. I–N. Conidia. Scale bars = 5 μm.
Fig. 55
Fig. 55
Sporocadus cavernicola (ex-holotype culture CGMCC 3.23173 = LC9586). A–D. Upper and reverse views of cultures on PDA after 14 d (A, B) and on SNA after 7 d (C, D). E, G. Hyphal aggregation. F. Conidiomata on SNA. H–J. Conidiogenous cells. K. Conidia. Scale bars: G = 20 μm, H–K = 5 μm.
Fig. 56
Fig. 56
Sporocadus hyperici (ex-holotype culture CGMCC 3.23174 = LC11186). A–D. Upper and reverse views of cultures on PDA after 7 d (A, B) and on SNA after 14 d (C, D). E. Conidiomata on SNA. F–H. Conidiophores, conidiogenous cells, and conidia. I, J. Conidia. Scale bars = 5 μm.
Fig. 57
Fig. 57
Sporocadus tibetensis (ex-holotype culture CGMCC 3.23172 = LC6109). A–D. Upper and reverse views of cultures on PDA (A, B) and on SNA after 14 d (C, D). E. Exudate droplets on PDA. F. Conidiomata on pine needle. G–I. Conidiogenous cells and conidia. J, K. Conidia. Scale bars = 5 μm.

Similar articles

Cited by

References

    1. Achari SR, Kaur J, Dinh Q. et al. (2020). Phylogenetic relationship between Australian Fusarium oxysporum isolates and resolving the species complex using the multispecies coalescent model. BMC Genomics 21: 1–20. - PMC - PubMed
    1. Akinsanmi OA, Nisa S, Jeff-Ego OS. et al. (2017). Dry flower disease of Macadamia in Australia caused by Neopestalotiopsis macadamiae sp. nov. and Pestalotiopsis macadamiae sp. nov. Plant Disease 101: 45–53. - PubMed
    1. Alexey G, Vladislav S, Nikolay V. et al. (2013). QUAST: quality assessment tool for genome assemblies. Bioinformatics 29: 1072–1075. - PMC - PubMed
    1. Andrews S, Babraham B. (2010). FastQC: a quality control tool for high throughput sequence data. http://www.bioinformatics.babraham.ac.uk/projects/fastqc
    1. Ariyawansa HA, Hyde KD. (2018). Additions to Pestalotiopsis in Taiwan. Mycosphere 9: 999–1013.

LinkOut - more resources