

Quantitative Assessment of Baseline Serum HDL-C to Predict Gout Flares During Urate-Lowering Therapy Initiation: A Prospective Cohort Study
- PMID: 39717664
- PMCID: PMC11665189
- DOI: 10.2147/JIR.S493376
Quantitative Assessment of Baseline Serum HDL-C to Predict Gout Flares During Urate-Lowering Therapy Initiation: A Prospective Cohort Study
Erratum in
-
Erratum: Quantitative Assessment of Baseline Serum HDL-C to Predict Gout Flares During Urate-Lowering Therapy Initiation: A Prospective Cohort Study [Corrigendum].J Inflamm Res. 2025 May 21;18:6489-6490. doi: 10.2147/JIR.S540816. eCollection 2025. J Inflamm Res. 2025. PMID: 40421266 Free PMC article.
Abstract
Purpose: Previous studies have linked high-density lipoprotein cholesterol (HDL-C) to gout, but little is known about the dose-effect relationship between serum HDL-C levels and gout flares. This study aimed to quantify the association between the two during urate-lowering therapy initiation and develop a regression equation to predict gout flares.
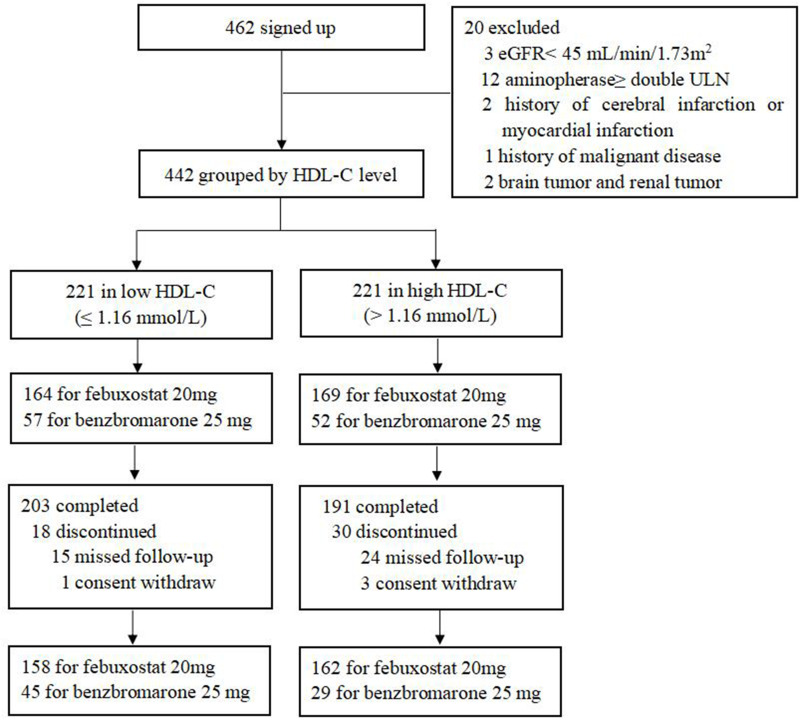
Patients and methods: We conducted a prospective, observational, single-center cohort study of men with gout. Patients were identified and grouped according to the level of serum HDL-C (1.16 mmol/L) at baseline and followed-up every four weeks until 12 weeks.
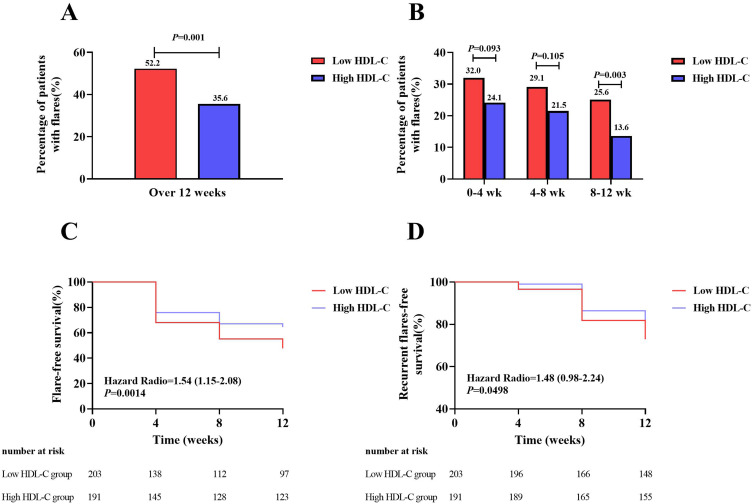
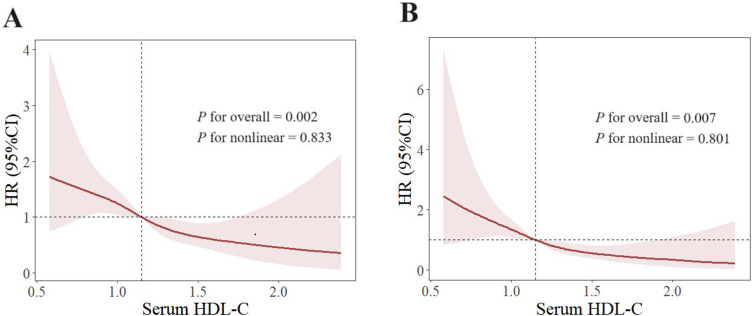
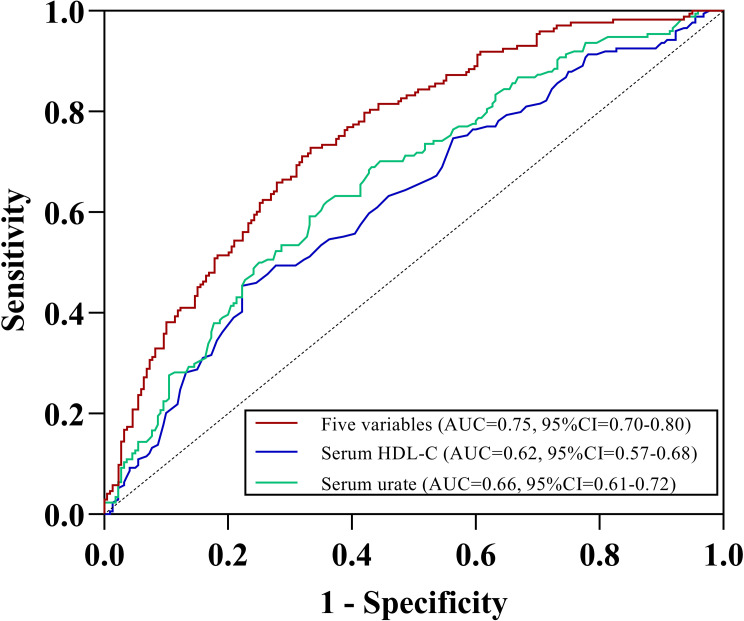
Results: A total of 394 participants completed the study (203 in the low HDL-C group; 191 in the high HDL-C group). The proportion of participants with gout flares in the low HDL-C group was significantly higher than in the high HDL-C group after 12 weeks follow-up (52.2% versus 35.6%, P=0.001). Patients with lower serum HDL-C level had higher risk of gout flares analyzed by restricted cubic spline and when serum HDL-C level = 1.15mmol/L, flareHR = 1. When combined with well-known risk factors, serum HDL-C predicted gout flares with an area under curve (AUC) of 0.75 (95% CI=0.70-0.80). Based on the logistic regression coefficients, we derived the following regression equation: Logit (P)= -2.282+0.05× [disease duration]+1.015× [recurrent flares in the last year]+0.698× [palpable tophus]+0.345× [serum urate]-1.349×[serum HDL-C].
Conclusion: Patients with gout presented a negative linear relationship between serum HDL-C and gout flares. Together with common clinical indicators, the AUC for gout flare prediction increased to 0.75. For patients with gout, remaining serum HDL-C level above 1.15 mmol/L may reduce the risk of gout flares.
Keywords: AUC; inflammation; life style intervention; prediction.
© 2024 Jiang et al.
Conflict of interest statement
The authors report no conflicts of interest in this work.
Figures
References
-
- Global, regional. and national disability-adjusted life-years (DALYs) for 359 diseases and injuries and healthy life expectancy (HALE) for 195 countries and territories, 1990-2017: a systematic analysis for the Global Burden of Disease Study 2017. Lancet. 2018;392(10159):1859–1922. doi: 10.1016/s0140-6736(18)32335-3 - DOI - PMC - PubMed
LinkOut - more resources
Full Text Sources
