

The association of combinations of social factors and SARs-CoV-2 infection: A retrospective population-based cohort study in Ontario, 2020-2021
- PMID: 39717675
- PMCID: PMC11664076
- DOI: 10.1016/j.dialog.2024.100197
The association of combinations of social factors and SARs-CoV-2 infection: A retrospective population-based cohort study in Ontario, 2020-2021
Abstract
Objective: The COVID-19 pandemic highlighted and exacerbated health inequities worldwide. While several studies have examined the impact of individual social factors on COVID infection, our objective was to examine how interactions of social factors were associated with the risk of testing positive for SARS-CoV-2 during the first two years of the pandemic.
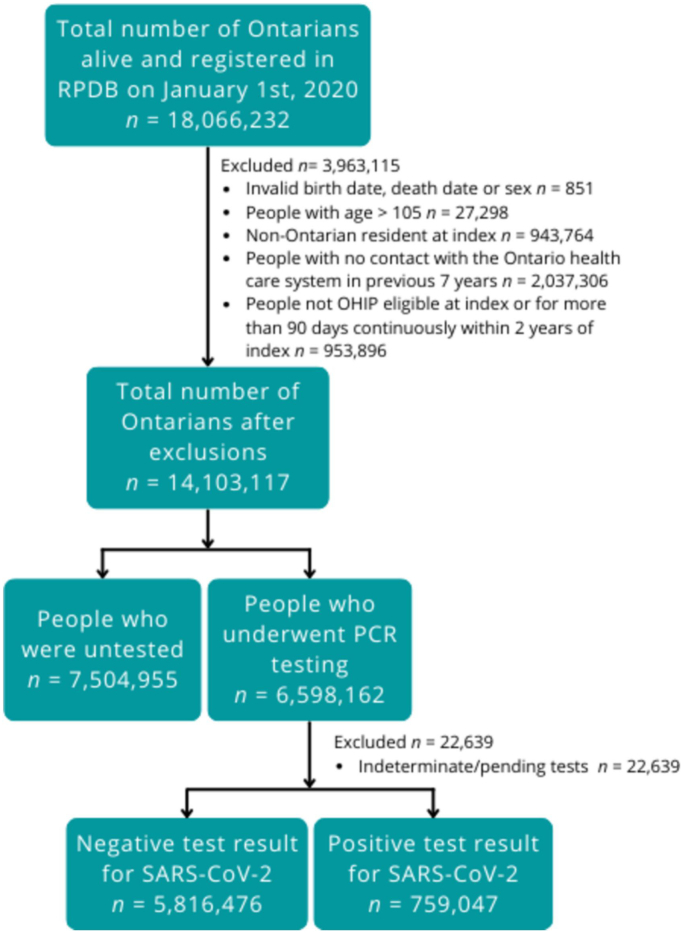
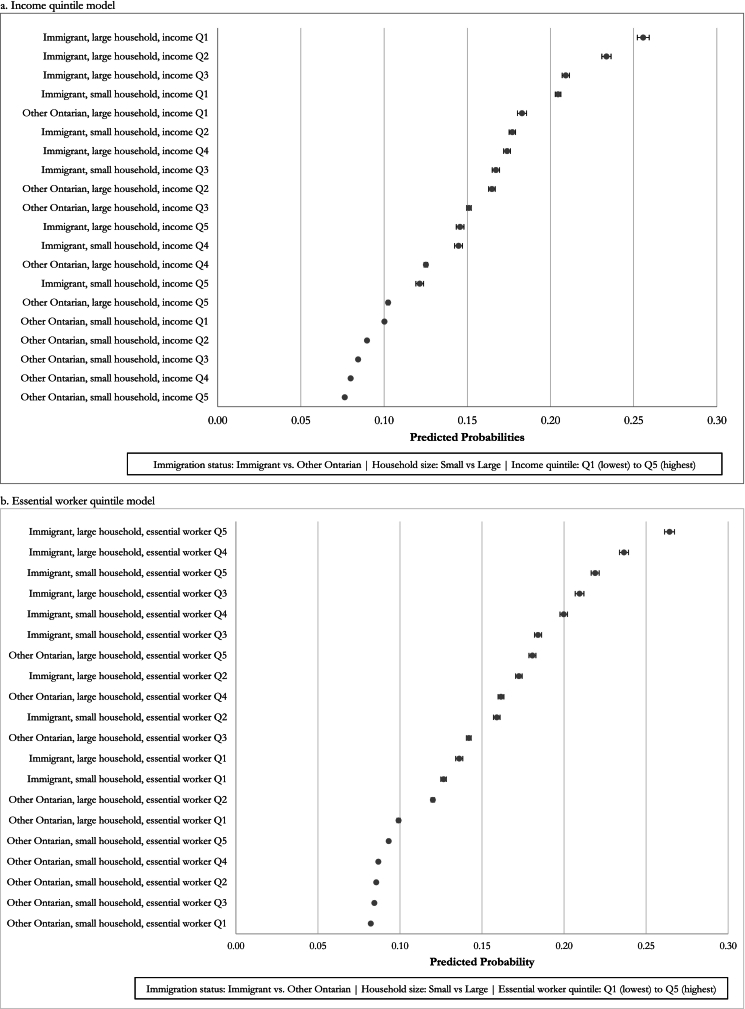
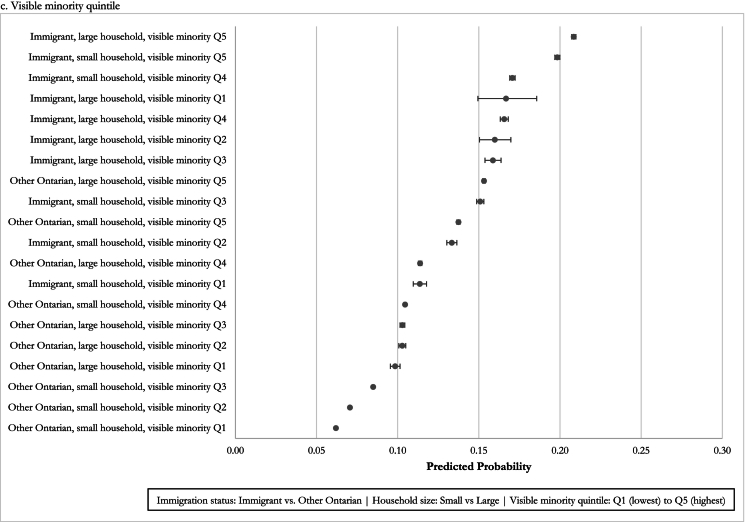
Study design and setting: We conducted an observational cohort study using linked health administrative data for Ontarians tested for SARS-CoV-2 between January 1st, 2020, and December 31st, 2021. We constructed multivariable models to examine the association between SARS-CoV-2 positivity and key variables including immigration status (immigrants vs. other Ontarians), and neighbourhood variables for household size, income, essential worker status, and visible minority status. We report main and interaction effects using odds ratios and predicted probabilities, with age and sex controlled in all models.
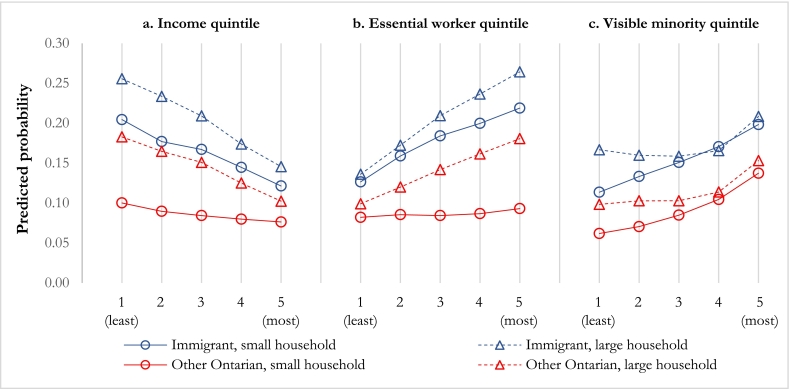
Results: Of 6,575,523 Ontarians in the cohort, 88.5 % tested negative, and 11.5 % tested positive for SARS-CoV-2. In all models, immigrants and those living in neighbourhoods with large average household sizes had greater odds of testing positive for SARS-CoV-2. The strength of these associations increased with increasing levels of neighbourhood marginalization for income, essential worker proportion and visible minority proportion. We observed little change in the probability of testing positive across neighbourhood income quintiles among other Ontarians who live in neighbourhoods with smaller households, but a large change in probability among other Ontarians who live in neighbourhoods with larger households.
Conclusion: Our study found that SARS-CoV-2 positivity was greater among people with certain combinations of social factors, but in all cases the probability of testing positive was consistently greater for immigrants than for other Ontarians. Examining interactions of social factors can provide a more nuanced and more comprehensive understanding of health inequity than examining factors separately.
Keywords: COVID-19 positivity; Health equity; SARS-CoV-2; Social determinants of health.
© 2024 The Authors. Published by Elsevier Inc. CC BY-NC-ND 4.0.
Conflict of interest statement
The authors declare the following financial interests/personal relationships which may be considered as potential competing interests: Claire E. Kendall reports financial support was provided by Canadian Institutes of Health Research. Dr. Bayoumi was supported by the 10.13039/100004702Baxter and Alma Ricard Chair in Inner City Health at Unity Health Toronto and the 10.13039/501100003579University of Toronto. Dr. Claire Kendall was supported by a Clinical Research Chair in Strengthening Primary Care for Integrated Health Equity and the 10.13039/100008572University of Ottawa. If there are other authors, they declare that they have no known competing financial interests or personal relationships that could have appeared to influence the work reported in this paper.
Figures
Similar articles
-
COVID-19 vaccine equity: a retrospective population-based cohort study examining primary series and first booster coverage among persons with a history of immigration and other residents of Ontario, Canada.Front Public Health. 2023 Sep 8;11:1232507. doi: 10.3389/fpubh.2023.1232507. eCollection 2023. Front Public Health. 2023. PMID: 37744516 Free PMC article.
-
Individual and social determinants of SARS-CoV-2 testing and positivity in Ontario, Canada: a population-wide study.CMAJ. 2021 May 17;193(20):E723-E734. doi: 10.1503/cmaj.202608. Epub 2021 Apr 27. CMAJ. 2021. PMID: 33906966 Free PMC article.
-
Sporadic SARS-CoV-2 cases at the neighbourhood level in Toronto, Ontario, 2020: a spatial analysis of the early pandemic period.CMAJ Open. 2022 Mar 8;10(1):E190-E195. doi: 10.9778/cmajo.20210249. Print 2022 Jan-Mar. CMAJ Open. 2022. PMID: 35260468 Free PMC article.
-
Pre-Vaccine Positivity of SARS-CoV-2 Antibodies in Alberta, Canada during the First Two Waves of the COVID-19 Pandemic.Microbiol Spectr. 2021 Sep 3;9(1):e0029121. doi: 10.1128/Spectrum.00291-21. Epub 2021 Aug 18. Microbiol Spectr. 2021. PMID: 34406813 Free PMC article.
-
Workplace interventions to reduce the risk of SARS-CoV-2 infection outside of healthcare settings.Cochrane Database Syst Rev. 2024 Apr 10;4(4):CD015112. doi: 10.1002/14651858.CD015112.pub3. Cochrane Database Syst Rev. 2024. PMID: 38597249 Free PMC article.
Cited by
-
Coronavirus-two infection among adults: A scoping review of literature published in 2023-24.Pak J Med Sci. 2025 Jun;41(6):1788-1798. doi: 10.12669/pjms.41.6.12201. Pak J Med Sci. 2025. PMID: 40621515 Free PMC article. Review.
References
-
- Marmot M.G. The Marmot Review; London: 2010. Fair society, healthy lives: The Marmot review.
-
- Di Cesare M., Khang Y.H., Asaria P., Blakely T., Cowan M.J., Farzadfar F., et al. Inequalities in non-communicable diseases and effective responses. Lancet. 2013;381(9866):585–597. - PubMed
-
- Zygmunt A., Kendall C.E., James P., Lima I., Tuna M., Tanuseputro P. Avoidable mortality rates decrease but inequity gaps widen for marginalized neighborhoods: a population-based analysis in Ontario, Canada from 1993 to 2014. J Community Health. 2020;45(3):579–597. - PubMed
LinkOut - more resources
Full Text Sources
Miscellaneous
