. 2024 Dec 9:15:1440314.
doi: 10.3389/fimmu.2024.1440314. eCollection 2024.

Generation of a SARS-CoV-2-susceptible mouse model using adenovirus vector expressing human angiotensin-converting enzyme 2 driven by an elongation factor 1α promoter with leftward orientation

Affiliations

Generation of a SARS-CoV-2-susceptible mouse model using adenovirus vector expressing human angiotensin-converting enzyme 2 driven by an elongation factor 1α promoter with leftward orientation

Yusuke Matsumoto et al. Front Immunol. .

Abstract

Introduction: To analyze the molecular pathogenesis of severe acute respiratory syndrome coronavirus-2 (SARS-CoV-2), a small animal model such as mice is needed: human angiotensin converting enzyme 2 (hACE2), the receptor of SARS-CoV-2, needs to be expressed in the respiratory tract of mice.

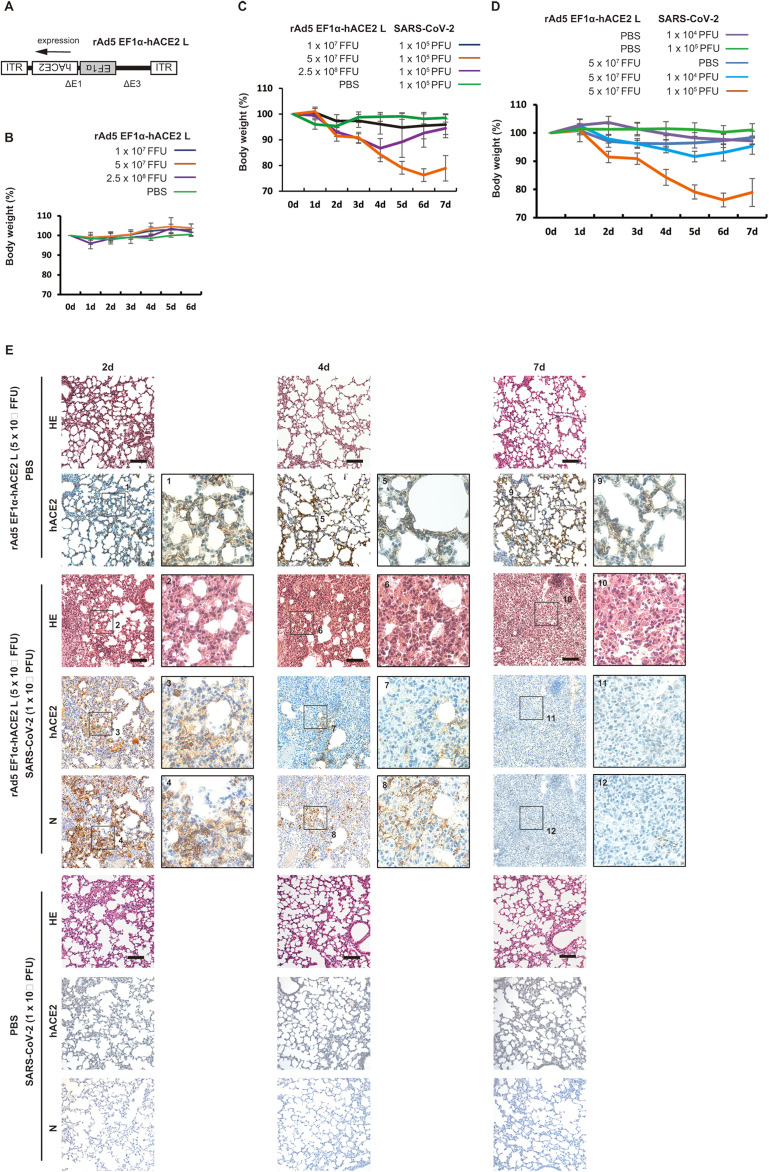
Methods: We conferred SARS-CoV-2 susceptibility in mice by using an adenoviral vector expressing hACE2 driven by an elongation factor 1α (EF1α) promoter with a leftward orientation.

Results: In this model, severe pneumonia like human COVID-19 was observed in SARS-CoV-2-infected mice, which was confirmed by dramatic infiltration of inflammatory cells in the lung with efficient viral replication. An early circulating strain of SARS-CoV-2 caused the most severe weight loss when compared to SARS-CoV-2 variants such as Alpha, Beta and Gamma, although histopathological findings, viral replication, and cytokine expression characteristics were comparable.

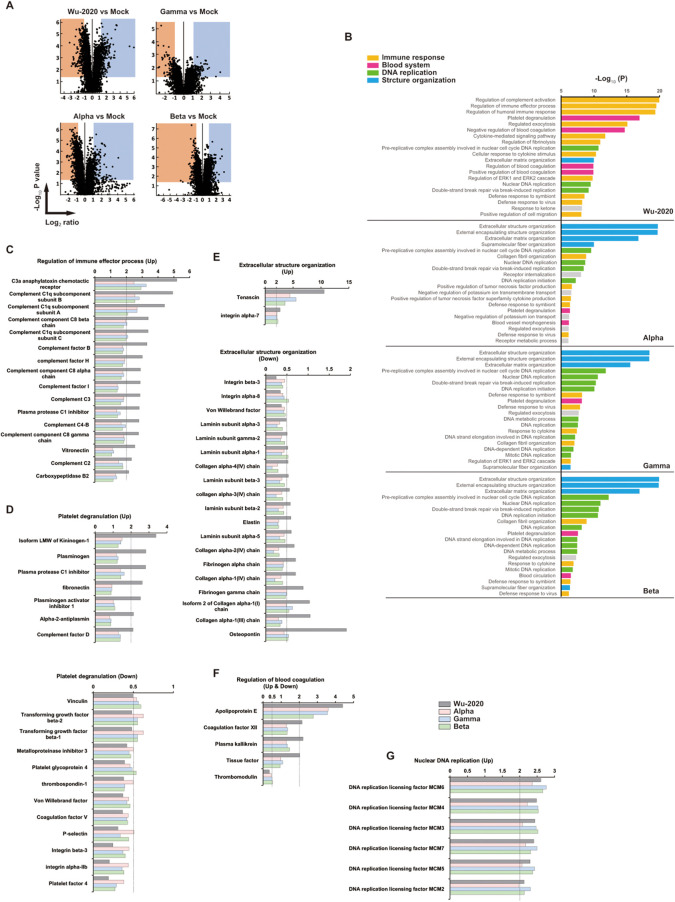
Discussion: We found that a distinct proteome of an early circulating strain infected lung characterized by elevated complement activation and blood coagulation, which were mild in other variants, can contribute to disease severity. Unraveling the specificity of early circulating SARS-CoV-2 strains is important in elucidating the origin of the pandemic.

Keywords: COVID-19; SARS-CoV-2; adenoviral vector; mouse model; proteomics.


Conflict of interest statement

The authors declare that the research was conducted in the absence of any commercial or financial relationships that could be construed as a potential conflict of interest.

Figures

Figure 1
Figure 1
Development of a severe pneumonia mouse model following SARS-CoV-2 infection transduced with rAd5 pEF1α-hACE2-L. (A) Schematic diagram of rAd5 pEF1α-hACE2-L. ITR indicates an inverted terminal repeat. Δ E1 and Δ E3 indicate the deletion of E1 and E3 genes from the adenoviral genome. (B) Changes in body weight of rAd5 pEF1α-hACE2-L-inoculated BALB/c mice. Data represent means and standard deviations (SD), n=3 (6d), 6 (5d), 9 (4d), 12 (3d), 15 (2d), and 18 (0d and 1d). (C) Changes in body weight of BALB/c mice transduced with rAd5 pEF1α-hACE2-L (or PBS control), followed by infection with SARS-CoV-2 (Wu-2020). Mice were first inoculated with rAd5 pEF1α-hACE2-L at doses of 1×10⁷, 5×10⁷ or 2.5×10⁸ FFU/animal, and 5 dpi, SARS-CoV-2 Wu-2020 was administrated at 1×10⁵ PFU/animal. Day 0 equals 5 dpi of rAd5 pEF1α-hACE2-L administration. Data represent means and SD, n=6. (D) Changes in body weight of BALB/c mice transduced with rAd5 pEF1α-hACE2-L (5 × 10⁷ FFU/animal) or PBS control followed by infection with SARS-CoV-2 Wu-2020 at different doses. Day 0 equals 5 dpi of rAd5 pEF1α-hACE2-L. Mock indicates mice transduced with rAd5 pEF1α-hACE2-L, but not infected with SARS-CoV-2. Data represent means and SD, n=6. (E) Histopathological analyses of mouse lungs with Hematoxylin-Eosin (HE) staining and immunohistochemistry using antibody against hACE2 and SARS-CoV-2 N. The images depict one representative from six mice. Scale bars represent 100 µm.
Figure 2
Figure 2
Comparison of pathogenesis of SARS-CoV-2 variants in the mouse model (A) Viral growth in Vero E6/TMPRSS2 cells at an MOI of 0.001. Viral titers are shown in PFU/mL, which were calculated by a standard plaque assay using Vero E6/TMPRSS2 cells. Data represent means and SD, n=3. (B) Viral loads in lung homogenate determined by qRT-PCR to detect the SARS-CoV-2 genome. (C) Viral titers in lung homogenate determined by a plaque assay using Vero E6/TMPRSS2 cells. Data represent means and SD, n=5 (2d and 4d) and n=6 (7d). **p<0.01 (one-way ANOVA followed by Tukey’s test, vs Wu-2020). (D) Changes in body weight of BALB/c mice transduced with rAd5 pEF1α-hACE2-L followed by infection of SARS-CoV-2 variants. Day 0 equals 5 dpi of rAd5 pEF1α-hACE2-L (5 × 10⁷ FFU/animal). The p value is shown (Wu-2020 vs mock and all variants) (one-way ANOVA followed by Tukey’s test). Data represent means and SD, n=6. (E) Changes in body weight of SARS-CoV-2 variant-infected BALB/c mice. Day 0 equals 5 dpi of rAd5 pEF1α-hACE2-L or rAd5 pEF1α-LacZ-L (5 × 10⁷ FFU/animal). Data represent means and SD, n=5. **p<0.01 (Mann–Whitney U test). (F) Viral titers in lung homogenate determined by a plaque assay using Vero E6/TMPRSS2 cells. Data represent means and SD, n=5. *p<0.05, **p<0.01 (Mann–Whitney U test).
Figure 3
Figure 3
Histopathological analyses and cytokine levels of mouse lung infected with SARS-CoV-2 variants (A) Histopathologic findings with HE staining and detection of SARS-CoV-2 N protein in mouse lungs infected with SARS-CoV-2. The images depict one representative from five (2 d and 4 d) and six (7 d) mice. Scale bars represent 100 µm. (B) Left lung homogenates were used for measurement of multiplex cytokines and chemokines using the Bio-plex suspension array system. Data represent means and SD, n=5. *p<0.05, **p<0.01 (one-way ANOVA followed by Tukey’s test). The colors of the asterisks indicate the following: black (vs mock) and gray (vs Wu-2020).
Figure 4
Figure 4
Proteomic landscape of SARS-CoV-2 infected mouse lungs (A) Volcano plots for mouse lung proteome of the indicated group compared to adenovirus-infected/SARS-CoV-2 non-infected (mock) mice. Up-regulated (Log2 ≥ 1) and down-regulated (Log2 ≤ -1) proteins and p value < 0.05 indicate threshold lines. The numbers of up- and down-regulated proteins are 403 and 411 (Wu-2020 vs Mock), 206 and 289 (Alpha vs Mock), 283 and 236 (Gamma vs Mock), 249 and 189 (Beta vs Mock). The lung lysates used for proteomics were generated by combining three mouse lung homogenates, and the two combined lysates per each group were used for analysis. (B) GO enrichment analysis in proteomes of SARS-CoV-2-infected mouse lungs. Top 20 terms of each group are shown. Terms were further categorized into immune response (orange), blood system (pink), DNA replication (green) and structure organization (blue). (C-G) Intrinsic relative protein expressions were categorized into regulation of immune effector process (C), platelet degranulation (D), extracellular structure organization (E), regulation of blood coagulation (F) and nuclear DNA replication (G). X axes indicate relative values shown as fold change when that of mock equals 1. The dashed lines represent the thresholds of up-regulation (>2) and down-regulation (<0.5).

Similar articles

References

    1. Rockx B, Kuiken T, Herfst S, Bestebroer T, Lamers MM, Oude Munnink BB, et al. . Comparative pathogenesis of COVID-19, MERS, and SARS in a nonhuman primate model. Science. (2020) 368(6494):1012–5. doi: 10.1126/science.abb7314 - DOI - PMC - PubMed
    1. Blanco-Melo D, Nilsson-Payant BE, Liu WC, Uhl S, Hoagland D, Møller R, et al. . Imbalanced host response to SARS-CoV-2 drives development of COVID-19. Cell. (2020) 181(5):1036–1045.e9. doi: 10.1016/j.cell.2020.04.026 - DOI - PMC - PubMed
    1. Chan JF, Zhang AJ, Yuan S, Poon VK, Chan CC, Lee AC, et al. . Simulation of the clinical and pathological manifestations of coronavirus disease 2019 (COVID-19) in a golden syrian hamster model: Implications for disease pathogenesis and transmissibility. Clin Infect Dis. (2020) 71(9):2428–46. doi: 10.1093/cid/ciaa325 - DOI - PMC - PubMed
    1. Kim YI, Kim SG, Kim SM, Kim EH, Park SJ, Yu KM, et al. . Infection and rapid transmission of SARS-CoV-2 in ferrets. Cell Host Microbe. (2020) 27(5):704–9.e2. doi: 10.1016/j.chom.2020.03.023 - DOI - PMC - PubMed
    1. Yu P, Qi F, Xu Y, Li F, Liu P, Liu J, et al. . Age-related rhesus macaque models of COVID-19. Anim Model Exp Med. (2020) 3(1):93–7. doi: 10.1002/ame2.12108 - DOI - PMC - PubMed

Substances

LinkOut - more resources