

Transcriptomic Profiles of the Nasal Mucosa Following Birch Pollen Provocation Differ Between Birch Pollen-Allergic and Non-Allergic Individuals
- PMID: 39717878
- PMCID: PMC12186594
- DOI: 10.1111/all.16448
Transcriptomic Profiles of the Nasal Mucosa Following Birch Pollen Provocation Differ Between Birch Pollen-Allergic and Non-Allergic Individuals
Abstract
Background: Birch pollen (BP) interacts with airway epithelial cells to cause allergic sensitization and allergy in predisposed individuals. However, the basic mechanisms underlying the clinical effects are poorly understood. Changes in gene expression and cytokine secretion in nasal mucosal cells upon BP exposure were determined in BP-allergic and non-allergic individuals.
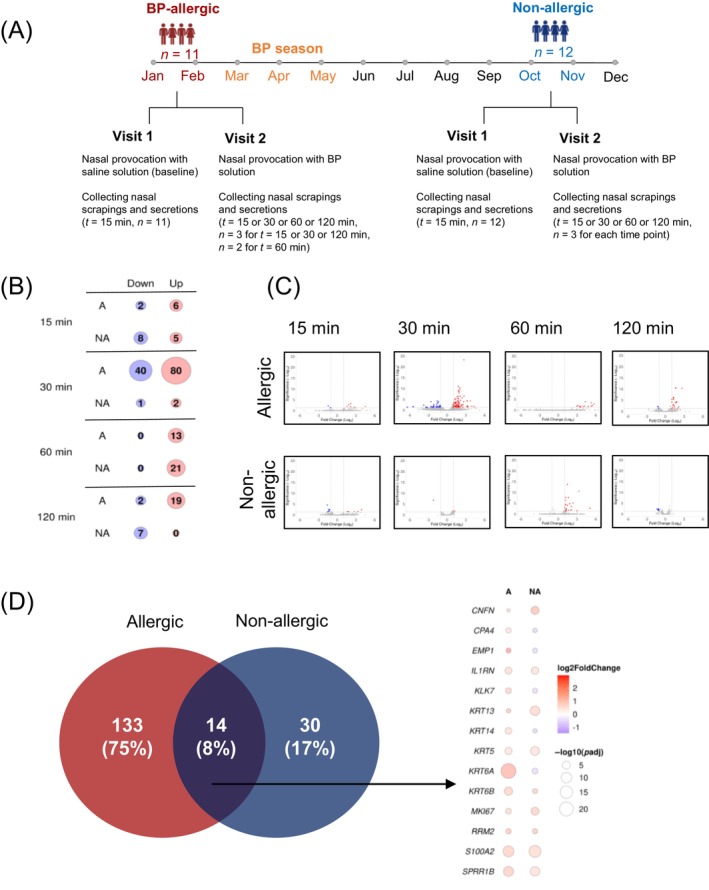
Methods: BP-allergic (n = 11) and non-allergic individuals (n = 12) participated in nasal provocations with saline and aqueous BP solution. Nasal scrapings and secretions were obtained at baseline and after BP provocation. Bulk RNA sequencing of the nasal scrapings was performed, and cytokines in nasal secretions were quantified.
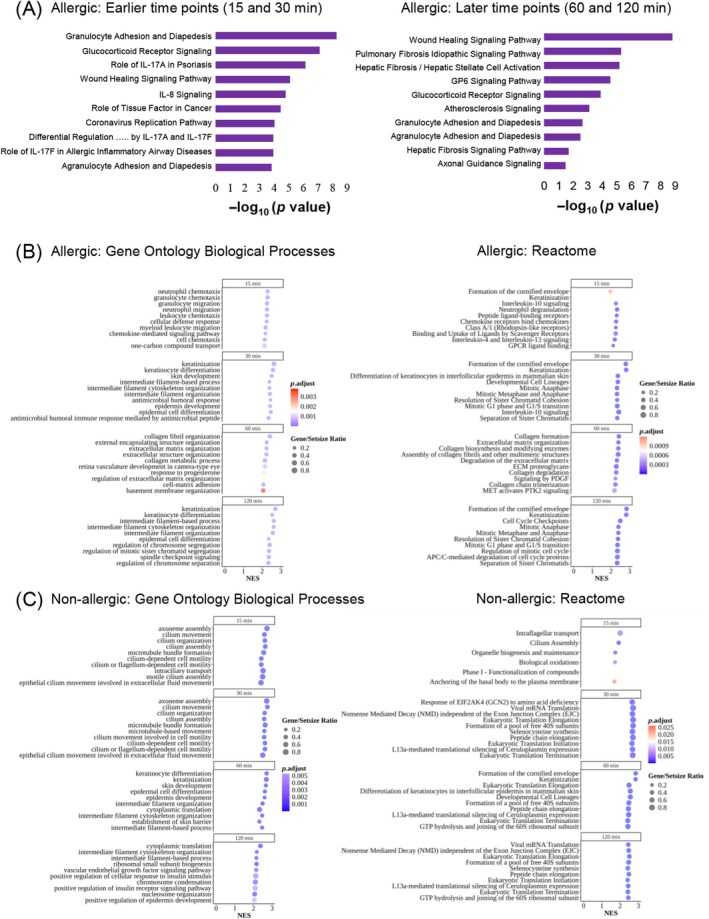
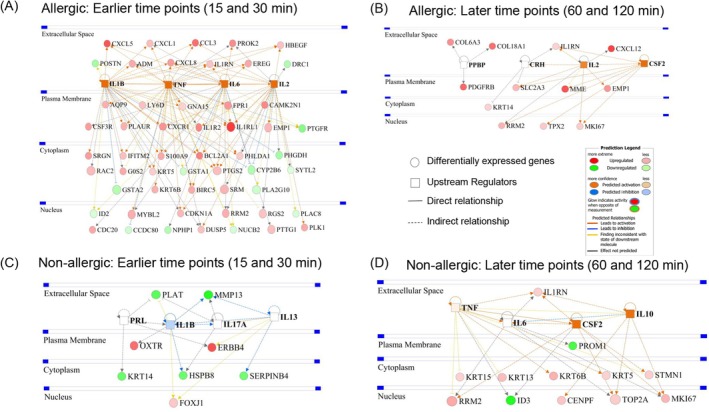
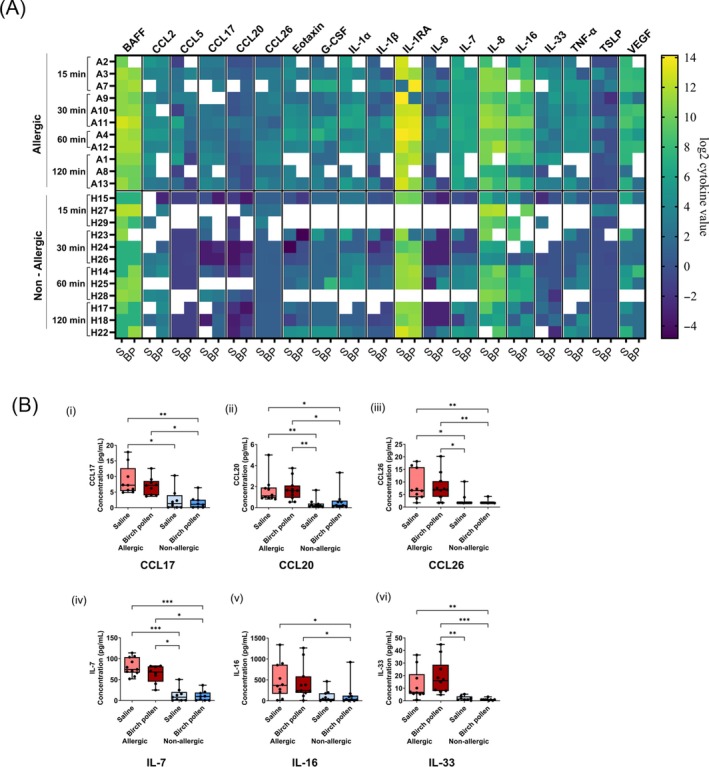
Results: After BP challenge, we identified 160 differentially expressed genes (DEGs) in the nasal scrapings of allergic individuals and 44 in non-allergic individuals. DEGs encoding S100 proteins, keratins, small proline-rich repeat proteins, and cytokines were predominantly identified, with proinflammatory cytokine transcripts being upregulated only in the allergic cohort. The top canonical pathways in allergic individuals included granulocyte and agranulocyte adhesion and diapedesis, wound healing, IL-8 signaling, and IL-17-related pathways. Enriched pathways in allergic participants were associated with granulocyte chemotaxis, humoral cell responses, and IL-10, IL-4, and IL-13 signaling and were absent in non-allergic individuals. At baseline and after BP challenge, higher amounts of CCL17, CCL20, CCL26, IL-7, IL-16, and IL-33 were detected in nasal secretions of allergic compared to non-allergic individuals.
Conclusion: Our results highlight the activation of important cellular signaling pathways specific to BP-allergic individuals after BP exposure offering new perspectives for studying key players in BP allergy.
Keywords: birch pollen allergy; cytokines; differentially expressed genes; nasal mucosa; nasal provocation.
© 2024 The Author(s). Allergy published by European Academy of Allergy and Clinical Immunology and John Wiley & Sons Ltd.
Conflict of interest statement
The authors declare no conflicts of interest.
Figures
Similar articles
-
Intranasal monoclonal antibodies to mugwort pollen reduce allergic inflammation in a mouse model of allergic rhinitis and asthma.Front Immunol. 2025 Jul 11;16:1595659. doi: 10.3389/fimmu.2025.1595659. eCollection 2025. Front Immunol. 2025. PMID: 40718489 Free PMC article.
-
Short-term preseasonal birch pollen allergoid immunotherapy influences symptoms, specific nasal provocation and cytokine levels in nasal secretions, but not peripheral T-cell responses, in patients with allergic rhinitis.Clin Exp Allergy. 1999 Oct;29(10):1326-35. doi: 10.1046/j.1365-2222.1999.00651.x. Clin Exp Allergy. 1999. PMID: 10520053 Clinical Trial.
-
Pollen derived low molecular compounds enhance the human allergen specific immune response in vivo.Clin Exp Allergy. 2016 Oct;46(10):1355-65. doi: 10.1111/cea.12739. Epub 2016 May 18. Clin Exp Allergy. 2016. PMID: 27061126
-
Positive allergen reaction in allergic and nonallergic rhinitis: a systematic review.Int Forum Allergy Rhinol. 2017 Sep;7(9):868-877. doi: 10.1002/alr.21988. Epub 2017 Jul 20. Int Forum Allergy Rhinol. 2017. PMID: 28727909
-
Saline irrigation for allergic rhinitis.Cochrane Database Syst Rev. 2018 Jun 22;6(6):CD012597. doi: 10.1002/14651858.CD012597.pub2. Cochrane Database Syst Rev. 2018. PMID: 29932206 Free PMC article.
References
-
- Biedermann T., Winther L., Till S. J., Panzner P., Knulst A., and Valovirta E., “Birch Pollen Allergy in Europe,” Allergy 74, no. 7 (2019): 1237–1248. - PubMed
-
- Lambrecht B. N. and Hammad H., “Allergens and the Airway Epithelium Response: Gateway to Allergic Sensitization,” Journal of Allergy and Clinical Immunology 134, no. 3 (2014): 499–507. - PubMed
-
- Akdis C. A., “Does the Epithelial Barrier Hypothesis Explain the Increase in Allergy, Autoimmunity and Other Chronic Conditions?,” Nature Reviews. Immunology 21, no. 11 (2021): 739–751. - PubMed
MeSH terms
Substances
Grants and funding
LinkOut - more resources
Full Text Sources
Medical
Molecular Biology Databases
Research Materials
Miscellaneous
