. 2024 Dec 24:13:RP96344.
doi: 10.7554/eLife.96344.

The satiety hormone cholecystokinin gates reproduction in fish by controlling gonadotropin secretion

Affiliations

The satiety hormone cholecystokinin gates reproduction in fish by controlling gonadotropin secretion

Lian Hollander-Cohen et al. Elife. .

Abstract

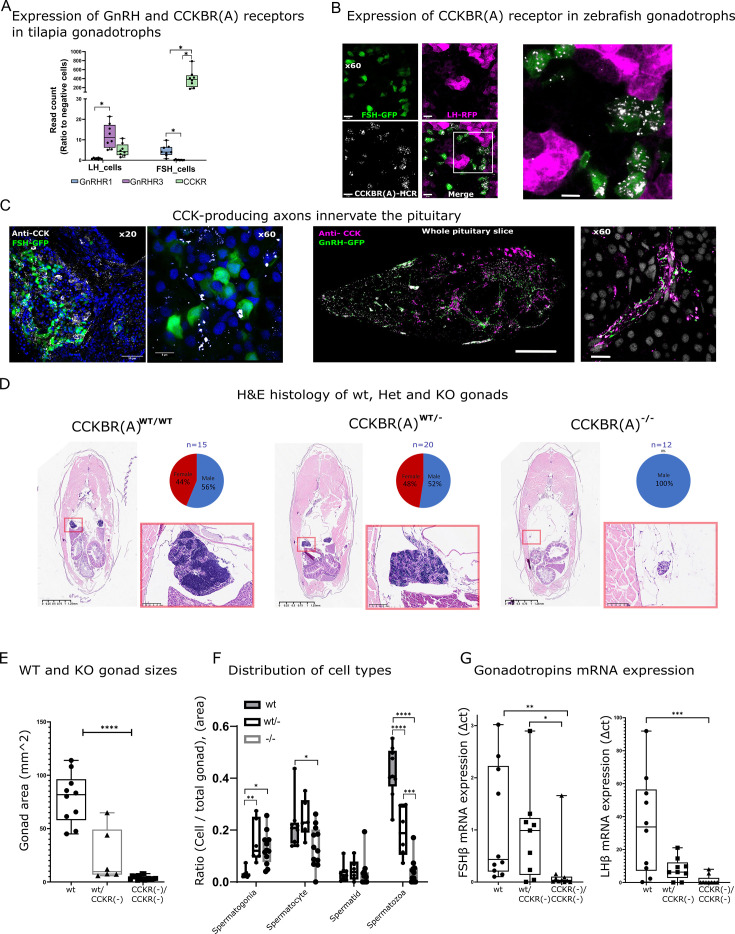
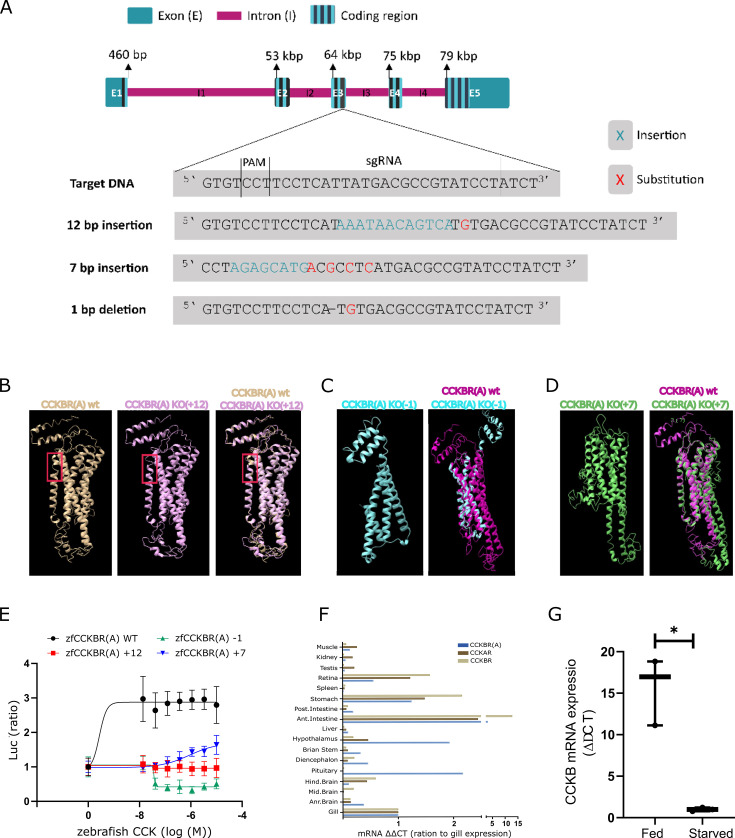
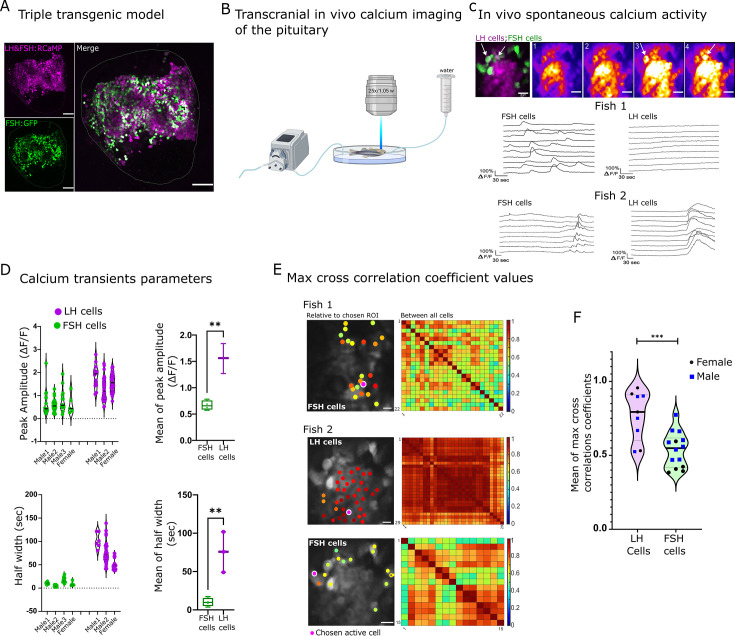
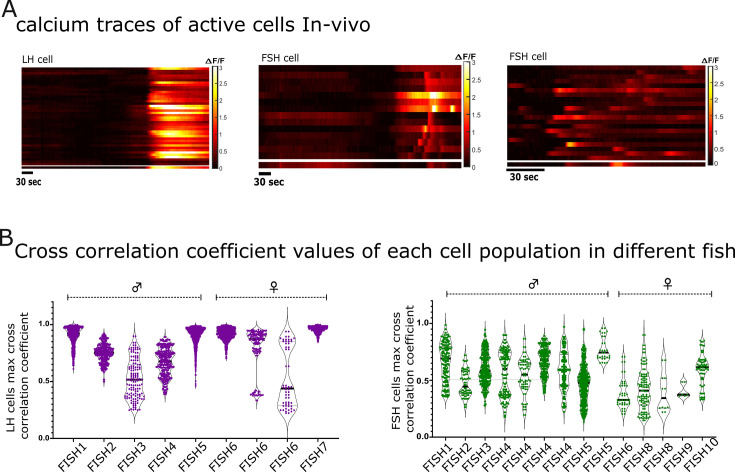
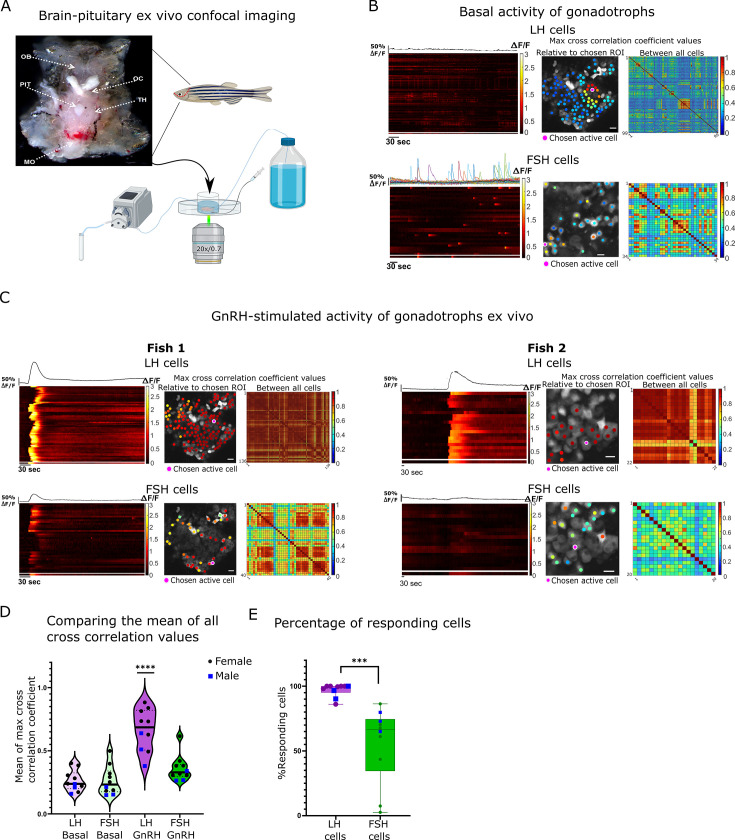
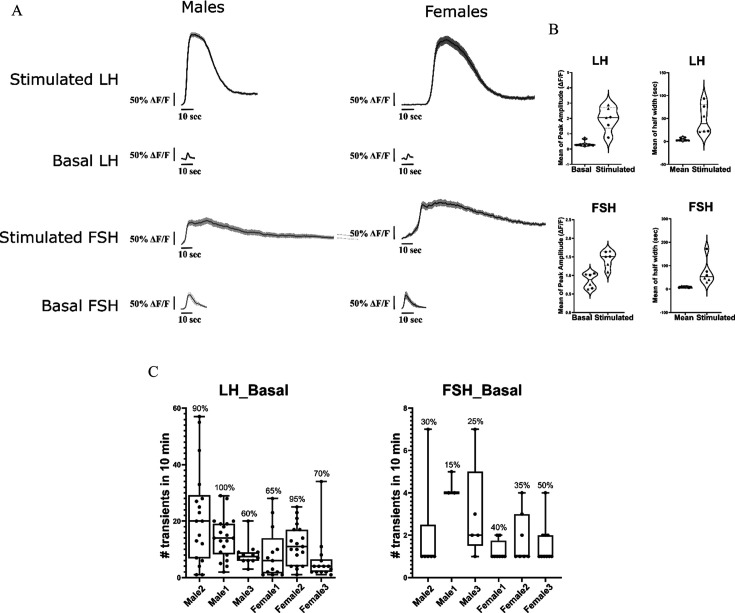
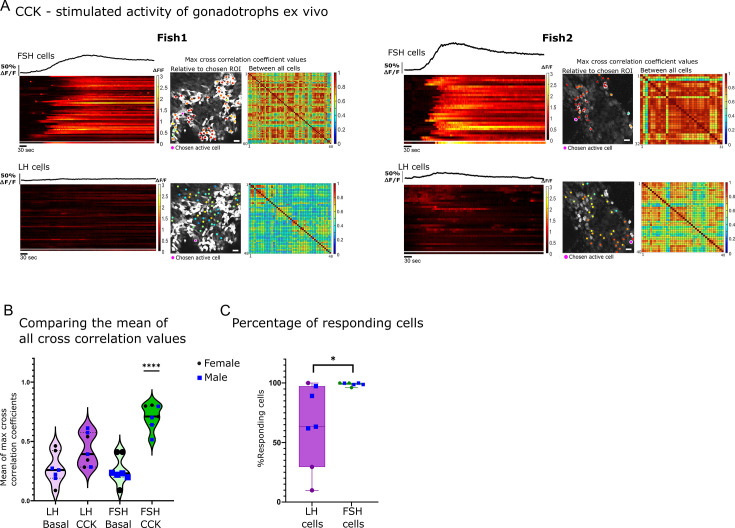
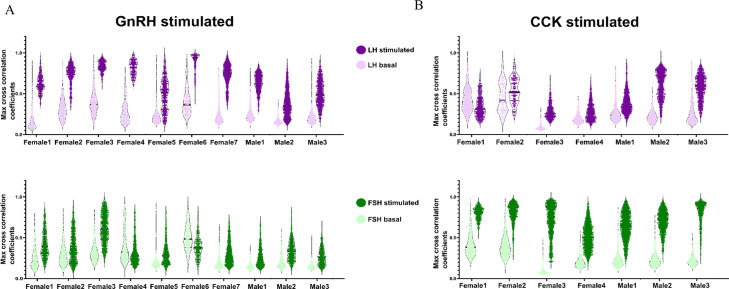
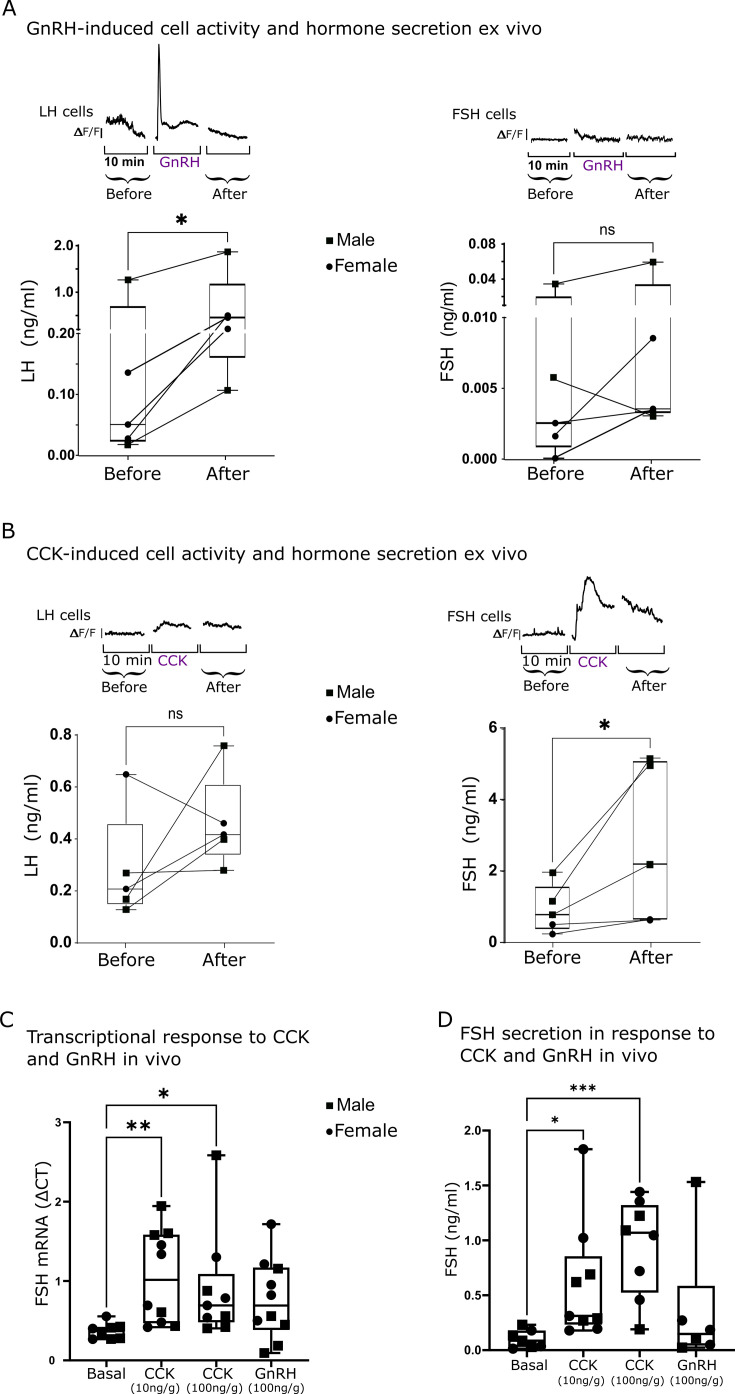
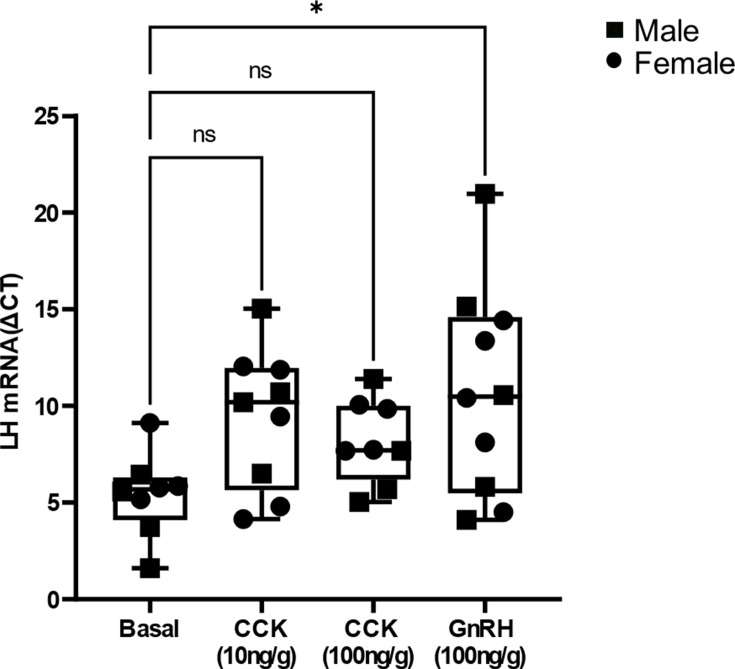
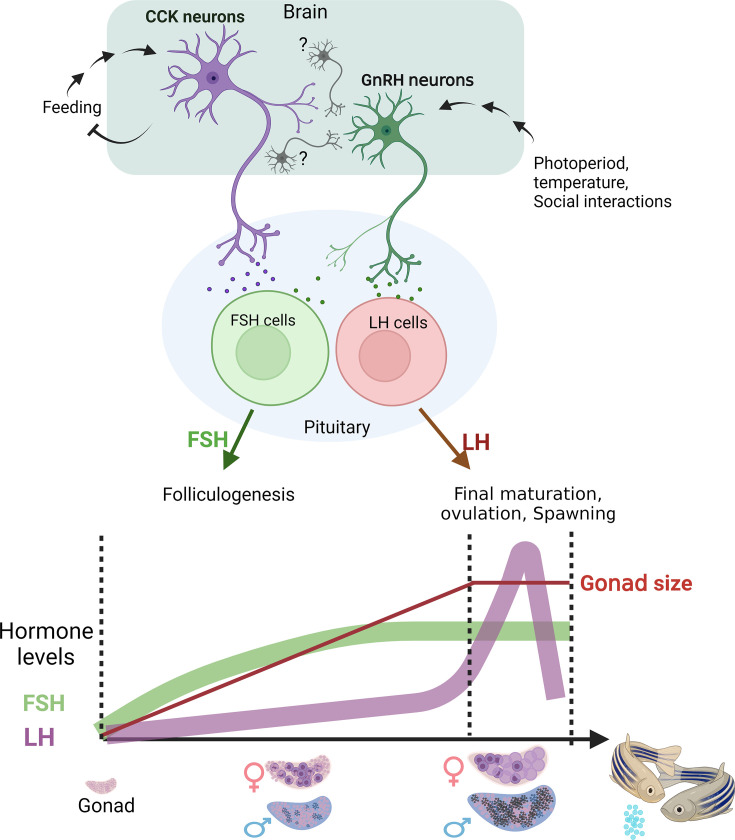
Life histories of oviparous species dictate high metabolic investment in the process of gonadal development leading to ovulation. In vertebrates, these two distinct processes are controlled by the gonadotropins follicle-stimulating hormone (FSH) and luteinizing hormone (LH), respectively. While it was suggested that a common secretagogue, gonadotropin-releasing hormone (GnRH), oversees both functions, the generation of loss-of-function fish challenged this view. Here, we reveal that the satiety hormone cholecystokinin (CCK) is the primary regulator of this axis in zebrafish. We found that FSH cells express a CCK receptor, and our findings demonstrate that mutating this receptor results in a severe hindrance to ovarian development. Additionally, it causes a complete shutdown of both gonadotropins secretion. Using in-vivo and ex-vivo calcium imaging of gonadotrophs, we show that GnRH predominantly activates LH cells, whereas FSH cells respond to CCK stimulation, designating CCK as the bona fide FSH secretagogue. These findings indicate that the control of gametogenesis in fish was placed under different neural circuits, that are gated by CCK.

Keywords: CCK; fsh; neuroscience; pituitary; reproduction; zebrafish.


Conflict of interest statement

LH, OC, MS, TA, PF, OR, PM, MG, BL No competing interests declared

Figures

Figure 1.
Figure 1.. Effect of CCKBR(A) loss-of-function mutation on gonadal development.
(A) Expression of CCKBR(A) and two identified gonadotropin-releasing hormone (GnRH) receptors in luteinizing hormone (LH) and Follicle-Stimulating Hormone (FSH) cells. Expression data were taken from a transcriptome of sorted pituitary cells of transgenic Nile tilapia Oreochromis niloticus, previously obtained by Hollander-Cohen et al., 2021. Each dot represents a FACS fraction from a bulk of 20 pituitaries (n=8, 4 groups of males and 4 groups of females). The expression of each gene in each cell type is normalised to its expression in non-gonadotroph pituitary cells. (two-way ANOVA, * p<0.05,). (B) RNA expression of CCKBR(A) (white) identified by hybridization chain reaction (HCR) in transgenic zebrafish pituitaries expressing RFP in LH cells (magenta) and GFP in FSH cells (green) (scale bar = 10 µm), the right panel is a magnification of the white square in the left panel. (C) Immunohistochemical staining of cholecystokinin (CCK) (white) in transgenic zebrafish expressing GFP in FSH cells (left panel, scale bar = 50 µm and 8 µm) or GFP in GnRH neurons (right panel, scale bar = 100 µm and 10 µm). In B and C, staining from adult fish was performed on whole head sections 15 µm thick. (D) H&E staining of body cross-sections (dorsoventral axis) of adult WT, heterozygous (CCKBR(A)wt/+12, CCKBR(A)wt/+7/, CCKBR(A)wt/-1), and KO zebrafish (CCKBR(A)+12/+12, CCKBR(A) +7/+7,CCKBR(A)-1/-1). An inset of the red square in each image on the right displays a magnified view of the gonad. On the top right of each panel is the sex distribution for each genotype. (E) Gonad areas of mutant zebrafish. (n((+/+),(+/-), (-/-))=10/6/17,one way ANOVA,, ****p<0.0001). (F) The distribution of cell types in the gonads of WT, heterozygous, and KO zebrafish. (n((+/+),(+/-), (-/-))=10/6/17, two-way ANOVA, *p<0.05, **p<0.001, ***p<0.0001,****p<0.00001). (G) Gonadotroph mRNA expression in the pituitaries of the three genotypes (n((wt/wt),(wt/-), (-/-))=10/8/9, one-way ANOVA, *p<0.05, **p<0.01, ***p<0.001).
Figure 1—figure supplement 1.
Figure 1—figure supplement 1.. Supporting evidence for CCKBRA activity, expression and loss of function in the CRISPR mutants.
(A) The three identified mutations induced by gRNA number two. The 7 bp insertion and 1 bp depletion created a frameshift that disrupted the translation of the RNA, while the 12 bp insertion added four amino acids that disrupted the structure of the CCKR transmembrane domain of the receptor. (B) The protein structure of the CCKR with the +12 insertion (pink) compared to the WT CCKR structure (brown). The +12 addition resulted in the incorporation of four additional amino acids, specifically two asparagine, one serine, and one histidine, at residue number 187–191. Notably, this mutation-induced alteration is evident in the figure, where the WT CCKR displays an intact alpha helix structure and the mutant cholecystokinin (CCK) receptor reveals a loss of this structural element. (C) The protein structure of the CCKR with a –1 nucleotide depletion (cyan) results in a frameshift, resulting in the addition of a premature stop codon at residue 187, terminating the translation at this point, compared to the 442 amino acids in the WT CCKR (magenta). (D) The protein structure of the CCKR with the addition of seven nucleotides at residue 174 (green), resulting in a frameshift and the introduction of a stop codon, thus yielding a receptor composed of 184 amino acids, contrasting the 442 amino acids in the WT receptor (magenta). All structures were created using the I-TASSER protein structure algorithm. (E) The CCK ligand stimulated WT CCKR but not the mutated receptors in a COS-7 reporter assay. Data are presented as mean  ± SEM of a representative experiment performed in triplicate. (F) Expression levels by real-time polymerase chain reaction (PCR) of CCKAR, CCKBR, and CCKBRA in various tissues of Nile tilapia Fish. The relative expression of mRNA in each tissue was normalized to the expression levels of ef1a by the comparative threshold cycle method, all expression levels were then normalized to the expression levels of the gill for each gene, respectively. (G) CCKB mRNA expression in the brain is significantly down-regulated in starved fish compared to fed fish (n=3, Paired t-test, *p<0.05).
Figure 2.
Figure 2.. Luteinizing hormone (LH) and follicle-stimulating hormone (FSH) cells exhibit distinct spontaneous activity patterns in vivo.
(A) A confocal image of the pituitary shows RCaMP2 expression in both cell types and GFP expression in FSH cells (scale bar = 100 µm). (B) A diagram describing the setup of the in vivo experiments. The dissected zebrafish were placed in a chamber with a constant flow of water to the gills and imaged in an upright two-photon microscopy. (C) A representative image of in vivo calcium activity (see Figure 2—video 3). On the top left is a merged image depicting FSH cells in green and LH cells in magenta. The other top panels show sequential calcium imaging calcium rise in FSH cells is marked by white arrows. The bottom panels show the calcium of LH and FSH cells in two different imaged pituitaries, one where only FSH cells were active (Fish 1) and another where both cell types were active (Fish 2, traces ΔF/F, see Figure 2—figure supplement 1A. for heatmap of the calcium traces, scale bar = 20 µm). (D) The properties of spontaneous calcium transients (ΔF/F) in LH cells and FSH cells in three males and one female and their means. (unpaired t-test, **p<0.001). Analysis was performed using pCLAMP 11. (E) Left: cross-correlation analysis between active ROI to the rest of the cell. The color-coded data points are superimposed on the imaged cells and represent the maximum cross-correlation coefficient between a calcium trace of a region of interest (ROI) and that of the rest of the cells in the same population. Right: is a matrix of maximum cross-correlation coefficient values between all the cells. (scale bar = 20 µm). (F) Summary of the mean max cross-correlation coefficient values of calcium traces in each cell population of repeated in vivo calcium imaging assays (n (calcium sessions)=16, see Figure 2—figure supplement 1B for all measurements,. unpaired t-test, ***p<0.0001).
Figure 2—figure supplement 1.
Figure 2—figure supplement 1.. Calcium activity and cross correlation of FSH and LH cells In vivo.
(A) Heatmap of calcium traces from a pituitary imaged in vivo. Each line represents a cell. (B) Graphs showing repeated measures of max cross-correlation coefficient values of luteinizing hormone (LH) and follicle-stimulating hormone (FSH) cell’s calcium activity.
Figure 3.
Figure 3.. Gonadotropin-releasing hormone (GnRH) induces a synchronized increase of calcium in all luteinizing hormone (LH) cells and partial increase in follicle-stimulating hormone (FSH) cells.
(A) Top: Image of a dissected head with pituitary exposed from the ventral side of the fish used for the ex vivo assays (OB, olfactory bulb; OC, optic chiasm; PIT, pituitary; TH, thalamus; MO, medulla oblongata). Bottom: A diagram describing the ex vivo setup with a constant flow of artificial cerebrospinal fluid (ACSF), a side tube to inject stimuli, and a collecting tube. (B) A representative analysis of basal calcium activity of LH and FSH cells. The left panel is a heatmap of calcium traces (ΔF/F), where each line represents a cell, with the mean calcium trace on top, the separated line at the bottom of each heatmap is the calcium trace of the chosen region of interest (ROI). The color-coded data points on the right are superimposed on the imaged cells and represent the maximum cross-correlation coefficient between a calcium trace of an active chosen ROI to those of the rest of the cells in the same population, the matrix on the right represent the maximum cross-correlation coefficient values between all the cells (see Figure 3—figure supplement 2 for additional cell activity parameters, scale bar = 20 µm). (C) An analysis of calcium response to GnRH stimulation in two representative imaging sessions, fish 1 where both LH and FSH cells respond, and fish 2 where only LH respond. (see Figure 4—figure supplement 1 for detailed coefficient values distribution in each fish, scale bar = 20 µm). (D) The mean of max cross-correlation coefficient values in each cell type under each treatment (n=10, 3 males, 7 females, one-way ANOVA, ****p<0.0001, see Figure 4—figure supplement 1A for cell-specific vlaues). (E) The percentage of cells responsive to GnRH stimulus (i.e. coefficient values higher than the 80 percentiles of basal values). Each dot represents one fish (n=10, 3 males, 7 females, unpaired t-test, ***p<0.001).
Figure 3—figure supplement 1.
Figure 3—figure supplement 1.. Calcium analysis of basal activity in luteinizing hormone (LH) cells reveals the synchronized spontaneous activity of small clamps of cells.
Color-coded data points of cross-correlation coefficients between all cells and a chosen region of interest (ROI) (pink dot). In each panel, a different ROI was chosen, and a few nearby cells with high cross-correlation values were seen.
Figure 3—figure supplement 2.
Figure 3—figure supplement 2.. Calcium signal properties of LH and FSH cells.
(A) Examples of basal and stimulated calcium transients in luteinizing hormone (LH) and follicle-stimulating hormone (FSH) cells of males and females. All transients are in the same scale of 50% ΔF/F and 10 sec. (B) The mean peak amplitude and half-width of each cell type, reflect the intensity and duration of transients. Each dot represents the mean of 20 cell traces in a single female (circles, n=3) or male (triangles, n=3) fish. (C) The number of identified transients in basal traces during a 10 min interval. On the top of each column is the percentage of active cells (i.e. cells in which transients were identified). Analysis was performed using pCLAMP 11 (molecular devices).
Figure 4.
Figure 4.. Follicle-stimulating hormone (FSH) cells are directly stimulated by cholecystokinin (CCK).
(A) Example of calcium analysis of FSH and luteinizing hormone (LH) cells during CCK stimulation: fish1 with only FSH cells responding, and fish2 with FSH and LH cells responding. For each fish, the left panels are a heatmaps of calcium traces (ΔF/F), where each line represents a cell. On top of each heatmap is a graph showing the mean calcium trace, the separated line at the bottom of the heat map is the calcium trace of the chosen region of interest (ROI). On the right are color-coded data points that are superimposed on the imaged cells, showing the maximum cross-correlation coefficient between a calcium trace of a chosen active ROI and those of the rest of the cells in the same population, next to it is a matrix of max cross-correlation coefficients between all the cells. (scale bar = 20 µm) (B) The mean of max cross-correlation coefficient values in each cell type (n=7, 4 males, 3 females, one-way ANOVA, ****p<0.0001, see Figure 4—figure supplement 1B for detailed coefficient values distribution in each fish). (C) The percentage of active cells (i.e. a coefficient value higher than the 80 percentiles of basal levels) during CCK stimulation. Each dot represents one fish (n=7, 4 males, 3 females, unpaired t-test, *p<0.05).
Figure 4—figure supplement 1.
Figure 4—figure supplement 1.. Max cross-correlation coefficient values between the calcium activity of all measured luteinizing hormone (LH) (magenta) or follicle-stimulating hormone (FSH) (green) cells in each fish.
(A) Compared basal activity to gonadotropin-releasing hormone (GnRH) stimulated activity. (B) Compared basal activity to cholecystokinin (CCK) stimulates activity.
Figure 5.
Figure 5.. The stimulated calcium activity of luteinizing hormone (LH) and follicle-stimulating hormone (FSH) cells is associated with hormone secretion.
(A and B) Top: Graphs showing the mean calcium trace of 10 LH cells (left panel) or FSH cells (right panel) from consecutive imaging sessions before, during, and after the application of the stimulus (gonadotropin-releasing hormone, GnRH or cholecystokinin, CCK). Bottom: Secretion of LH or FSH before or after GnRH (A) or CCK (B) stimulation (dots from the same imaged pituitaries are connected with a line; n=5, paired t-test, *p<0.05). (C) FSH mRNA transcription in the pituitary 2 hr after injection of CCK or GnRH into live fish (n=10, 5 females and 5 males, see Figure 5—figure supplement 1 for LH expression; one-way ANOVA, *p<0.05, **p<0.01). (D) FSH plasma levels after CCK or GnRH injection into live fish (n=10, 5 females and 5 males), (one-way ANOVA, *p<0.05, ***p<0.001).
Figure 5—figure supplement 1.
Figure 5—figure supplement 1.. Luteinizing hormone (LH) expression in the pituitary after in vivo injection of different concentrations of cholecystokinin (CCK) and gonadotropin-releasing hormone (GnRH).
Expression level increased significantly only in response to GnRH injection.
Figure 6.
Figure 6.. A model summarizing the two suggested regulatory axes controlling fish reproduction.
The satiety-regulated cholecystokinin (CCK) neurons activate follicle-stimulating hormone (FSH) cells. luteinizing hormone (LH) cells are directly regulated by gonadotropin-releasing hormone GnRH neurons that are gated by CCK, photoperiod, temperature, and behaviour, eventually leading to final maturation and ovulation. Bottom image schematically represents the relative timescale of the two processes and the associated gonadotropin levels. Created with BioRender.com/q88k105.

Update of

  • doi: 10.1101/2023.06.18.545454
  • doi: 10.7554/eLife.96344.1
  • doi: 10.7554/eLife.96344.2

Similar articles

Cited by

References

    1. Anderson JL, Asche F, Garlock T, Chu J. Aquaculture: Its Role in the Future of Food. World Agricultural Resources and Food Security. Emerald Publishing Limited; 2017. - DOI
    1. Aroua S, Maugars G, Jeng SR, Chang CF, Weltzien FA, Rousseau K, Dufour S. Pituitary gonadotropins FSH and LH are oppositely regulated by the activin/follistatin system in a basal teleost, the eel. General and Comparative Endocrinology. 2012;175:82–91. doi: 10.1016/j.ygcen.2011.10.002. - DOI - PubMed
    1. Belchetz PE, Plant TM, Nakai Y, Keogh EJ, Knobil E. Hypophysial responses to continuous and intermittent delivery of hypopthalamic gonadotropin-releasing hormone. Science. 1978;202:631–633. doi: 10.1126/science.100883. - DOI - PubMed
    1. Biran J, Ben-Dor S, Levavi-Sivan B. Molecular identification and functional characterization of the kisspeptin/kisspeptin receptor system in lower vertebrates. Biology of Reproduction. 2008;79:776–786. doi: 10.1095/biolreprod.107.066266. - DOI - PubMed
    1. Biran J, Palevitch O, Ben-Dor S, Levavi Sivan B. Neurokinin B and neurokinin B receptor: a novel system involved in controlling fish reproduction. PNAS. 2012;109:10269–10274. - PMC - PubMed

MeSH terms

Associated data

LinkOut - more resources