

Prognostic Value of N1/N2 Neutrophils Heterogeneity and Tertiary Lymphoid Structure in Hepatocellular Carcinoma Patients
- PMID: 39718130
- PMCID: PMC11667523
- DOI: 10.1002/cam4.70551
Prognostic Value of N1/N2 Neutrophils Heterogeneity and Tertiary Lymphoid Structure in Hepatocellular Carcinoma Patients
Abstract
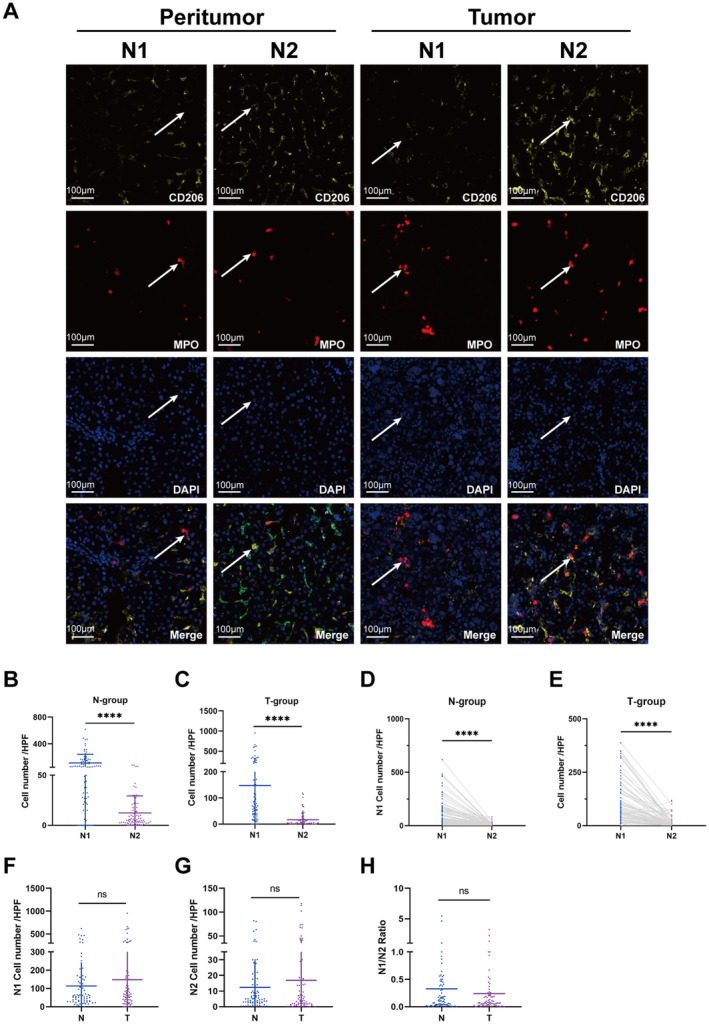
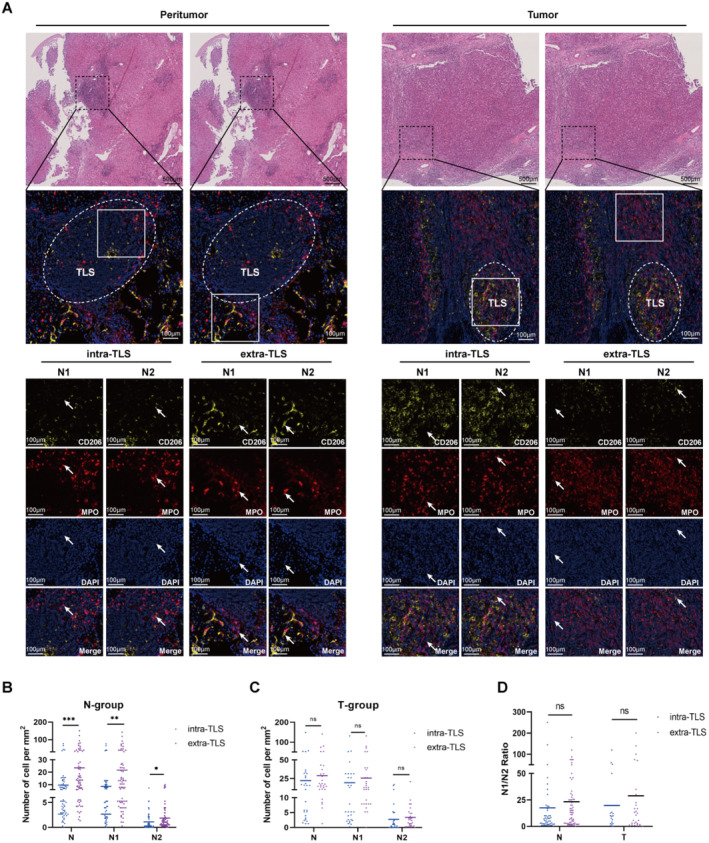
Background: The tumor immune microenvironment, including neutrophils and tertiary lymphoid structures (TLSs), is pivotal for HCC prognosis assessment. Tumor-associated neutrophils exhibit plasticity, adopting either an antitumorigenic N1 (MPO+ CD206-) or a pro-tumorigenic N2 (MPO+ CD206+) phenotype. We explored the prognostic value of neutrophil plasticity and TLS maturity in HCC in both tumor and peritumoral tissues and addressed their interaction.
Methods: A retrospective cohort of 79 HCC patients who underwent radical resection from 2015 to 2018 was analyzed, with complete clinical characteristics and survival data of more than 5 years. Multiplex immunohistochemistry identified N1/N2 neutrophils and TLS maturity. Survival differences and correlations with clinical features were assessed.
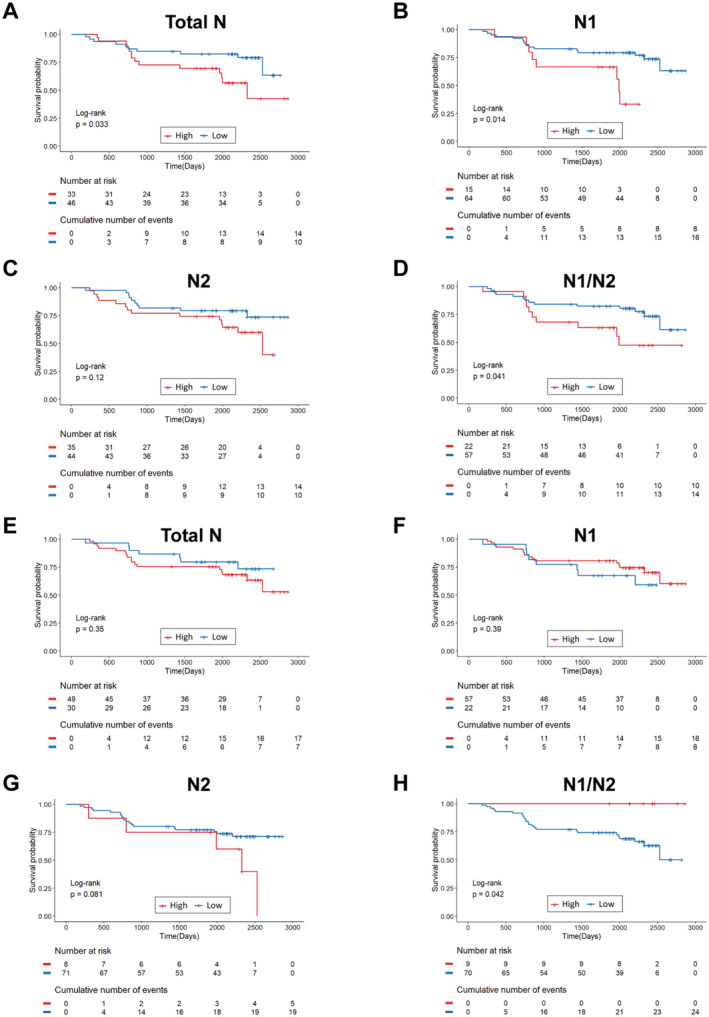
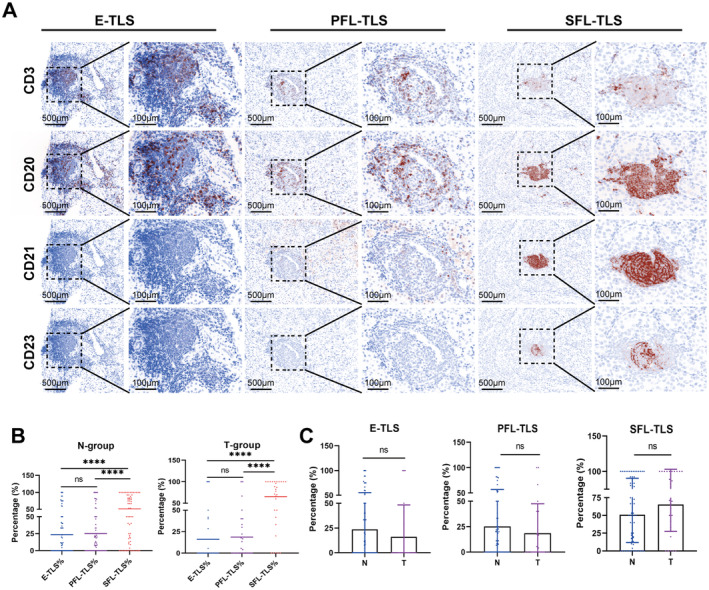
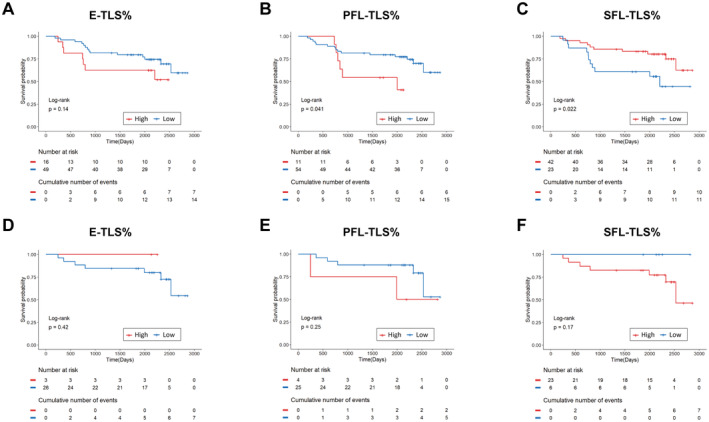
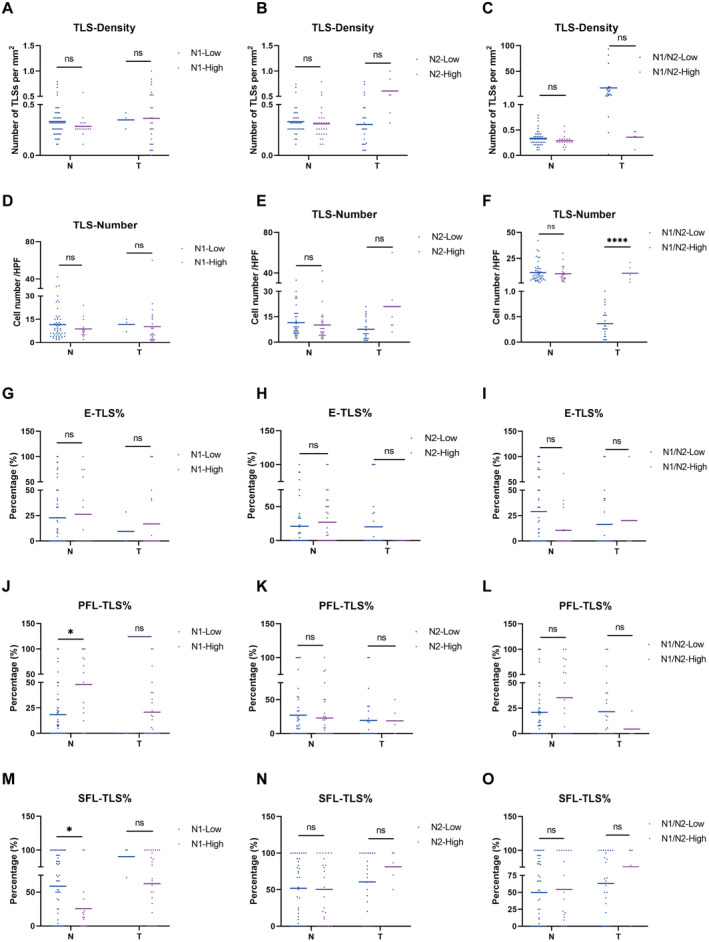
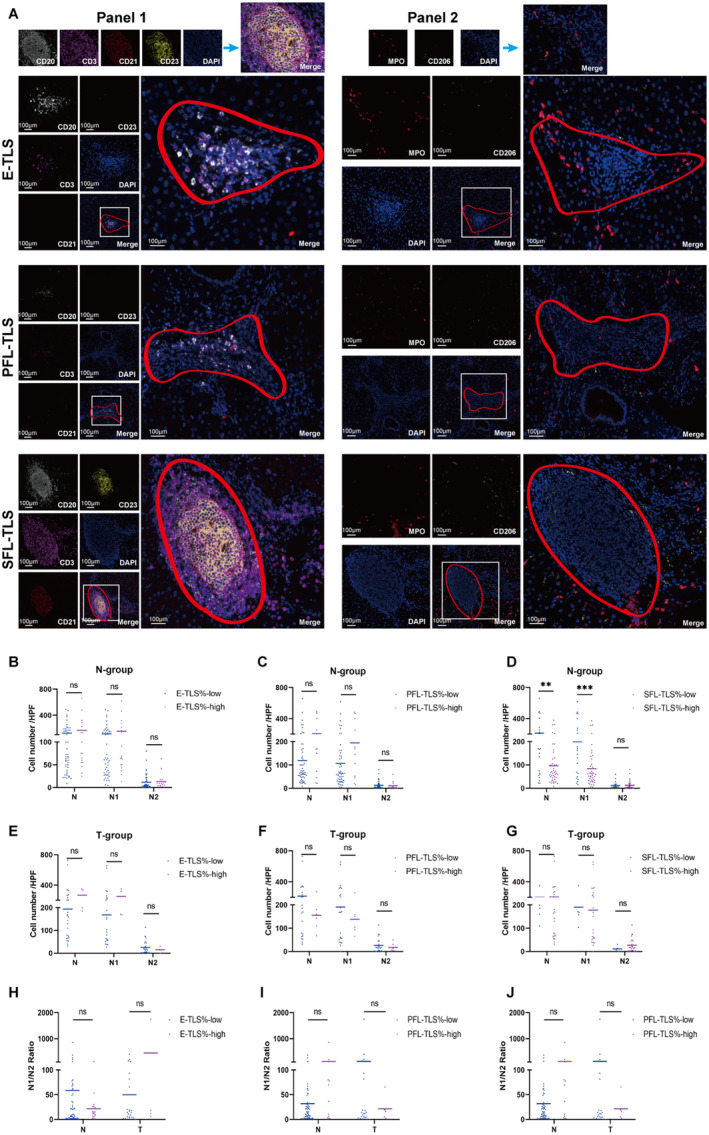
Results: HCC patients were divided into high- and low-level groups on the basis of the N1 and N2 classifications of neutrophils, revealing a positive correlation with prognosis in tumor tissues and a negative one in peritumoral tissues. TLS maturity stages were associated with prognosis, with a higher proportion of secondary TLS (SFL-TLS) in peritumoral tissues correlating positively with survival. Further analysis of the correlation between neutrophils and TLSs revealed that most neutrophils infiltrated outside of the TLS in the peritumoral tissues of patients with HCC, and the proportions of SFL-TLSs and N1 cells in the peritumoral tissue were negatively correlated and positively correlated with survival. Both univariate and multivariate analyses revealed that the N1/N2 ratio in peritumoral tissues was an independent prognostic predictor of HCC.
Conclusions: The N1/N2 ratio of neutrophils and the proportion of SFL-TLS are considered important prognostic indicators that may reflect the immune microenvironment of HCC patients.
Keywords: hepatocellular carcinoma; neutrophil; prognosis; secondary follicle‐like TLS; tertiary lymphoid structure.
© 2024 The Author(s). Cancer Medicine published by John Wiley & Sons Ltd.
Conflict of interest statement
The authors declare no conflicts of interest.
Figures
Similar articles
-
Intra-tumoral tertiary lymphoid structures are associated with a low risk of early recurrence of hepatocellular carcinoma.J Hepatol. 2019 Jan;70(1):58-65. doi: 10.1016/j.jhep.2018.09.003. Epub 2018 Sep 11. J Hepatol. 2019. PMID: 30213589
-
Lymphocyte Function in Tertiary Lymphoid Structures Predicts Hepatocellular Carcinoma Outcome.Lab Invest. 2024 Nov;104(11):102144. doi: 10.1016/j.labinv.2024.102144. Epub 2024 Sep 27. Lab Invest. 2024. PMID: 39343010
-
Existence of intratumoral tertiary lymphoid structures is associated with immune cells infiltration and predicts better prognosis in early-stage hepatocellular carcinoma.Aging (Albany NY). 2020 Feb 22;12(4):3451-3472. doi: 10.18632/aging.102821. Epub 2020 Feb 22. Aging (Albany NY). 2020. PMID: 32087064 Free PMC article.
-
Prognostic value of tertiary lymphoid structures in hepatocellular carcinoma: a meta-analysis and systematic review.Front Immunol. 2024 Jun 3;15:1390938. doi: 10.3389/fimmu.2024.1390938. eCollection 2024. Front Immunol. 2024. PMID: 38887293 Free PMC article.
-
From heterogeneity to prognosis: understanding the complexity of tertiary lymphoid structures in tumors.Mol Biol Rep. 2025 Feb 4;52(1):197. doi: 10.1007/s11033-025-10319-3. Mol Biol Rep. 2025. PMID: 39903372 Review.
Cited by
-
Noninvasive MRI imaging feature-based prediction of intratumoral tertiary lymphoid structure maturity in hepatocellular carcinoma: a multicenter retrospective study.Eur Radiol. 2025 Aug 6. doi: 10.1007/s00330-025-11902-9. Online ahead of print. Eur Radiol. 2025. PMID: 40767869
References
MeSH terms
Associated data
- Actions
Grants and funding
LinkOut - more resources
Full Text Sources
Medical
Research Materials
Miscellaneous
