. 2025 Jan 14;97(1):290-299.
doi: 10.1021/acs.analchem.4c04188. Epub 2024 Dec 24.

Ultrasensitive Protein Aggregate Quantification Assays for Neurodegenerative Diseases on the Simoa Platform

Affiliations

Ultrasensitive Protein Aggregate Quantification Assays for Neurodegenerative Diseases on the Simoa Platform

Dorothea Böken et al. Anal Chem. .

Erratum in

Abstract

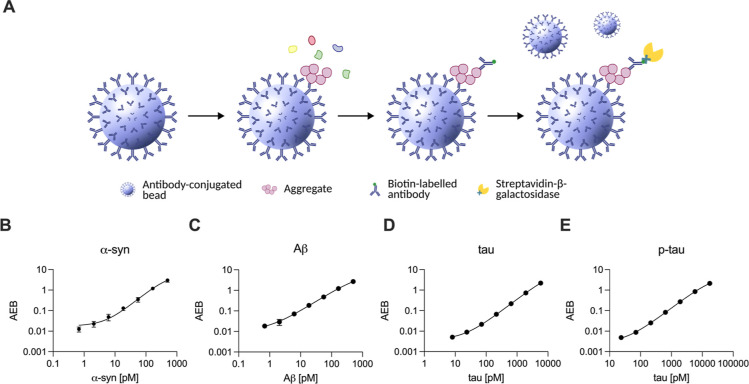
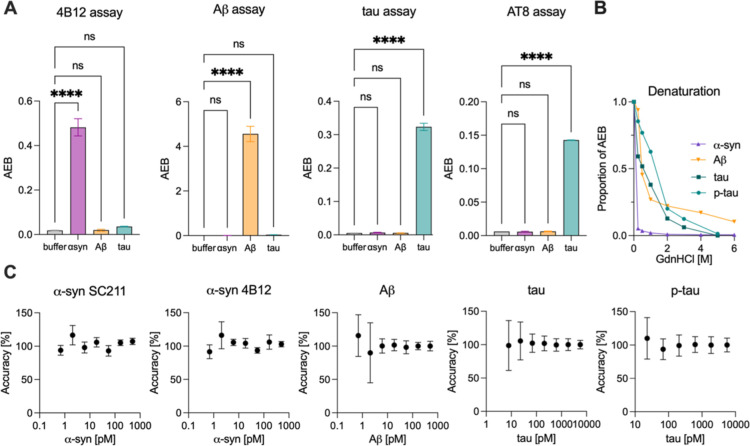
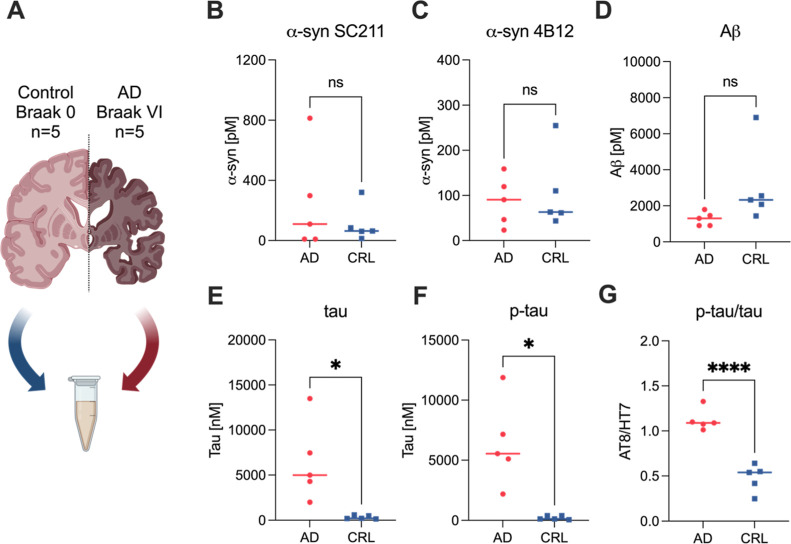
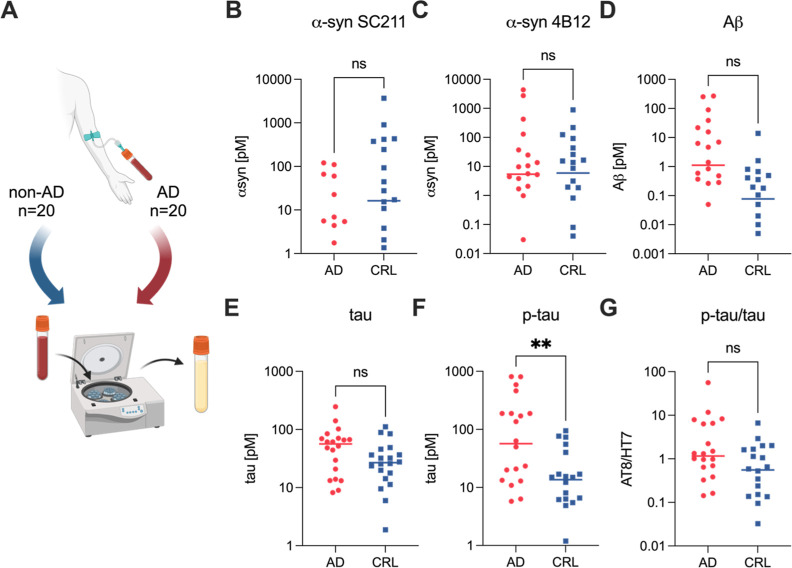
Nanoscale aggregates play a key role in the pathogenesis of neurodegenerative disorders such as Alzheimer's and Parkinson's disease. However, quantifying these aggregates in complex biological samples, such as biofluids and postmortem brain tissue, has been challenging due to their low concentration and small size, necessitating the development of methods with high sensitivity and specificity. Here, we have developed ultrasensitive assays utilizing the Quanterix Simoa platform to detect α-synuclein, β-amyloid and tau aggregates, including those with common posttranslational modifications such as truncation of α-synuclein and AT8 phosphorylation of tau aggregates. All assays had a detection limit in the low pM range. As a part of this work, we developed silica-nanoparticle calibrators, allowing for the quantification of all aggregates. These assays were validated for aggregate and target specificity through denaturation and cross-reactivity experiments. We then applied these assays to brain homogenate samples from Alzheimer's disease and control samples, demonstrating their applicability to postmortem tissue. Lastly, we explored the potential of these assays for blood-based diagnostics by detecting aggregates in serum samples from early Alzheimer's disease patients.


Conflict of interest statement

The authors declare the following competing financial interest(s): D.B., M.R.C., E. F., D.K., J.Y.L.L., Y.W. and Z.X. are are inventors on patents filed based on this work.

Figures

Figure 1
Figure 1
Simoa for the detection of protein aggregates. (A) Schematic representation of the Simoa assay for aggregate detection using the same monoclonal antibody for capture and detection to ensure aggregate detection. Antibody-conjugated paramagnetic beads are used to capture protein aggregates present in a sample. Upon the addition of biotin-labeled antibody an immunocomplex is formed, which can be bound by streptavidin-β-galactosidase, capable of generating fluorescent product. At low concentrations, each bead captures a maximum of a single aggregate. (B) Standard curve of α-syn calibrator using the 4B12–4B12 antibody pair. (C) Standard curve of Aβcalibrator using the 6E10–6E10 antibody pair. (D) Standard curve of tau lysate calibrator using the HT7–HT7 antibody pair. (E) Standard curve of tau lysate calibrator using the AT8–AT8 antibody pair. Panel B–E show the mean of n = 4 technical replicates.
Figure 2
Figure 2
Validation of Simoa assays for the detection of protein aggregates. (A) Simoa assays were tested for cross-reactivity against other protein aggregates to ensure specificity for the respective aggregate. (B) Denaturation of the aggregates with increasing concentrations of guanidinium chloride (0–6 M) to test the specificity of the Simoa assays for protein aggregates as opposed to monomers. (C) Accuracy of the aggregate assays across the working range for α-syn aggregates (4B12 antibody pair), Aβ aggregates (6E10 antibody pair), tau aggregates (HT7 antibody pair), p-tau aggregates (AT8 antibody pair). Statistical analysis was conducted using one-way ANOVA and Tukey’s multiple comparisons test. Panel A shows the mean ± SD of n = 3, B of n = 2, and C of n = 4 technical replicates. ns: p > 0.05, ****: p < 0.0001.
Figure 3
Figure 3
Aggregate levels in brain homogenate from AD and control patients. (A) Schematic of postmortem brain tissue samples used in the study. (B–G) Aggregate levels detected in brain homogenate from AD (frontal cortex, Braak Stage VI) and control patients (frontal cortex, Braak Stage 0) using aggregate Simoa assays for (B) α-synuclein aggregates (SC211 antibody pair), (C) α-synuclein aggregates (4B12 antibody pair), (D) Aβ aggregates (6E10 antibody pair), (E) tau aggregates (HT7 antibody pair), (F) p-tau aggregates (AT8 antibody pair). (G) The ratio of p-tau to total tau aggregates was determined showing improved separation between AD and control patients. Each data point in the plot represents the mean of 2 technical replicates. Panel A–G show the mean of n = 5 AD and n = 5 control patients from n = 2 technical replicates. Statistical analysis was conducted using Welch’s t-test. ns: p > 0.05, *: p < 0.05, ****: p < 0.0001. Figure A was created using BioRender.com.
Figure 4
Figure 4
Quantification of protein aggregates in human serum. (A) Schematic of serum samples used in this study. Patients with early AD includes patients who sought medical advice at a memory clinic for the first time and were diagnosed for AD based on the positive AD CSF biomarker profile. (B–F) Aggregate levels detected in the serum of early AD and control patients using aggregate Simoa assays for (B) α-synuclein aggregates (SC211 antibody pair, 15 data points not shown on graph due to values being zero), (C) α-synuclein aggregates (4B12 antibody pair), (D) Aβ aggregates (6E10 antibody pair), (E) tau aggregates (HT7 antibody pair), (F) p-tau aggregates (AT8 antibody pair). (G) Ratio of p-tau to total tau aggregates. Each data point in the plot represents the mean of 2 technical replicates. Panel B–G show the mean ± SD of n = 20 AD and n = 20 control patients. Statistical analysis was conducted using a t-test. ns: p > 0.05, **: p < 0.01. Figure A was created using BioRender.com.

Similar articles

Cited by

References

    1. Ross C. A.; Poirier M. A. Protein Aggregation and Neurodegenerative Disease. Nat. Med. 2004, 10 (Suppl), S10–S17. 10.1038/nm1066. - DOI - PubMed
    1. Tsoi P. S.; Quan M. D.; Ferreon J. C.; Ferreon A. C. M. Aggregation of Disordered Proteins Associated with Neurodegeneration. Int. J. Mol. Sci. 2023, 24 (4), 3380.10.3390/ijms24043380. - DOI - PMC - PubMed
    1. Armstrong R. A. Plaques and Tangles and the Pathogenesis of Alzheimer’s Disease. Folia Neuropathol. 2006, 44 (1), 1–11. - PubMed
    1. Spillantini M. G.; Schmidt M. L.; Lee V. M. Y.; Trojanowski J. Q.; Jakes R.; Goedert M. Alpha-Synuclein in Lewy Bodies. Nature 1997, 388 (6645), 839–840. 10.1038/42166. - DOI - PubMed
    1. De S.; Wirthensohn D. C.; Flagmeier P.; Hughes C.; Aprile F. A.; Ruggeri F. S.; Whiten D. R.; Emin D.; Xia Z.; Varela J. A.; Sormanni P.; Kundel F.; Knowles T. P. J.; Dobson C. M.; Bryant C.; Vendruscolo M.; Klenerman D. Different Soluble Aggregates of Aβ42 Can Give Rise to Cellular Toxicity through Different Mechanisms. Nat. Commun. 2019, 10 (1), 1–11. 10.1038/s41467-019-09477-3. - DOI - PMC - PubMed

MeSH terms