. 2024 Dec 24;57(1):3.
doi: 10.1007/s00726-024-03433-2.

Comprehensive analysis of peripheral blood free amino acids in MASLD: the impact of glycine-serine-threonine metabolism

Affiliations

Comprehensive analysis of peripheral blood free amino acids in MASLD: the impact of glycine-serine-threonine metabolism

Masaaki Mino et al. Amino Acids. .

Abstract

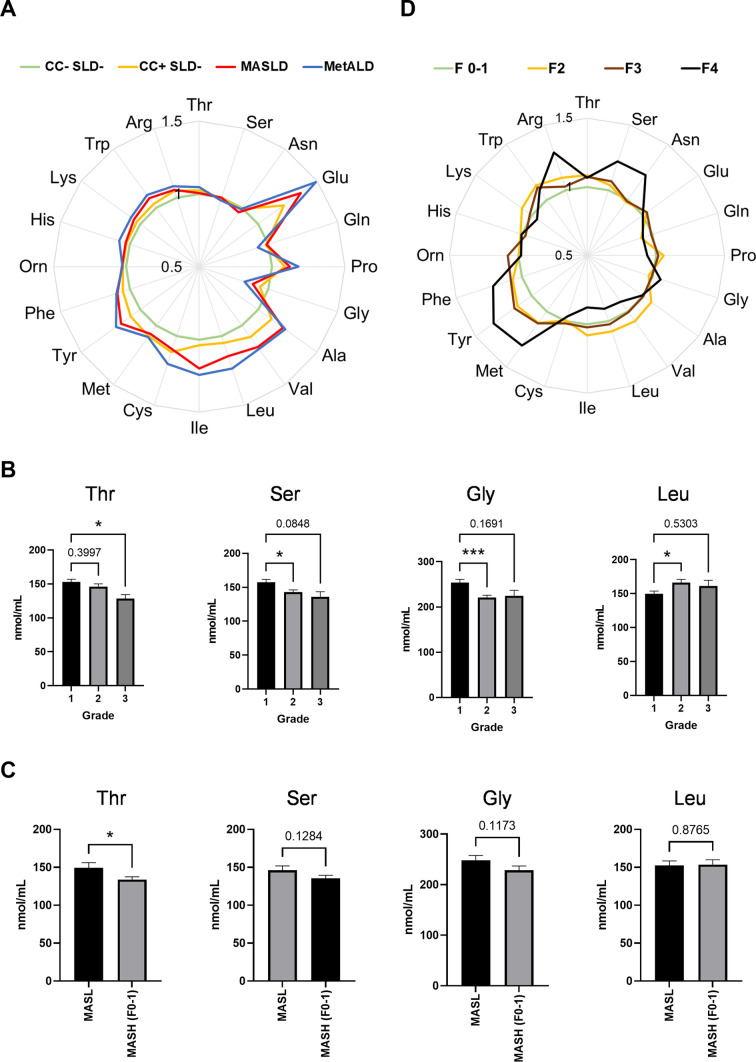
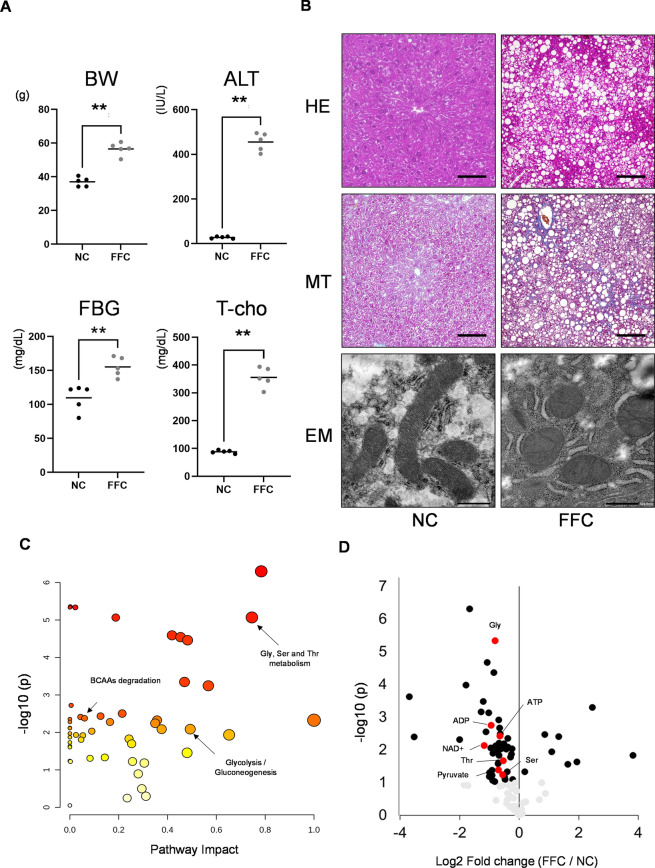
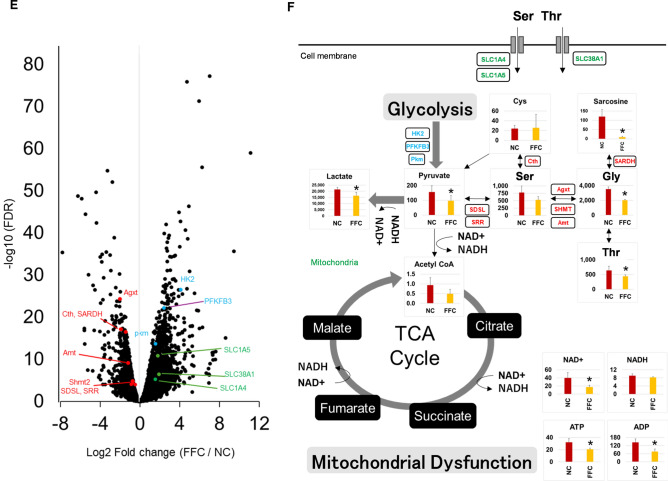
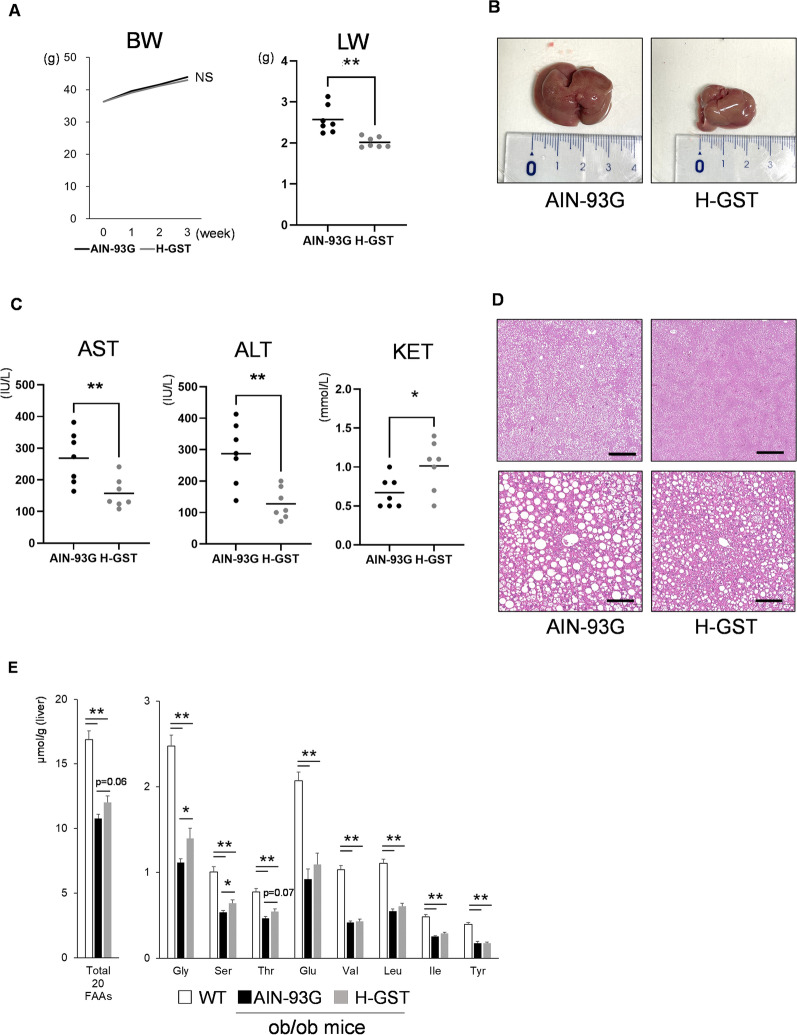
Little is known about how blood free amino acids (FAAs) change in metabolic dysfunction-associated steatotic liver disease (MASLD). This study aims to identify the imbalance of FAAs in MASLD and explore its correction as a potential therapeutic target. We analyzed plasma FAAs data from 23,036 individuals with steatosis information from a biobank in Japan, and 310 patients with MASLD were enrolled. According to diagnostic criteria for steatotic liver disease (SLD) or cardiometabolic criteria (CC), we divided the subjects into five groups: MASLD, metabolic dysfunction and alcohol-associated liver disease (MetALD), CC-SLD-, CC + SLD-, and CC-SLD + . Twenty FAAs were compared among these groups and among MASLD patients with pathological information. Among the 20 FAAs, the levels of 16 FAAs increased in CC + SLD- according to the number of matches with CC items associated with insulin resistance (IR). Steatosis enhanced most of these changes but serine (Ser) and threonine (Thr) were unaffected. Glycine (Gly), Ser and Thr were significantly decreased in patients according to steatosis grade. We investigated the association between these FAAs imbalances and pathogenesis using MASLD mouse models. In mice fed a high-fat, fructose, and cholesterol (FFC) diet, metabolomics and RNA sequencing analyses indicated that abnormality in Gly, Ser, and Thr metabolism in the liver was associated with mitochondrial dysfunction and enhanced glycolysis via pyruvate. High-Gly, Ser, and Thr diet ameliorated pathogenesis of MASLD in leptin-deficient mice. Most FAAs increase due to cardiometabolic abnormalities, particularly IR. However, interventions targeting the metabolism of Gly, Ser, and Thr have the potential to improve MASLD.

Keywords: Cardiometabolic criteria; MASH; MetALD; NASH; SLD.


Conflict of interest statement

Declarations. Conflicts of interest: The authors declare no competing interests.

Figures

Fig. 1
Fig. 1
FAAs profile in peripheral blood of MASLD and the changes according to pathological features. A A radar chart of 20 plasma FAAs in general adults was presented. The axis indicates fold change relative to CC-SLD-. The light green, yellow, red, and blue lines represent CC-SLD-, CC + SLD-, MASLD, and MetALD, respectively. B The concentrations of four FAAs were compared according to steatosis grade in patients diagnosed by biopsy (n = 170) and p values were presented by steatosis grade. *p < 0.05, ***p < 0.001, vs. grade 1. C The concentrations of 4 FAAs were compared between MASLD and early MASH (Fibrosis stage 0 or 1). MASH was defined as patients with a fibrosis stage ≥ 2 or a NAS ≥ 4, and all others were defined as MASL. MASL; n = 27, early MASH; n = 30. The p values were presented. *p < 0.05. D A radar chart of 20 plasma FAAs was presented according to fibrosis stages in MASLD. The axis indicates fold change relative to F 0–1 (no fibrosis and F1). The light green, yellow, brown, and black lines represent F 0–1, F2, F3, and F4 (cirrhosis), respectively. FAAs free amino acids, CC-SLD- Cardiometabolic criteria negative and steatotic liver disease negative, CC + SLD- Cardiometabolic criteria positive and steatotic liver disease negative, MASLD metabolic dysfunction-associated steatotic liver disease, MetALD metabolic dysfunction and alcohol-associated liver disease, MASL metabolic dysfunction-associated steatotic liver, MASH metabolic dysfunction-associated steatohepatitis
Fig. 2
Fig. 2
The FFC diet induced an imbalance of FAAs and mitochondrial dysfunction in the mouse liver. A The comparison of MASLD phenotypes between normal chow (NC) diet and high-fat, fructose and cholesterol (FFC) diet. BW body weight, ALT alanine aminotransferase. FBG fasting blood glucose, T-cho total cholesterol. B Upper images were hematoxylin–eosin (HE) staining. Middle images were Masson’s trichrome (MT) staining. Scale bar: 200 μm. Bottom images were electron microscopy (EM) images. Scale bar: 500 nm. C Metabolic pathway analysis. Vertical axis: p value by logarithmic scale. Horizontal axis: pathway impact values were calculated from pathway topology analysis by MetaboAnalyst. The node color was based on its p value and the node size was determined based on their pathway impact values. Detailed information regarding the analysis is provided in the supplementary information. D Volcano plot of metabolite differences in liver between NC and FFC diet. Red dots indicate representative metabolites in Fig. 2F. Red and Black dots were significantly different (p < 0.01) between NC and FFC diet, but gray dots were not significant. E Volcano plot of RNA-seq in liver tissue between NC and FFC diet. Red dots represent the enzyme genes mediating the metabolism of Gly, Ser, and Thr. Blue dots indicate the enzyme genes mediating glycolysis. Green dots represent the genes of Ser and Thr transporters. F A metabolic pathway diagram integrating metabolome analysis and RNA-seq results. Vertical axis units of each graph are nmol/ g (liver tissue). * p < 0.05
Fig. 2
Fig. 2
The FFC diet induced an imbalance of FAAs and mitochondrial dysfunction in the mouse liver. A The comparison of MASLD phenotypes between normal chow (NC) diet and high-fat, fructose and cholesterol (FFC) diet. BW body weight, ALT alanine aminotransferase. FBG fasting blood glucose, T-cho total cholesterol. B Upper images were hematoxylin–eosin (HE) staining. Middle images were Masson’s trichrome (MT) staining. Scale bar: 200 μm. Bottom images were electron microscopy (EM) images. Scale bar: 500 nm. C Metabolic pathway analysis. Vertical axis: p value by logarithmic scale. Horizontal axis: pathway impact values were calculated from pathway topology analysis by MetaboAnalyst. The node color was based on its p value and the node size was determined based on their pathway impact values. Detailed information regarding the analysis is provided in the supplementary information. D Volcano plot of metabolite differences in liver between NC and FFC diet. Red dots indicate representative metabolites in Fig. 2F. Red and Black dots were significantly different (p < 0.01) between NC and FFC diet, but gray dots were not significant. E Volcano plot of RNA-seq in liver tissue between NC and FFC diet. Red dots represent the enzyme genes mediating the metabolism of Gly, Ser, and Thr. Blue dots indicate the enzyme genes mediating glycolysis. Green dots represent the genes of Ser and Thr transporters. F A metabolic pathway diagram integrating metabolome analysis and RNA-seq results. Vertical axis units of each graph are nmol/ g (liver tissue). * p < 0.05
Fig. 3
Fig. 3
The high Gly, Ser and Thr (H-GST) diet ameliorated the pathogenesis of MASLD in mice. A Left graph: Body weight (BW) gain of mice fed AIN-93G and H-GST. NS not significant. Right graph: Comparison of liver weight (LW) between each diet. B Macroscopic appearance of each liver. C Biochemical data of plasma in each fed mouse. KET: ketone body (D) Images were hematoxylin–eosin (HE) staining. Scale bar: 1 mm (upper images) and 200 μm (bottom images). E Comparison of the concentration of free amino acids (FAAs) in the liver among 9-weeks-old wild-type (WT) mice, ob/ob mice fed AIN-93G, and ob/ob mice fed H-GST diet for three weeks. A, C, E *p < 0.05, **p < 0.01

References

    1. Bedogni G, Bellentani S, Miglioli L et al (2006) The fatty liver index: a simple and accurate predictor of hepatic steatosis in the general population. BMC Gastroenterol 6:33 - PMC - PubMed
    1. Brunt EM, Kleiner DE, Wilson LA et al (2011) Nonalcoholic fatty liver disease (NAFLD) activity score and the histopathologic diagnosis in NAFLD: distinct clinicopathologic meanings. Hepatology 53:810–820 - PMC - PubMed
    1. Charlton M, Krishnan A, Viker K et al (2011) Fast food diet mouse: novel small animal model of NASH with ballooning, progressive fibrosis, and high physiological fidelity to the human condition. Am J Physiol Gastrointest Liver Physiol 301:G825–G834 - PMC - PubMed
    1. Ducker GS, Rabinowitz JD (2017) One-carbon metabolism in health and disease. Cell Metab 25:27–42 - PMC - PubMed
    1. Dulai PS, Singh S, Patel J et al (2017) Increased risk of mortality by fibrosis stage in nonalcoholic fatty liver disease: systematic review and meta-analysis. Hepatology 65:1557–1565 - PMC - PubMed

LinkOut - more resources