. 2025 Feb 1;36(2):ar20.
doi: 10.1091/mbc.E24-03-0101. Epub 2024 Dec 24.

Ubiquitin-mediated recruitment of the ATG9A-ATG2 lipid transfer complex drives clearance of phosphorylated p62 aggregates

Affiliations

Ubiquitin-mediated recruitment of the ATG9A-ATG2 lipid transfer complex drives clearance of phosphorylated p62 aggregates

David G Broadbent et al. Mol Biol Cell. .

Abstract

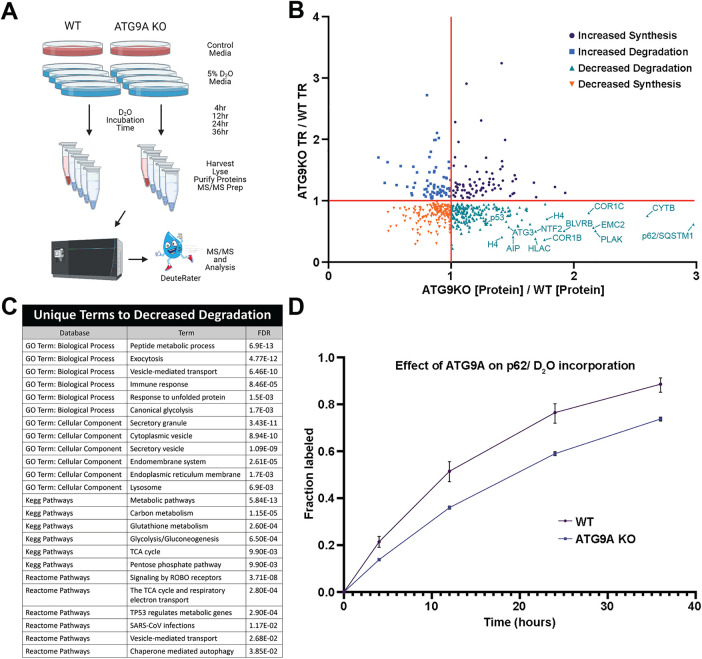
Autophagy is an essential cellular recycling process that maintains protein and organelle homeostasis. ATG9A vesicle recruitment is a critical early step in autophagy to initiate autophagosome biogenesis. The mechanisms of ATG9A vesicle recruitment are best understood in the context of starvation-induced nonselective autophagy, whereas less is known about the signals driving ATG9A vesicle recruitment to autophagy initiation sites in the absence of nutrient stress. Here we demonstrate that loss of ATG9A, or the lipid transfer protein ATG2, leads to the accumulation of phosphorylated p62 aggregates in nutrient replete conditions. Furthermore, we show that p62 degradation requires the lipid scramblase activity of ATG9A. Last, we present evidence that polyubiquitin is an essential signal that recruits ATG9A and mediates autophagy foci assembly in nutrient replete cells. Together, our data support a ubiquitin-driven model of ATG9A recruitment and autophagosome formation during basal autophagy.


Conflict of interest statement

Conflict of interest: The authors declare no financial conflicts of interest.

Figures

FIGURE 1:
FIGURE 1:
Quantitative proteome turnover analysis comparing WT and ATG9A KO cells. (A) Schematic showing the workflow using label-free quantitation (control media, n = 3) and metabolic deuterium incorporation (D2O media, n = 3 collected at 4, 12, 24, and 36 h) to derive protein abundance and turnover rates (TR) in WT and ATG9A KO HEK293T cells. (B) Concurrent changes in abundance and turnover, shown as fold differences (ATG9A KO vs. WT cells). The values were derived from a biological triplicate of the experiment in A with error bars omitted for clarity of presentation. (C) Ontologies enriched in the decreased degradation quadrant (positive [Protein] with negative turnover) for ATG9AKO vs. WT as scored by Panther. (D) Metabolic labeling of P62, as an example of the protein turnover data. Error bars represent SD between technical replicates (n = 3) for the fraction of new P62 detected by MS at the indicated time.
FIGURE 2:
FIGURE 2:
Phosphorylated p62 accumulates prominently in ATG9A KO cells. (A) Western blot demonstrating the defects of p62 degradation in ATG5, ATG9A, and ATG13 KO cell lines. (B) Quantification of p62 immunoblot signal normalized to actin from three replicates. Error bars represent SD. P values were calculated using a two-tailed Student t test. (C) Immunoblot showing the buildup of phospho-p62 in the indicated ATG protein KO cell lines. (D and E) Quantification (as done in B and C) of pS349 and pS403 on p62 from three biological replicates of immunoblots as shown in D. Error bars represent SD. P values were calculated using a two-tailed Student t test. (F and G) Images depicting the accumulation of pS349 or pS403 p62 in WT and ATG9A KO HEK293T cells (scale bars = 10 µm).
FIGURE 3:
FIGURE 3:
The ATG9A-ATG2 lipid transfer complex is required for degradation of phosphorylated p62. (A) Western Blot demonstrating the defects of p62 degradation in ATG2A/B, ATG5, ATG9A, and ATG13 KO U2OS cell lines. (B) Quantification of the triplicate Western blots in A. Error bars represent SD. P values were calculated using a two-tailed Student t test. (C) Western blot showing the accumulation of phospho-p62 in the indicated ATG KO U2OS cell lines. (D–F) Quantification of the phospho-p62 Western blots in C. Error bars represent SD. P values were calculated using a two-tailed Student t test. (G) Fluorescent gel and western blot showing the degradation of p62 in cells stably expressing WT and M33 Halo-ATG9A variants in the absence and presence of doxycycline. (H) Quantification of triplicate Western blots represented in G. Error bars represent SD. P values were calculated using a two-tailed Student t test.
FIGURE 4:
FIGURE 4:
p62-mediated formation of ubiquitin-rich condensates is required for ATG9A recruitment. (A) Confocal imaging of endogenous p62, ubiquitin and endogenously HA-tagged ATG9A in WT, ATG13 KO and ATG13-p62 double KO (dKO) HCT-116 cells (scale bars = 10 µm). Where indicated, cells were treated for 4 h with 1 µM wortmannin. (B) Quantification of ATG9A-HA and TAX1BP1 colocalization by Pearson's coefficient Quantitation is from three replicates with error bars representing SD. P values were calculated using a two-tailed Student t test for pair-wise comparison. (C) Quantification of ATG9A-HA and ubiquitin colocalization from three biological replicates with error bars representing SD. P values were calculated using a two-tailed Student t test as in B.
FIGURE 5:
FIGURE 5:
Poly-ubiquitin is required and sufficient for recruitment of the ATG9A-ATG2A lipid transfer complex. (A) U2OS cells were treated with 10 µM MLN for 2 h, followed by immunoblotting for endogenous ubiquitin. Graph shows quantification of three replicates with P value calculated using a two-tailed Student t test. (B) Rates of ATG13 foci formation divided into colocalized and noncolocalized foci in U2OS cells endogenously expressing Halo-ATG13 and stably expressing GFP-LC3B treated with DMSO or MLN. P values were calculated using a two-tailed Student t test. (C) ATG13 foci length distribution from the data shown in A. P values were calculated using a two-tailed Student t test. (D) Example images showing the difference in recruitment of endogenous Halo-ATG9A to SNAP-p62 aggregates in the presence and absence of MLN. (E) Quantification of the amount of Halo-ATG9A that is recruited to SNAP-P62 aggregates shown in C. P values were calculated using a two-tailed Student t test. (F) Representative images showing the recruitment of Halo-ATG2A to 6x-Ubiquitin-BFP2 aggregates in WT and ATG9AKO cells. (G) Counts of colocalized foci shown in E. (H) kymograph showing representative foci of Halo-ATG2A and 6x-ubiqutin colocalization over-time from the experiment shown in E. P values were calculated using a two-tailed Student t test.

References

    1. Adriaenssens E, Ferrari L, Martens S (2022). Orchestration of selective autophagy by cargo receptors. Curr Biol 32, R1357–R1371. - PubMed
    1. Agudo-Canalejo J, Schultz SW, Chino H, Migliano SM, Saito C, Koyama-Honda I, Stenmark H, Brech A, May AI, Mizushima N, Knorr RL (2021). Wetting regulates autophagy of phase-separated compartments and the cytosol. Nature 591, 142–146. - PubMed
    1. Barnaba C, Broadbent DG, Kaminsky EG, Perez GI, Schmidt JC (2024). AMPK regulates phagophore-to-autophagosome maturation. J Cell Biol 223, e202309145. - PMC - PubMed
    1. Barnaba C, Broadbent DG, Perez GI, Schmidt JC (2023). AMPK regulates phagophore-to-autophagosome maturation. bioRxiv 2023.2009.2028.559981. - PMC - PubMed
    1. Bjorkoy G, Lamark T, Brech A, Outzen H, Perander M, Overvatn A, Stenmark H, Johansen T (2005). p62/SQSTM1 forms protein aggregates degraded by autophagy and has a protective effect on huntingtin-induced cell death. J Cell Biol 171, 603–614. - PMC - PubMed

MeSH terms

LinkOut - more resources