. 2024 Dec 24;135(2):e174249.
doi: 10.1172/JCI174249.

Targeted degradation of oncogenic KRASG12V triggers antitumor immunity in lung cancer models

Affiliations

Targeted degradation of oncogenic KRASG12V triggers antitumor immunity in lung cancer models

Dezhi Li et al. J Clin Invest. .

Abstract

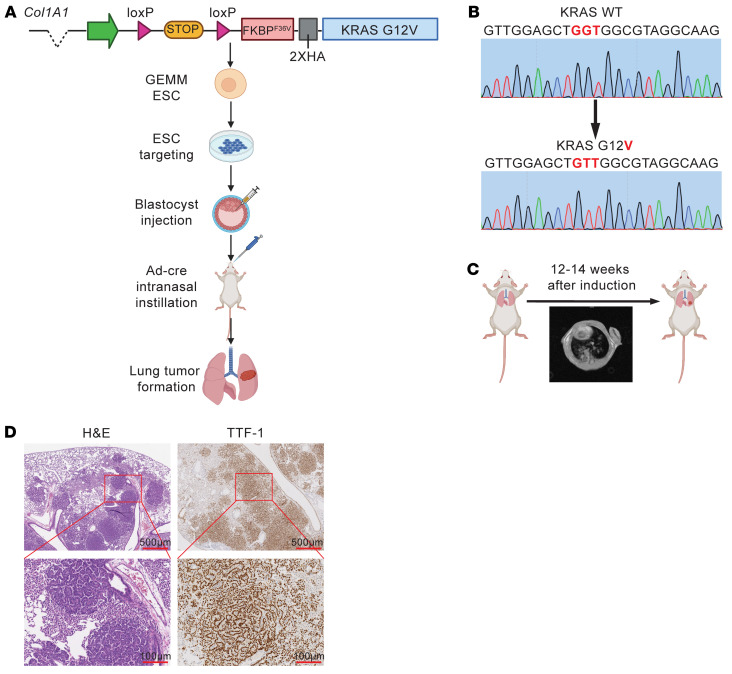
Kirsten rat sarcoma viral oncogene homolog (KRAS) is the most frequently mutated oncogene in lung adenocarcinoma, with G12C and G12V being the most predominant forms. Recent breakthroughs in KRASG12C inhibitors have transformed the clinical management of patients with the G12C mutation and advanced our understanding of the function of this mutation. However, little is known about the targeted disruption of KRASG12V, partly due to a lack of specific inhibitors. Here, we leverage the degradation tag (dTAG) system to develop a KRASG12V-transgenic mouse model. We explored the therapeutic potential of KRASG12V degradation and characterized its effect on the tumor microenvironment (TME). Our study reveals that degradation of KRASG12V abolished lung and pancreatic tumors in mice and caused a robust inhibition of KRAS-regulated cancer-intrinsic signaling. Importantly, targeted degradation of KRASG12V reprogrammed the TME toward a stimulatory milieu and drove antitumor immunity, elicited mainly by effector and cytotoxic CD8+ T cells. Our work provides insights into the effect of KRASG12V degradation on both tumor progression and the immune response, highlighting degraders as a powerful strategy for targeting KRAS-mutant cancers.

Keywords: Immunology; Lung cancer; Oncology.


Figures

Figure 1
Figure 1. Validation of targeted degradation of KRASG12V using the dTAG system.
(A) Schematic of the dTAG system showing that dTAGV-1 recruits the VHL E3 ubiquitin ligase to induce targeted degradation of FKBP12F36V-KRASG12V. The schematic was created using BioRender.com. CUL2, Cullin 2; ELOB, Elongin B; ELOC, Elongin C; E2, ubiquitin-conjugating enzyme; RBX1, RING-box protein 1; Ub, ubiquitin. (B) Representative images of NIH/3T3 cells expressing GFP or FKBP12F36V-GFP that were treated with DMSO, 500 nM dTAGV-1, or 500 nM dTAGV-1-NEG for 8 hours. Scale bars: 20 μm. Data are representative of 3 independent experiments. (C) Immunoblot analysis of HA to detect FKBP12F36V-GFP or FKBP12F36V-KRASG12V, KRAS, p-MEK, MEK, and α-tubulin in NIH/3T3 cells expressing GFP, FKBP12F36V-GFP, KRASG12V, or FKBP12F36V-KRASG12V that were treated with DMSO, 500 nM dTAGV-1, or 500 nM dTAGV-1-NEG for 8 hours. Data are representative of 3 independent experiments. (D) Antiproliferation of NIH/3T3 cells expressing GFP, FKBP12F36V-GFP, KRASG12V, or FKBP12F36V-KRASG12V cultured as ultra-low adherent 3D spheroid suspensions for 144 hours. Data are presented as the mean ± SD of 20 biologically independent samples and are representative of 3 independent experiments. (E) Volume changes of tumors from NIH/3T3 expressing KRASG12V or FKBP12F36V-KRASG12V that were s.c. injected into mice. Data are presented as the mean ± SEM of 10 per group. (F) DMSO-normalized proliferation of NIH/3T3 cells expressing FKBP12F36V-KRASG12V cultured as ultra-low adherent 3D spheroid suspensions and treated with the indicated compounds for 120 hours. Data are presented as the mean ± SD of 4 biologically independent samples and are representative of 3 independent experiments. ****P < 0.0001 (D) and NS (D and E), by 1-way ANOVA with post hoc Tukey’s test (D) or 2-tailed Student’s t test (E).
Figure 2
Figure 2. Establishing a GEMM for targeted degradation of KRASG12V in lung cancer.
(A) Schematic showing the design of the FKBP12F36V-KRASG12V GEMM. The schematic was created using BioRender.com. (B) Genomic sequencing confirmation of the KRASG12V mutation in the GEMM. (C) MRI was performed to detect lung tumor nodules 12–14 weeks after adenovirus-carrying Cre-recombinase delivery. (D) Representative images of H&E and IHC staining for TTF-1 in lung tumors from the FKBP12F36V-KRASG12V GEMM. Scale bars: 500 μm (top panels) and 100 μm (bottom panels).
Figure 3
Figure 3. dTAGV-1 effectively degrades KRASG12V and inhibits downstream signaling in a KRASG12V-driven lung cancer GEMM.
(A) Schematic showing the in vivo dosing schedule for evaluation of target engagement and degradation. Mice were treated once daily with either vehicle or dTAGV-1 (35 mg/kg) for 5 days. The schematic was created using BioRender.com. (B) Immunoblot analysis of HA to detect FKBP12F36V-KRASG12V, p-ERK, ERK, and actin in lung tumor nodules after the indicated treatment and duration (n = 3–5 per group). (C) Representative images of H&E and IHC staining for HA to detect FKBP12F36V-KRASG12V and p-ERK of lung tumors after the indicated treatment (n = 3 mice per group). Scale bars: 500 μm, 200 μm, 100 μm, and 50 μm (from top to bottom). (D) Quantification of HA to detect FKBP12F36V-KRASG12V and p-ERK+ staining after the indicated treatment. Data are presented as the mean ± SD of 10 representative areas from 3 mice per group. (E) Representative images of IHC staining for Ki-67 and cleaved caspase-3 in lung tumors after the indicated treatment. Scale bars: 100 μm (top panels) and 50 μm (bottom panels). (F) Quantification of Ki-67 and cleaved caspase-3+ staining after the indicated treatment. Data are presented as the mean ± SD of 10 representative areas from 3 mice per group. ****P < 0.0001, by 2-tailed Student’s t test (D and F).
Figure 4
Figure 4. KRASG12V degradation abolishes tumor growth h in KRASG12V-driven murine lung and pancreatic cancer models.
(A) Schematic showing the in vivo dosing schedule for evaluation of long-term dTAGV-1 treatment. The schematic was created using BioRender.com. (B) Representative MRI scans (n = 1 vehicle-treated mouse and 3 dTAGV-1–treated mice) of tumor at baseline and 2 weeks and 3 weeks after treatment initiation. Red arrowheads indicate lung tumors; red circles indicate the heart. (C) Waterfall plot (left) and dot plot (right) showing changes in tumor volume compared with baseline after 2 or 3–4 weeks of treatment. Data are presented as the mean ± SD of 8 per group. (D) Kaplan-Meier survival curve of FKBP12F36V-KRASG12V lung cancer mice after long-term treatment with vehicle or dTAGV-1 (n = 9 per group). (E) Volume changes of tumors from PATU-8902 FKBP12F36V-KRASG12V; KRAS–/– cells that were s.c. injected into mice and treated with vehicle or dTAGV-1. Data are presented as the mean ± SEM of 12 per group. (F) Representative pancreatic tumors after the indicated treatment. ****P < 0.0001, by 1-way ANOVA with post hoc Dunnett’s test (C) or 2-tailed Student’s t test (E).
Figure 5
Figure 5. KRASG12V degradation increases CD8+ T activity in a KRASG12V-driven lung cancer GEMM.
(A) Schematic showing the experimental design for immune profiling. After confirming tumor burden by MRI, mice were randomized and treated once daily with either vehicle or dTAGV-1 (35 mg/kg) for 5 days. Tumor nodules were then collected, and tumor-infiltrating lymphocytes were analyzed by flow cytometry. The schematic was created using BioRender.com. (B and C) Frequencies of CD44+CD8+ and CD62L+CD8+ T cells (n = 5 per group). Data are presented as the mean ± SEM (C). (D and E) Frequencies of CD69+CD8+ and GZMB+CD8+ T cells (n = 5 per group). Data are presented as the mean ± SEM (E). *P < 0.05 and **P < 0.01, by 2-tailed Student’s t test (C and E).
Figure 6
Figure 6. scRNA-Seq reveals that KRASG12V degradation reprograms the TME to promote antitumor immunity in a KRASG12V-driven lung cancer GEMM.
(A) Uniform manifold approximation and projection (UMAP) plot shows the identified cell populations including tumor cells, immune cells, and fibroblasts. (B) UMAP plots showing the expression of cell-type–specific marker genes. (C) Percentage of cells in the TME of annotated clusters in response to the indicated treatments. (D) UMAP plot shows the identified cell subsets in the T cell population. (E) UMAP plots show the expression of selected marker genes. (F) Percentage of cells in the annotated T cell subsets in response to the indicated treatments.
Figure 7
Figure 7. Antitumor immunity by KRASG12V degradation is partly dependent on CD8+ T cells in a KRASG12V-driven lung cancer GEMM.
(A and B) Representative multiplex IF images showing (A) tumor-infiltrating CD3+ T cells, Foxp3+ Tregs, and (B) CD19+ B cells in response to the indicated treatments. The same samples are presented in A and B. Scale bars: 50 μm and 10 μm (left to right, respectively). (C) Quantification of CD3+ T cells, Foxp3+ Tregs, and CD19+ B cells in response to the indicated treatments. Data are presented as the mean ± SD of 10 representative areas from 3 mice per group. (D) Representative MRI scans of lung tumors at baseline and 2 weeks in response to the indicated treatment. Red arrows indicate lung tumors. (E and F) Waterfall plot (E) and dot plot (F) showing changes in tumor volume compared with baseline after 2 weeks of treatment. Data are presented as the mean ± SD of 4–6 per group. **P < 0.01, ***P < 0.001, and ****P < 0.0001, by 2-tailed Student’s t test (C) and 1-way ANOVA with post hoc Tukey’s test (F).

References

    1. Siegel RL, et al. Cancer statistics, 2019. CA Cancer J Clin. 2019;69(1):7–34. doi: 10.3322/caac.21551. - DOI - PubMed
    1. Cheng L, et al. Molecular pathology of lung cancer: key to personalized medicine. Mod Pathol. 2012;25(3):347–369. doi: 10.1038/modpathol.2011.215. - DOI - PubMed
    1. Scheffler M, et al. K-ras mutation subtypes in NSCLC and associated co-occuring mutations in other oncogenic pathways. J Thorac Oncol. 2019;14(4):606–616. doi: 10.1016/j.jtho.2018.12.013. - DOI - PubMed
    1. Janes MR, et al. Targeting KRAS mutant cancers with a covalent G12C-specific inhibitor. Cell. 2018;172(3):578–589. doi: 10.1016/j.cell.2018.01.006. - DOI - PubMed
    1. Lanman BA, et al. Discovery of a covalent inhibitor of KRASG12C (AMG 510) for the treatment of solid tumors. J Med Chem. 2020;63(1):52–65. doi: 10.1021/acs.jmedchem.9b01180. - DOI - PubMed

MeSH terms

Substances