. 2025 Jun 3;148(6):2201-2217.
doi: 10.1093/brain/awae414.

Distinct transcriptional changes distinguish efficient and poor remyelination in multiple sclerosis

Affiliations

Distinct transcriptional changes distinguish efficient and poor remyelination in multiple sclerosis

J Q Alida Chen et al. Brain. .

Abstract

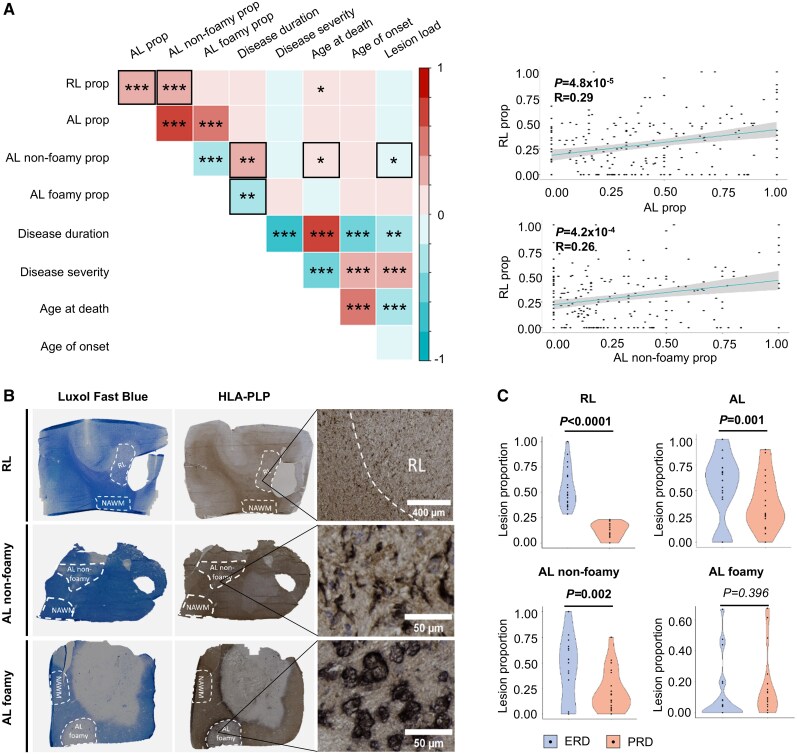
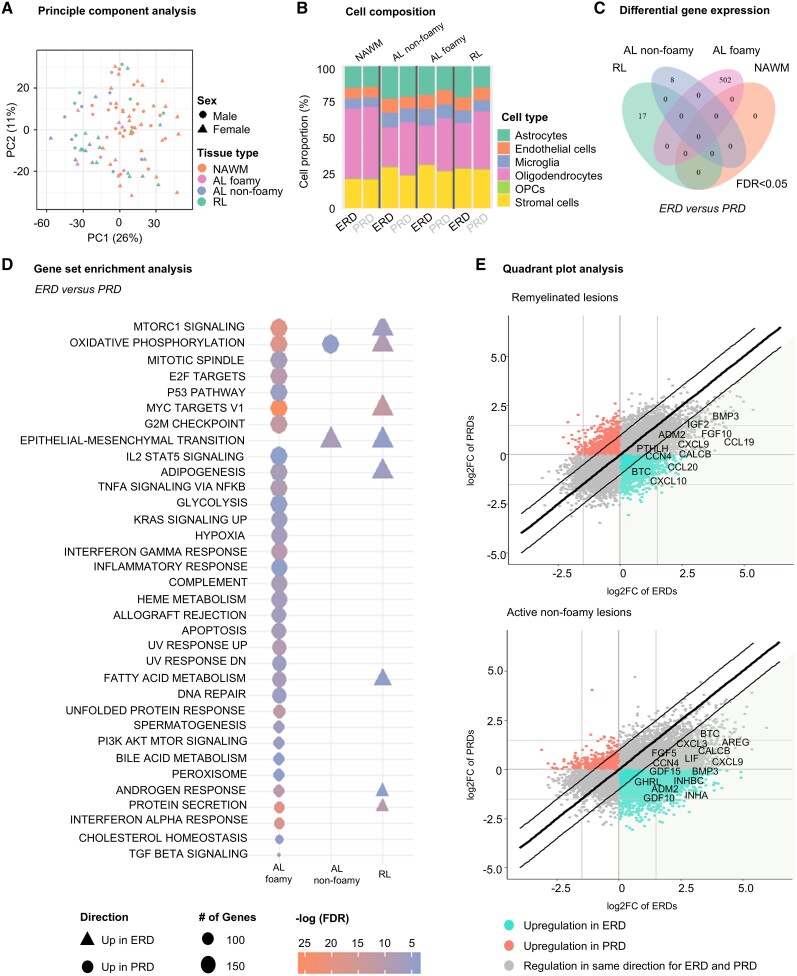
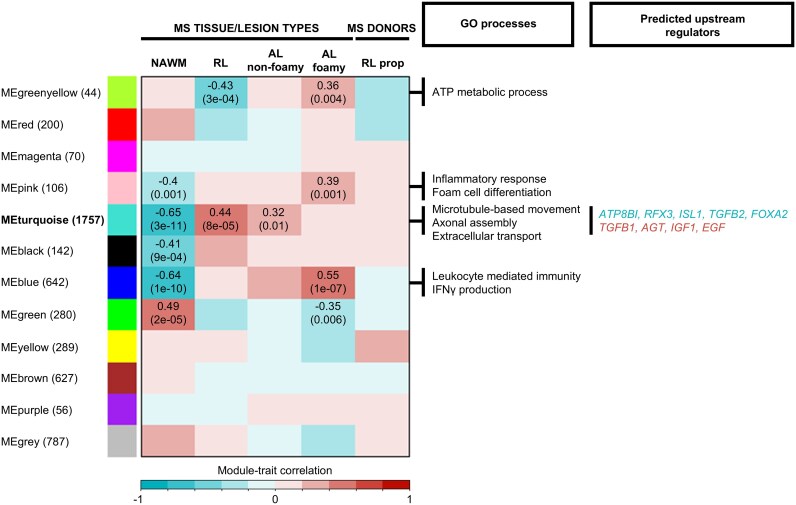
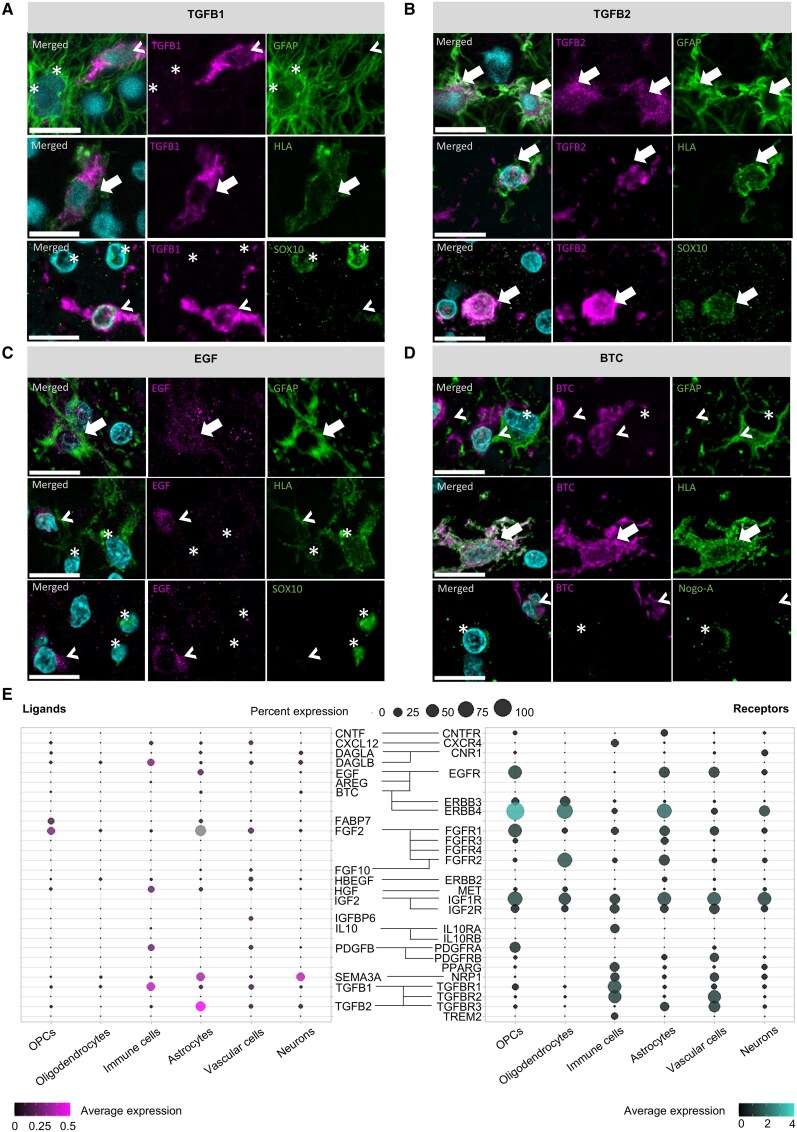
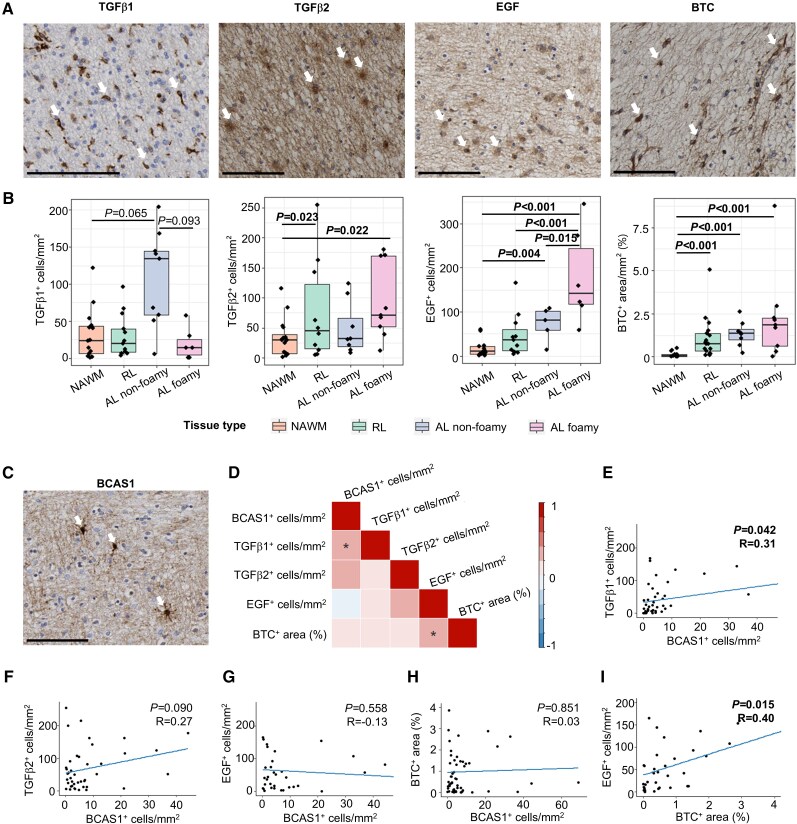
Multiple sclerosis (MS) is a highly heterogeneous disease, with varying remyelination potential across individuals and between lesions. However, the molecular mechanisms underlying the potential to remyelinate remain poorly understood. In this study, we aimed to take advantage of the intrinsic heterogeneity in remyelinating capacity between MS donors and lesions to uncover known and novel pro-remyelinating molecules for MS therapies. To elucidate distinct molecular signatures underlying the potential to remyelinate, we stratified MS donors from the Netherlands Brain Bank cohort (n = 239), based on proportions of remyelinated lesions (RLs), into efficiently remyelinating donors (ERDs; n = 21) and poorly remyelinating donors (PRDs; n = 19). We performed bulk RNA sequencing of RLs, active lesions with ramified and amoeboid microglia/macrophage morphology (ALs non-foamy), active lesions with foamy microglia/macrophage morphology (ALs foamy) and normal-appearing white matter (NAWM) from ERDs and PRDs. We found that ALs non-foamy were positively correlated with remyelination, whereas ALs foamy were not, indicating a role for microglia/macrophage state in influencing remyelination potential. Bioinformatics analyses were performed to identify key pathways and molecules implicated in the remyelination process. We found distinct differences between the donors with differing remyelination potential in comparable MS lesion types. The RLs and ALs non-foamy of ERDs versus PRDs showed upregulation of the epithelial-mesenchymal transition pathway, whereas in ALs foamy of PRDs, inflammation and damage-associated pathways (i.e. MTORC1 signalling, TNF signalling and oxidative phosphorylation) were upregulated in comparison to ALs foamy of ERDs, suggesting that these latter pathways might counteract remyelination. We found genes significantly upregulated in RLs and/or ALs non-foamy of ERDs that have previously been associated with remyelination, including CXCL12, EGF, HGF, IGF2, IL10, PDGFB, PPARG and TREM2, illustrating the strength of our donor and lesion stratification. TGFB1, TGFB2, EGF and IGF1 were determined to be key upstream regulators of genes upregulated in RLs and ALs non-foamy of ERDs. We also identified potential novel pro-remyelinating molecules, such as BTC, GDF10, GDF15, CCN1, CCN4, FGF5, FGF10 and INHBB. Our study identified both known and novel genes associated with efficient remyelination that might facilitate the development of therapeutic strategies to promote tissue repair and clinical recovery in MS.

Keywords: active lesions; growth factors; microglia; repair.


Conflict of interest statement

The authors report no competing interests.

Figures

Figure 1
Figure 1
Identification and selection of multiple sclerosis (MS) donors and MS lesions with high remyelination potential. (A) Comparisons between MS lesion subtypes and clinical data of 239 MS donors (donated between 1990 and 2020) from Netherlands Brain Bank (NBB) show a positive correlation between remyelinated lesions (RLs) and active lesions (ALs). Donors with higher proportions of ALs non-foamy, but not ALs foamy, show lower lesion load, higher disease duration and older age at death. Statistics were performed using Pearson’s correlation with Benjamini–Hochberg multiple testing correction. *False discovery rate < 0.05, **false discovery rate < 0.01 and ***false discovery rate < 0.001. Grey bands in scatter plots represent the 95% confidence interval. (B) MS brain tissue [normal appearing white matter (NAWM), RLs, ALs non-foamy and ALs foamy] was assessed by Luxol Fast Blue and HLA-PLP staining. Dashed lines indicate dissection outlines. (C) The MS cohort selected for this study [(n = 21 efficiently remyelinating donors (ERDs) and n = 19 poorly remyelinating donors (PRDs)] reflects pathological properties of the large MS database, showing higher RL and AL non-foamy proportions, but not a higher AL foamy proportion in donors with a high remyelinated lesion proportion.
Figure 2
Figure 2
Transcriptional differences between multiple sclerosis donors with efficient or poor remyelination potential. (A) Principal component analysis on the distribution of all included samples (n = 91). (B) Cell composition analysis (estimated from the single-nucleus RNA sequencing study by Schirmer et al.) shows that most cell composition differences can be detected between multiple sclerosis (MS) lesions and normal-appearing white matter (NAWM). (C) Venn diagram shows no or few differentially expressed genes (DEGs) between efficiently remyelinating donors (ERDs) and poorly remyelinating donors (PRDs) in NAWM, remyelinated lesion (RL) and active non-foamy lesion (AL non-foamy) samples but many DEGs in active foamy lesion samples (AL foamy; false discovery rate < 0.05). (D) Gene set enrichment analysis of hallmark gene sets shows regulation of specific pathways in RLs, ALs non-foamy and ALs foamy between ERDs and PRDs. Epithelial–mesenchymal transition (EMT) is enhanced in RLs and ALs non-foamy of ERDs. On the contrary, inflammation- and damage-associated pathways are upregulated in ALs foamy of PRDs. Symbols indicate upregulation in ERDs (triangle) or PRDs (circle). (E) Identification of novel soluble potential pro-remyelinating factors with comparison of fold change expression between donor groups in remyelinated and active non-foamy lesions. Green area indicates the area of interest for molecule selection. Genes below the lower line indicate genes with 2-fold upregulation in ERDs compared with PRDs.
Figure 3
Figure 3
WGCNA for multiple sclerosis (MS) normal-appearing white matter, MS lesion types and donors with different remyelinating capability. WGCNA identified 12 modules. The numbers of genes in the modules are displayed in parentheses. Correlation and significance are shown for gene traits with false discovery rate < 0.05. Gene Ontology (GO) processes of modules of interest are highlighted. The most significant upstream regulating molecules are indicated in blue, and genes regulating most other genes in the module are indicated in red. AL (foamy) = active foamy lesion; AL (non-foamy) = active non-foamy lesion; NAWM = normal-appearing white matter; RL = remyelinated lesion; WGCNA = weighted gene co-expression network analysis.
Figure 4
Figure 4
Cellular expression of genes of interest in human multiple sclerosis brain tissue. (AD) Immunofluorescent double-stained images of TGFβ1 (A), TGFβ2 (B), EGF (C) and BTC (D) with GFAP (astrocytes), HLA (microglia/macrophages) and SOX10 or Nogo-A (oligodendrocytes) in an active non-foamy lesion. Scale bars: 15 μm. Arrows indicate target+/cell marker+ double-staining, arrowhead indicates target+/cell marker double-staining, and asterisks indicate target/cell marker+ double-staining. (E) Percentage of cells per cell type expressing selected ligand and receptor pairs and average expression of each gene in each cell type (adapted from Absinta et al.). OPC = oligodendrocyte precursor cell.
Figure 5
Figure 5
Association between factors of interest with remyelinating multiple sclerosis tissue. (A and B) Histological quantification of targets of interest, TGFβ1, TGFβ2, EGF and BTC, in remyelinated lesions (RLs), active non-foamy lesions (ALs non-foamy), active foamy lesions (ALs foamy) and normal-appearing white matter (NAWM). Scale bars: 100 μm. Arrows indicate TGFβ1+, TGFβ2+, EGF+ and BTC+ cells, respectively. (C) Immunohistochemical staining of BCAS1. (DI) Heat map of quantified proteins of interest and BCAS1 in RLs, ALs non-foamy, ALs foamy and NAWM shows a positive correlation between TGFβ1 and BCAS1 and between EGF and BTC. Statistics were performed using negative binomial generalized linear model or restricted maximum likelihood with Tukey’s post hoc test to compare values between groups. *P < 0.05, **P < 0.01 and ***P < 0.001.

Similar articles

Cited by

References

    1. Lassmann H, Raine CS, Antel J, Prineas JW. Immunopathology of multiple sclerosis: Report on an international meeting held at the Institute of Neurology of the University of Vienna. J Neuroimmunol. 1998;86:213–217. - PubMed
    1. Luchetti S, Fransen NL, van Eden CG, Ramaglia V, Mason M, Huitinga I. Progressive multiple sclerosis patients show substantial lesion activity that correlates with clinical disease severity and sex: A retrospective autopsy cohort analysis. Acta Neuropathol. 2018;135:511–528. - PMC - PubMed
    1. Lucchinetti C, Brück W, Parisi J, Scheithauer B, Rodriguez M, Lassmann H. Heterogeneity of multiple sclerosis lesions: Implications for the pathogenesis of demyelination. Ann Neurol. 2000;47:707–717. - PubMed
    1. Franklin RJM, Ffrench-Constant C. Regenerating CNS myelin—From mechanisms to experimental medicines. Nat Rev Neurosci. 2017;18:753–769. - PubMed
    1. Franklin RJM, Simons M. CNS remyelination and inflammation: From basic mechanisms to therapeutic opportunities. Neuron. 2022;110:3549–3565. - PubMed