. 2025 Jan 7;53(1):gkae1259.
doi: 10.1093/nar/gkae1259.

A subcellular selective APEX2-based proximity labeling used for identifying mitochondrial G-quadruplex DNA binding proteins

Affiliations

A subcellular selective APEX2-based proximity labeling used for identifying mitochondrial G-quadruplex DNA binding proteins

Xu Wang et al. Nucleic Acids Res. .

Abstract

G-quadruplexes (G4s), as an important type of non-canonical nucleic acid structure, have received much attention because of their regulations of various biological processes in cells. Identifying G4s-protein interactions is essential for understanding G4s-related biology. However, current strategies for exploring G4 binding proteins (G4BPs) include pull-down assays in cell lysates or photoaffinity labeling, which are lack of sufficient spatial specificity at the subcellular level. Herein, we develop a subcellular selective APEX2-based proximity labeling strategy to investigate the interactome of mitochondrial DNA (mtDNA) G4s in living cells. By this method, we have identified several mtDNA G4BPs. Among them, a previously unrecognized mtDNA G4BP, DHX30 has been selected as an example to explore its important biofunctions. DHX30 localizes both in cytoplasm and mitochondria and can resolve mtDNA G4s. Further studies have demonstrated that DHX30 unfolds mtDNA G4 in living cells, which results in a decrease in glycolysis activity of tumor cells. Besides, RHPS4, a known mtDNA G4 stabilizer, will reverse this inhibition effect. Benefiting from the high spatiotemporal resolution and the ability of genetically encoded systems to perform the labeling with exquisite specificity within living cells, our approach can realize the identification of subcellular localized G4BPs. Our work provides a novel strategy to map protein interactions of specific nucleic acid features in subcellular compartments of living cells.


Figures

Graphical Abstract
Graphical Abstract
Figure 1.
Figure 1.
Design and implementation of APEX2-based proximity strategy to identify mtDNA G4BPs. (A) Schematic diagrams of SG4-APEX2 mediated mtDNA G4BP proximity strategy. (B) Design of two vectors for expressing SG4-APEX2 and mSG4-APEX2. (C) Western blotting analysis of HEK293T cells that expressed SG4-APEX2 and mSG4-APEX2. NC: no APEX2 expression. (D) Fluorescence imaging of SG4-APEX2 and mSG4-APEX2 localization to mitochondria. Fusion constructs were visualized by anti-Flag staining. Mitochondria were visualized by anti-TOMM70 staining. Nuclei were stained with Hoechst 33 342. Pixel intensity plots of the arrows are shown at right. Scale bars, 10 μm. (EIn vitro translation of SG4-APEX2 and mSG4-APEX2. (F) Schematic diagrams of G4 pull down assays. (G) Validation of the mitoG4 binding ability of SG4-APEX2 and mSG4-APEX2 constructs in vitro by G4-pull down assay. (Hand I) Validation of the mitoG4 binding ability of SG4-APEX2 (H) and mSG4-APEX2 constructs (I) in cells by mtDIP and quantitative real-time PCR (mtDIP-qPCR) assays. Two-sided Student’s t-test was performed and values represent means ± SD from three biological replicates.
Figure 2.
Figure 2.
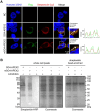
Characterization and analysis of PL by the fusion constructs in HEK293T cells. (A) Confocal microscope imaging of biotin-labeled proteins after APEX2 labeling. Biotinylated proteins were visualized by streptavidin (SA)-coupled Cy3. APEX2 were detected by Flag staining. The nuclei were stained with Hoechst 33 342. Pixel intensity plots of the arrows are shown at right. Scale bars, 10 μm. (B) Gel analysis of biotinylated proteins. Lysates were analyzed by streptavidin blotting (left) or Coomassie stain (middle). Total eluted proteins after streptavidin bead enrichment were visualized by Coomassie stain (right). Substrates are BP and H2O2.
Figure 3.
Figure 3.
Profiling of mtDNA G4s interactome. (A) The Venn diagram shows the proteins exclusively detected in the SG4-APEX2 groups. (BandC) GO pathway enrichment analyses (cellular component) of G4BP candidates. Visualization of GO pathway enrichment results with network planning (B). Visualization of GO pathway enrichment results with bubble charts (C).
Figure 4.
Figure 4.
Validation of DHX30 as a novel mtDNA G4BP. (A–C), DHX30 partially localized to mitochondria. (A) Fluorescence imaging of endogenous DHX30 localization. DHX30 was detected by DHX30 antibody, Anti-Tomm20 antibody stains represented a mitochondria marker and the nuclei were detected by Hoechst 33 342. Pixel intensity plots of the white arrow were shown on the right. (scale bar, 10 μm). (B) Relative DHX30 protein levels in whole cell lysates and mitochondrial fractions. One of three independent experiments was shown. (C) Relative DHX30 protein levels obtained from densitometric quantification of all the blots and relative to the reference proteins, TOMM20 (n = 3); *P < 0.05. (D) Schematic representation of DHX30 recognition by antibodies and chromogenic detection in vitro (ELISA, ADHP = Amplex Red). (E) Binding curves determined by an adapted ELISA assay for mito0.5–22 as example of mtDNA G4, mito0.5–22m as example of G-rich sequences not able to fold in a G4 structure and dsDNA. (F) Binding curves determined by an adapted ELISA assay for mito55 as example of mtDNA G4 and mito55m as example of ssDNA. Dissociation constants (Kd) estimated from curve fitting. Error bars represent the SD calculated from three replicates.
Figure 5.
Figure 5.
DHX30 binding mtDNA G4 in cells. (Aand B), The BG4/mitoG4 complexes were captured by DHX30 through Anti-Flag Magnetic Beads (A), detected by western blotting assays (B). (C) Immunofluorescence image of Flag-tagged DHX30 and BG4 in HEK293T cells. The colocalized foci were indicated by white arrows. Pixel intensity plots of the yellow arrow were shown on the right. Scale bars, 10 μm. (D) Immunofluorescence image of endogenous DHX30 and BG4 in HEK293T cells. The colocalized foci were indicated by white arrows. Pixel intensity plots of the yellow arrow were shown on the right. Scale bars, 10 μm. (E) Western blot analyses for DHX30 OE and wild type cells. The IP band was to detect biotin-labeled DHX30, and the input band was to detect total DHX30. (F) Validation of the mitoG4 binding ability of Flag-DHX30 in cells by mtDIP-qPCR assays. Error bars indicate SD.
Figure 6.
Figure 6.
DHX30 was involved in resolving of mtDNA G4 in vitro. (A) Schematic representation of the helicase assay developed by Mendoza et al (30,49). (B) Representation plots of emission as a function of time for unwinding of mtDNA G4 system (S-mito0.5–22-dabcyl). DHX30 was added to begin the reaction (t = 1200 s); the complementary strands (C-mito0.5–22) were added once the reactions reached a plateau (t = 8400 s). (C) Quantitation of DHX30 helicase activity; error bars indicate SD. (D) The addition of 1 mM ATP has no effect on the helicase activity of DHX30. (E) Quantitation of DHX30 helicase activity with or without ATP; error bars indicate SD.
Figure 7.
Figure 7.
DHX30 was involved in resolving mtDNA G4s in living cells. (A) DHX30 overexpress lead to decreased mitochondrial G4 signal, revealed by labeling of WT and DHX30 overexpress HEK293T cells with the BG4 antibody. HSP60 served to mark the mitochondria. Scale bars, 10 μm. Left, quantification of the HSP60/BG4 foci number (n = 47). Two-tailed Student’s t test. ****P < 0.0001. (B) DHX30 was involved in resolving mitoG4 in MCF-7 cells. DHX30 overexpress lead to decreased mitoG4 signal. While mtDNA G4 stabilizer, RHPS4, could elevate mitoG4 levels. Left, quantification of the HSP60/BG4 foci number (n = 30). Two-tailed Student’s t test. **P < 0.01.
Figure 8.
Figure 8.
The impact of DHX30 OE on the glycolysis of MCF-7 cells. (Aand B), The impact of DHX30 OE on glycolytic rates in MCF-7 cells treated with or without RHPS4. (C) The expression of glycolysis-related genes in DHX30 OE MCF-7 cells versus WT cells, detected by qRT-PCR assays. Data were shown in three repeated experiments. Error bars represent SD. Two-tailed Student’s t-test. *P < 0.05, **P < 0.01, ***P < 0.001 and ****P < 0.0001.

References

    1. Varshney D., Spiegel J., Zyner K., Tannahill D., Balasubramanian S.. The regulation and functions of DNA and RNA G-quadruplexes. Nat. Rev. Mol. Cell Biol. 2020; 21:459–474. - PMC - PubMed
    1. Biffi G., Tannahill D., McCafferty J., Balasubramanian S.. Quantitative visualization of DNA G-quadruplex structures in human cells. Nat. Chem. 2013; 5:182–186. - PMC - PubMed
    1. Biffi G., Di Antonio M., Tannahill D., Balasubramanian S.. Visualization and selective chemical targeting of RNA G-quadruplex structures in the cytoplasm of human cells. Nat. Chem. 2014; 6:75–80. - PMC - PubMed
    1. Meier-Stephenson V. G4-quadruplex-binding proteins: review and insights into selectivity. Biophys. Rev. 2022; 14:635–654. - PMC - PubMed
    1. Li L., Williams P., Ren W., Wang M.Y., Gao Z., Miao W., Huang M., Song J., Wang Y.. YY1 interacts with guanine quadruplexes to regulate DNA looping and gene expression. Nat. Chem. Biol. 2021; 17:161–168. - PMC - PubMed

MeSH terms

LinkOut - more resources