. 2025 Mar:519:122-141.
doi: 10.1016/j.ydbio.2024.12.010. Epub 2024 Dec 22.

Post-eclosion growth in the Drosophila ejaculatory duct is driven by Juvenile hormone signaling and is essential for male fertility

Affiliations

Post-eclosion growth in the Drosophila ejaculatory duct is driven by Juvenile hormone signaling and is essential for male fertility

Navyashree A Ramesh et al. Dev Biol. 2025 Mar.

Abstract

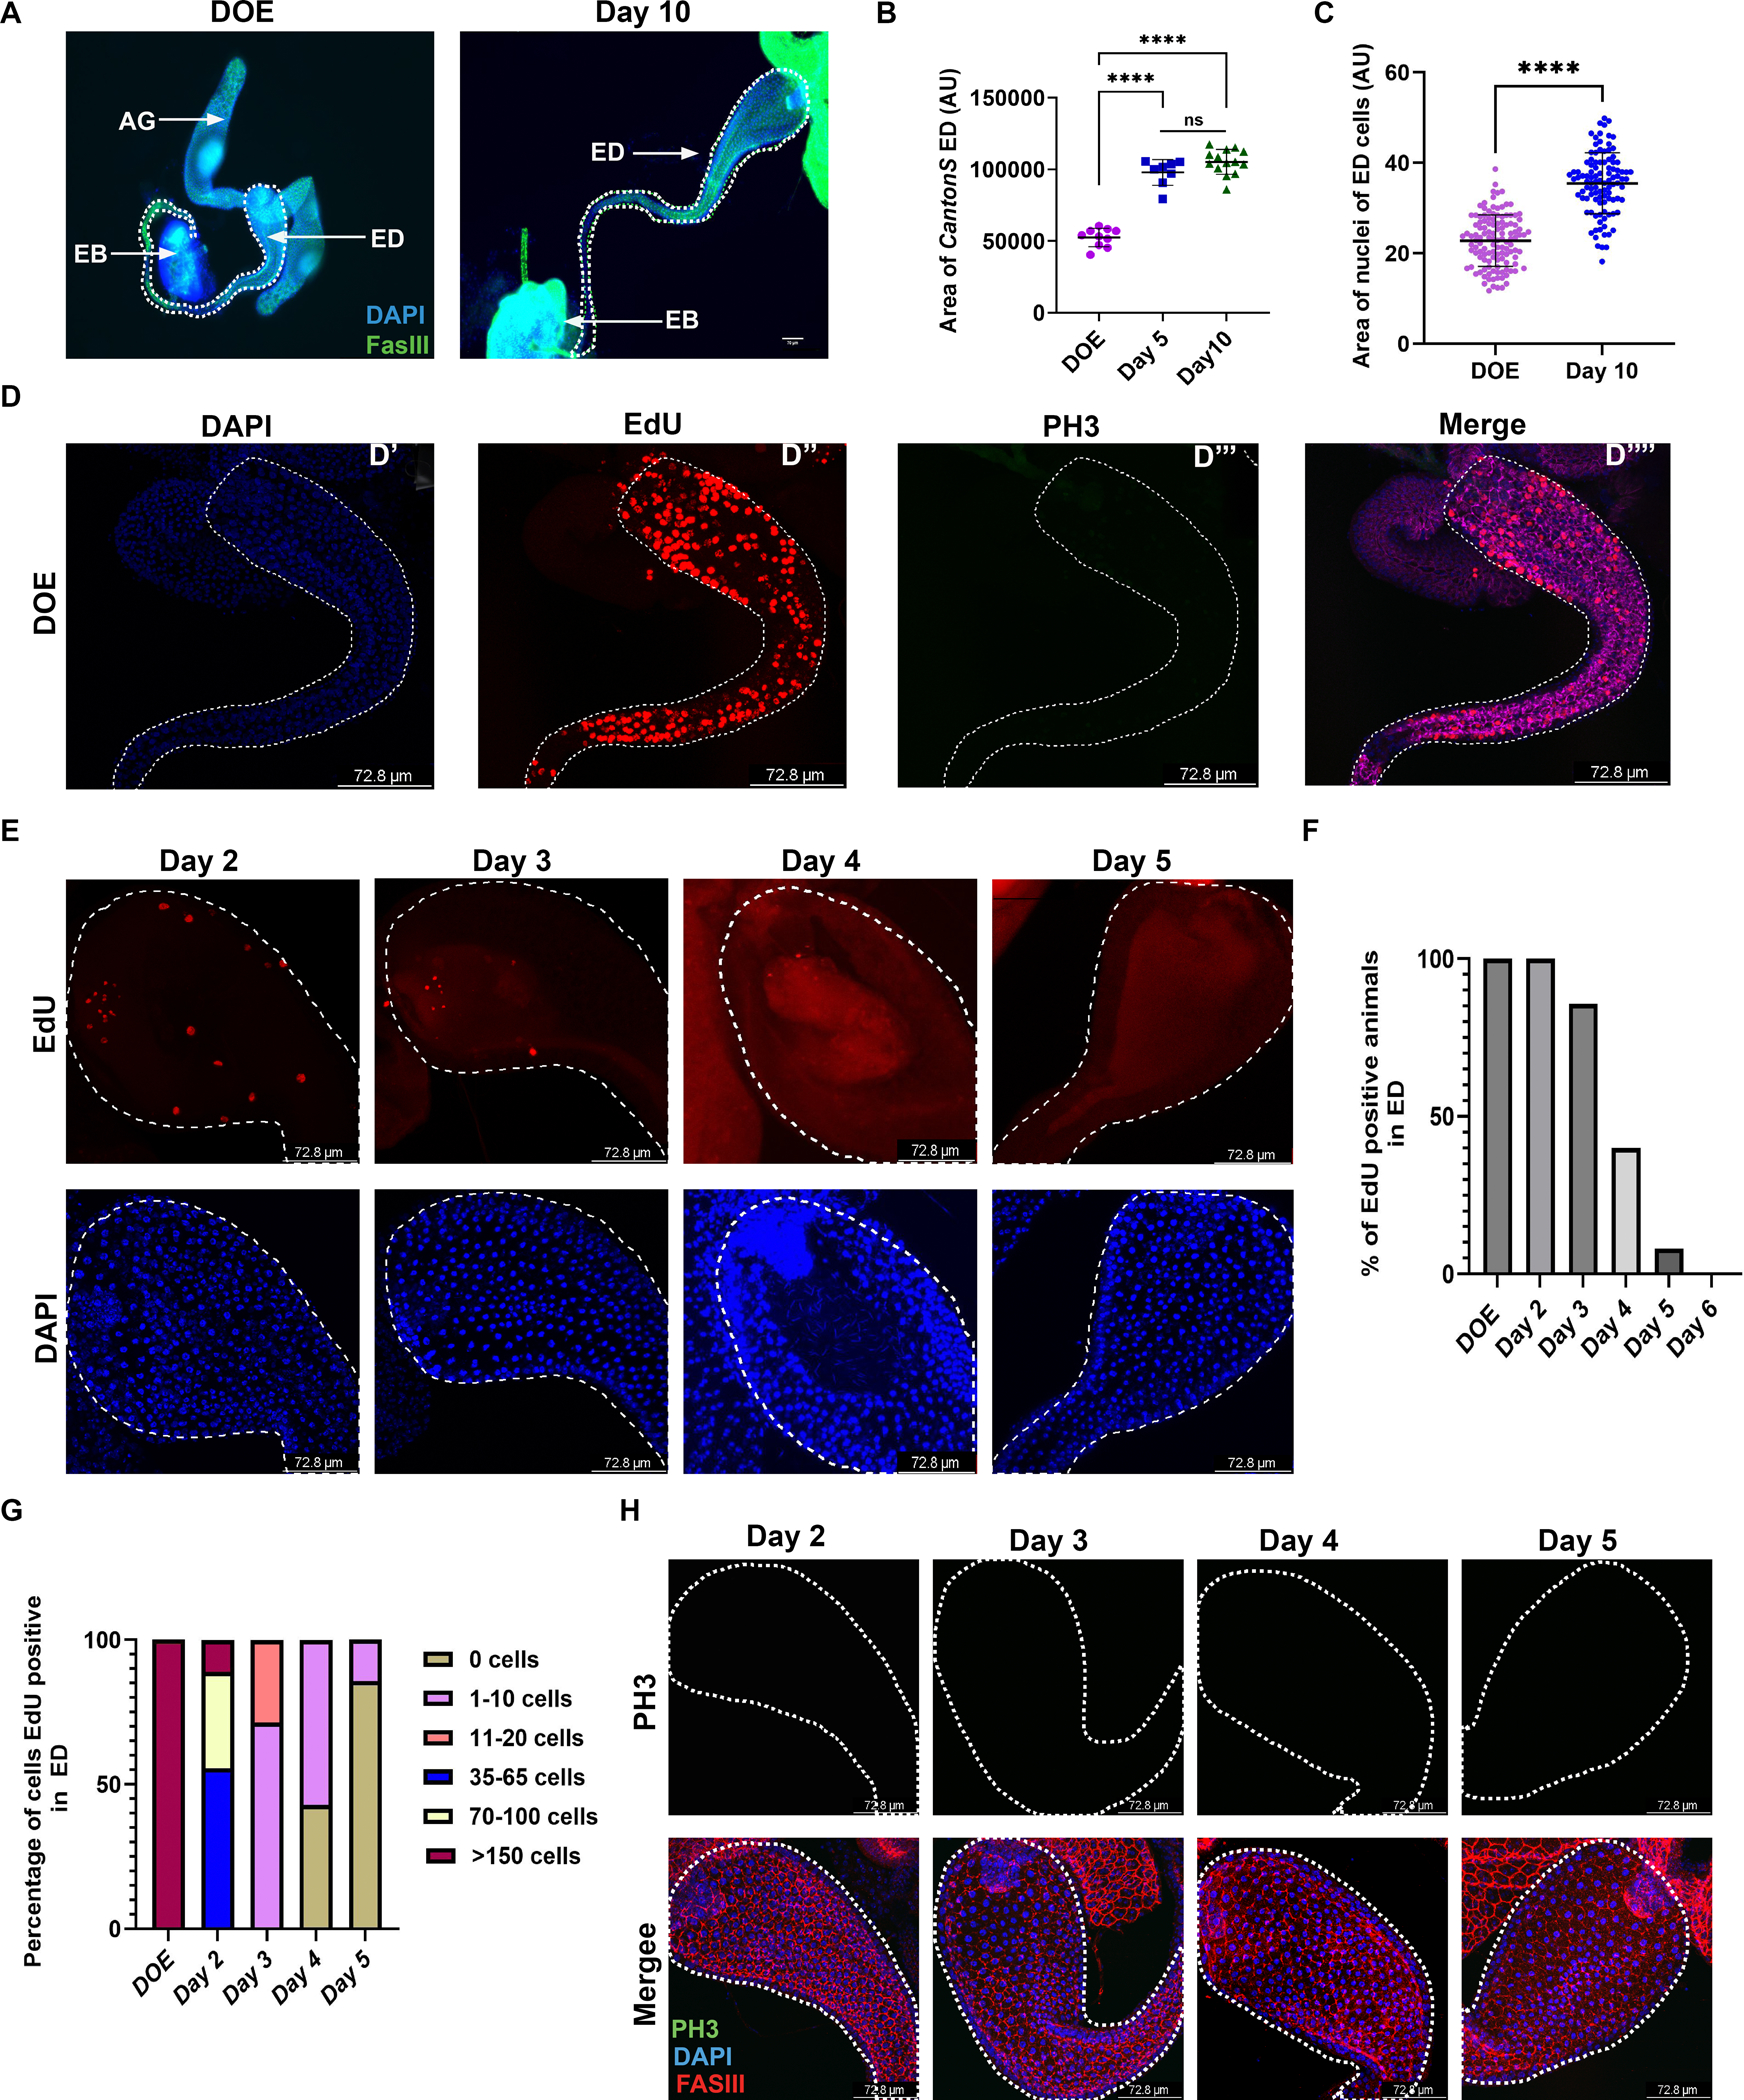
The Drosophila Ejaculatory duct (ED) is a secretory tissue of the somatic male reproductive system. The ED is involved in the secretion of seminal fluid components and ED-specific antimicrobial peptides that aid in fertility and the female post-mating response. The ED is composed of secretory epithelial cells surrounded by a layer of innervated contractile muscle. The ED grows in young adult males during the first 24 h post-eclosion, but the cell cycle status of the ED secretory cells and the role of post-eclosion ED growth have been unexplored. Here, we show that secretory cells of the adult Drosophila ED undergo variant cell cycles lacking mitosis called the endocycle, that lead to an increase in the cell and organ size of the ED post eclosion. The cells largely exit the endocycle by day 3 of adulthood, when the growth of the ED ceases, resulting in a tissue containing cells of ploidies ranging from 8C to 32C. The size of the ED directly correlates with the ploidy of the secretory cells, with additional ectopic endocycles increasing organ size. When endoreplication is compromised in ED secretory cells, it leads to reduced organ size, reduced protein synthesis and compromised fertility. We provide evidence that the growth and endocycling in the young adult male ED is dependent on Juvenile hormone (JH) signaling and we suggest that hormone-induced early adult endocycling is required for optimal fertility and function of the ED tissue. We propose to use the ED as a post-mitotic tissue model to study the role of polyploidy in regulating secretory tissue growth and function.


Figures

Figure 1:
Figure 1:. Endoreplication of secretory cells of the adult Drosophila Ejaculatory Duct and post-eclosion organ growth.
A. Images of adult ejaculatory duct (ED) on the day of eclosion (DOE) and day 10 showing an increase in the tissue size on Day 10. The ED is outlined with a dotted line. The tissue is labeled with Fas III antibody. The images were captured at 10X magnification. Scale bar: 70μm B. Quantification of the area of ED on DOE, Day 5, and Day 10 post-eclosion shows that the size of the ED increases from DOE to Day 5 and the growth ceases after Day 5 post-eclosion. Each dot represents the area of one ED from each male fly (n=at least 9 across 3 independent experiments). C. Quantification of the area of the nuclei of the secretory cells of the ED on DOE and Day 10 post-eclosion showing the increase in nuclear size. (n=9 with 10 nuclei from each animal measured.) D. Confocal micrographs of the ED on DOE (0–2hrs post-eclosion) with EdU incorporation in secretory cells of ED with no mitotic PH3 positive cells. EdU incorporation was performed with an ex vivo exposure for 1 hour. D’-DAPI, D”- EdU staining, D”’- mitosis marker PH3 antibody staining. D””- Merge with FasIII staining of ED. (n= at least 9) E. Confocal micrographs of ED with EdU incorporation that was done by feeding the adult animals with EdU for 24hrs prior to time points on Day 2, Day 3, Day 4, and Day 5. Nuclei were labeled with DAPI. (n= at least 9 for each timepoint) F. Quantification of the percentage of males that are EdU positive on DOE, Day 2, Day 3, Day 4, and Day 5 post-eclosion. G. Quantification of the percentage of cells that are EdU positive in each ED on DOE, Day 2, Day 3, Day 4, and Day 5 post-eclosion. We classified the total EdU-positive cells into multiple groups: 0 cells, 1–10 cells, 11–20 cells, 35–65 cells, 70–100 cells, and>150 cells that are EdU-positive. H. Micrographs of ED stained with the mitotic marker Phosphohistone H3 Ser10 (PH3) on Day 2, Day 3, Day 4, and Day 5. We did not observe any cells undergoing mitosis at any adult time points. (n= at least 9 for each timepoint). Statistical analysis performed for Figure 2 B–C, Two-tailed unpaired t-test. P<0.0001 **** Scale bar for panels D, E, H – 72.8 μm.
Figure 2:
Figure 2:. Post-eclosion endoreplication and growth of the ED is conserved in different Drosophila species.
A. Confocal micrographs of EDs from different Drosophila species labeled for 1 hour ex vivo with EdU on DOE (0–2hrs post-eclosion). Nuclei are labeled with DAPI, and the cell junctions of the secretory cells are labeled with anti-discs large (DLG). (n= at least 3 for each species) Scale bar:72.8 μm B. A phylogeny tree for subgroups of the different Drosophila species examined. C. Quantification of total EdU positive cells in different species on DOE performed with ex vivo EdU incorporation within 0–4 hrs post-eclosion. For day 10 EdU quantification we fed animals EdU until Day 10 and quantified the EdU incorporation on Day 10 (Male feeding begins ~6h post eclosion). (n= at least 3 for each species) D. Quantification of the area of the ED on DOE (0–2hrs PE) and Day 10. (n= at least 7 for each species) Statistical test performed: Two-way ANOVA with multiple comparisons between DOE and Day 10 for respective species. P<0.0001 ****
Figure 3:
Figure 3:. The ploidies of Drosophila Ejaculatory duct secretory cells correlate with local organ shape and size
A. Image of a whole ED, showing that the volume of the duct reduces from the anterior to posterior end. Based on this, we classified ED secretory nuclei into three zones, anterior, anterior-mid, and posterior. Zoomed images A’, A”, A”’ shows the nuclei of secretory cells from these respective regions of ED. Scale bar:388.3μm B. Quantification of the DNA content/ploidy from the nuclei of the secretory cells from the anterior, anterior-mid, and posterior regions of the ED. We quantified the ploidy from males at 10 days by measuring the DAPI intensity, normalized to the muscle-layer diploid cells from that specific region. (n= at least 9, repeated in three independent trials) C. (i) Quantification of the DNA content/ploidy on DOE by measuring images of the DAPI intensity, the endocycling secretory cells have ploidies of 4C, 8C, and 16C on DOE. (ii) Quantification of the ploidy of the secretory cells of ED by flow cytometry performed by isolating the nuclei from ED on DOE. The peak shaded in grey is from female ovaries which contains cells of known ploidies, and the ED is shown in red. Flow cytometry was performed three times, with a representative example shown. D. (i) Quantification of the DNA content/ploidy from the secretory cells of the ED on Day 10 post-eclosion by measuring the DAPI intensity from images. (ii) Quantification of the ploidy from the secretory cells of the ED by flow cytometry performed by isolating the nuclei from males on Day 10 post-eclosion. The peak shaded in grey is from female ovaries which contains cells of known ploidies, and the ED is shown in red. Flow cytometry was performed three times, with a representative example shown. E. Quantification of the DNA content/ploidies of secretory cells of the ED performed by measuring the DAPI intensity on different days post-eclosion showing that the ploidy distribution is unchanged and constant after Day 5. (n=7, From each animal we have quantified 30 nuclei) F. Quantification of the DNA content/ploidy of the secretory cells by measuring the DAPI intensity in different species, showing that the secretory cells of EDs of different Drosophila species we used are polyploid. (n= at least 9, from each animal we quantified 30 nuclei)
Figure 4:
Figure 4:. Compromising the endoreplication of ED secretory cells results in reduced ED size and fertility
A. Confocal micrograph of Drosophila male reproductive system showing the expression of Luna Gal4 specifically in ED secretory cells verified with the expression of UAS-nls-RFP in the ED cells. Scale bar: 388.3μm B. Confocal micrographs of ED on DOE with knockdown of E2F1, E2F2 using RNAi, Overexpression of Rbf280, and Dacapo-GFP using Luna Gal4. The upper panel is the EdU labeling on DOE with ex-vivo incubation in the background of all these manipulations in ED secretory cells. We stained the nuclei with DAPI to measure the DNA content. N= at last 9 for each genotype. Scale bar:72.8 μm C. Quantification of the Mean fluorescence intensity of EdU on DOE with knockdown of E2F1, E2F2 using RNAi, Overexpression of Rbf280, and dacapo GFP using Luna Gal4. D. Quantification of the area of the ED on DOE with knockdown of E2F1, and E2F2 using RNAi, Overexpression of Rbf280, and Dacapo-GFP using Luna Gal4. N= at last 9 for each genotype. E. Quantification of the DNA content/ploidy on DOE measured using the DAPI intensities in all the different backgrounds of Overexpression and knockdowns in secretory cells. F. Confocal micrographs of the ED on Day 10 post-eclosion labeled with DAPI show that the nuclei are smaller in E2F1 RNAi, E2F2 RNAi, Rbf 280, and Dacapo-GFP overexpression. Scale bar:72.8 μm G. Quantification of the nuclear area of the secretory cells of the ED on Day 10 post-eclosion showing reduced nuclear size in E2F1 RNAi, E2F2 RNAi, Rbf 280, and Dacapo-GFP overexpression conditions. H. Quantification of the Area of the ED on Day 10 post-eclosion showing reduced area of ED in E2F1 RNAi, E2F2 RNAi, Rbf 280, and Dacapo-GFP overexpression conditions. I. Quantification of the DNA content/ploidy of the secretory cells of the ED on Day 10 post-eclosion showing reduced ploidy in E2F1 RNAi, E2F2 RNAi, Rbf 280, and Dacapo-GFP overexpression conditions compared to the control. (N= at least 9 for each genotype, with ploidies measured from 30 nuclei in each ED). J. Quantification of fertility for males with reduced DNA content in the ED. MFI: Mean Fluorescence Intensity Statistical Analysis: Two-way ANOVA with multiple comparisons between control and Different knockdown and overexpression conditions. P<0.0001 ****
Figure 5:
Figure 5:. Inducing extra endoreplication in secretory cells of ED leads to organ hypertrophy
A. Confocal micrographs of EDs on DOE with overexpression of CycE-Cdk2, CycD-Cdk4, and knockdown of Geminin, or Rbf with RNAi using Luna Gal4. The upper panel is the EdU labeling performed by ex-vivo incubation on DOE, the lower panel is nuclei labeled with DAPI to measure the DNA content. N= at least 9 for each genotype. Scale bar:72.8 μm B. Quantification of the Mean fluorescence intensity of EdU on DOE in the condition with overexpression of CycE-Cdk2, CycD-Cdk4, and Geminin or Rbf with RNAi driven by Luna Gal4. C. Quantification of the area of the ED with overexpression of CycE-Cdk2, CycD-Cdk4, and Geminin or Rbf with RNAi driven by Luna Gal4. D. Confocal micrographs of the ED on Day 10 post-eclosion labeled with DAPI show that the nuclei and the ED are larger with overexpression of CycE-Cdk2, CycD-Cdk4, and knockdown of Geminin or Rbf with RNAi using Luna Gal4. Scale bar:72.8 μm E. Quantification of the nuclear area of the secretory cells of ED on Day 10 post-eclosion with the indicated transgenes. (N= at least 9, with 10 nuclei quantified from each ED) F. Quantification of the area of the ED on Day 10 post-eclosion expressing the indicated transgenes. G. Quantification of the DNA content/ploidy of the secretory cells of ED on Day 10 post-eclosion using DAPI measurements showing increased ploidy with overexpression of CycE-Cdk2, CycD-Cdk4, and knockdown of Geminin or Rbf with RNAi using Luna Gal4 compared to the control. H. Quantification of male fertility for animals expressing the indicated transgenes driven by Luna-Gal4. The animals with increased ED DNA content do not have significant differences in the number of offspring. MFI: Mean Fluorescence Intensity Statistical Analysis: Two-way ANOVA with multiple comparisons between control and Different knockdown and overexpression conditions. P<0.0001 ****
Figure 6:
Figure 6:. Stabilized Geminin effectively blocks the adult endoreplication in the ejaculatory duct
A. Confocal micrograph of the ED on DOE (0–2hrs) with EdU labeling performed ex vivo. A nearly complete block of endocycling is observed when stabilized Geminin is expressed. Nuclei are labeled with DAPI. Scale bar:72.8 μm B. Quantification of the mean fluorescence intensity of the EdU incorporated on DOE shows significantly reduced EdU with stabilized Geminin expression compared to the control. N=at least 11 per sample. C. Quantification of the percentage of cells that are EdU positive on DOE in each ED performed with ex vivo EdU incorporation. We classified the total EdU-positive cells into multiple groups: 0 cells, 1–5 cells, 6– 10 cells, 11–17 cells, and>150 cells that are EdU-positive in each ED of control and stabilized Geminin. D. Quantification of the area of ED on DOE with the indicated transgenes driven by Luna Gal4. E. Quantification of the DNA content/ploidy of the secretory cells on DOE with the indicated transgenes driven by Luna Gal4. F. Confocal micrographs of the ED on Day 10 post-eclosion labeled with DAPI and cell junction marker Fas III show that the nuclei are smaller with overexpression of stabilized Geminin compared to the control. G. Quantification of the area of ED on Day 10 with the indicated transgenes driven by Luna Gal4. H. Quantification of the DNA content/ploidy of the secretory cells of ED on Day 10 post-eclosion showing reduced ploidy in stabilized Geminin overexpression conditions compared to the control. I. Quantification of male fertility for animals with the indicated transgenes driven by Luna Gal4. The animals with stabilized Geminin overexpression have significantly reduced offspring compared to the control. Statistical Analysis: unpaired Two-tailed t-test. P<0.0001 ****
Figure 7:
Figure 7:. Juvenile hormone (JH) signaling promotes post-eclosion endoreplication and growth of Drosophila ejaculatory duct
A. Confocal micrographs of ED on DOE with knockdown of Juvenile hormone receptors Gce, Met, and transcription factor tai with RNAi using Luna Gal4. The control expresses mCherry RNAi driven by Luna Gal4. The upper panel is the EdU labeling on DOE. Nuclei are labeled with DAPI (lower panels) to measure the DNA content. Scale bar:72.8 μm B. Quantification of EdU incorporated on DOE shows reduced EdU with knockdown of Gce, Met, and tai with RNAi using Luna Gal4. N= at least 9 per genotype. C. Quantification of the area of ED on DOE with the indicated transgenes driven by Luna Gal4. (n= at least 9 per genotype) D. Confocal micrographs of the ED on Day 10 post-eclosion labeled with DAPI for the indicated transgenes driven by Luna Gal4. Nuclei are smaller with knockdown of Gce, met, or tai compared to the control. E. Quantification of the area of the ED on Day 10 post-eclosion for the indicated transgenes driven by Luna Gal4.(n= at least 7 per genotype, overlapping or damaged tissues were removed from analysis) F. Quantification of the DNA content/ploidy of the secretory cells of ED on Day 10 post-eclosion for the indicated transgenes driven by Luna Gal4. Reduced ploidy is observed for knockdown of Gce, met or tai. G. Quantification of male fertility for animals expressing the indicated transgenes driven by Luna Gal4. Fertility is reduced with the knockdown of Gce, met or tai. Statistical Analysis: Two-way ANOVA with multiple comparisons between control and Different knockdown and overexpression conditions. P<0.0001 ****
Figure 8:
Figure 8:. Juvenile hormone signaling is sufficient to induce endoreplication in the adult Drosophila ejaculatory duct.
A. Confocal micrograph of EdU incorporation on DOE (0–2 hrs PE) with vehicle only control (acetone, A’, A”) or Juvenile hormone (JH) III with 1-hour ex-vivo incubation (A”’, A””) control EDs or EDs expressing stabilized Geminin to block the endocycle. Top panel EdU, bottom panel DAPI staining. Scale bar:72.8 μm B. Quantification of the Mean fluorescence intensity (MFI) of the EdU signal per ED. N= at least 4 per genotype and treatment. C. Quantification of the percentage of cells that are EdU positive with ex vivo acetone and JH III incubation on DOE for EDs expressing the indicated transgenes. Controls express Luna-Gal4 only. We classified the total EdU-positive cells into multiple groups: 0 cells, 1–10 cells, 11– 20 cells, 20–50 cells, 60– 100, and>150 cells that are EdU-positive in each ED of control and stabilized Geminin. D. Confocal micrograph of EdU incorporation in ED on DOE (0–2 hrs PE) with Acetone control (No JH) and JH III with 1-hour ex-vivo incubation along with the EdU in controls and EDs expressing Dacapo-GFP to block the endocycle. The top panel EdU, middle panel is DAPI staining, and the bottom panel is the expression of Dacapo GFP. Scale bar:72.8 μm. E. Quantification of the MFI of EdU per ED in both Dacapo GFP and controls incubated with JHIII or vehicle only (No JH, acetone). (N= at least 7 per genotype and treatment) Statistical Analysis: Unpaired t-test, P< 0.0001 ****
Figure 9:
Figure 9:. JH signaling and the endocycle are required for proper protein synthesis in the ED
A. Confocal images of ED after OPP nascent protein synthesis assay for 10 minutes on Day 10 with the indicated transgenes driven by Luna-Gal4, with UAS-nls RFP. The top panel shows OPP incorporation, the bottom panel is a merge with OPP in Green, UAS-nlsRFP in red and DAPI in blue. Scale Bar:73μm B. Quantification of the Mean Fluorescence Intensity of OPP in ED on Day 10 with mcherry RNAi, tai RNAi, Gce RNAi, or met RNAi, driven using LunaGal4nls RFP. OPP intensity is normalized to the total area of the ED. N= at least 9 EDs per genotype. C. Confocal images of ED after OPP nascent protein synthesis assay for 10 minutes on Day 10 with mcherry, E2F1 or E2F2 RNAis, or overexpression of Rbf280 or stabilized Geminin driven using LunaGal4nls RFP. The top panel shows OPP incorporation, the bottom panel is the merged image with OPP in green, UAS-nlsRFP in red and DAPI in blue. Scale Bar:73.2μm D. Quantification of the Mean fluorescence intensity of OPP from panel C that is normalized to the area of the ED. N= at least 7 EDs per genotype. E. Confocal images of EDs after OPP nascent protein synthesis assay for 10 minutes on Day 10 in controls or overexpression of dacapo-GFP driven by LunaGal4. The top panel is the images of OPP incorporation, the bottom panel is the merge with OPP in red, dacapo-GFP expression in green, and DAPI in blue. Scale Bar:73μm F. Quantification of the Mean fluorescence intensity of OPP from panel E that is normalized to the area of the ED. N= at least 9 EDs per genotype. G. Confocal images of EDs after OPP nascent protein synthesis assay for 10 minutes on Day 10 with the indicated transgenes driven by Luna-Gal4 with UAS-nlsRFP. The top panel is the images of OPP incorporation, the bottom panel is the merge with OPP in green, nls RFP expression in red, and DAPI in blue. Scale Bar:73μm H. Quantification of the Mean fluorescence intensity of OPP from panel G that is normalized to the area of the ED. N= at least 8 EDs per genotype. Statistical Analysis: Two-way ANOVA with multiple comparisons between control and Different knockdown, overexpression conditions. P<0.0001 ****
Figure 10:
Figure 10:. Protein Synthesis in the secretory cells of the ED requires mTOR signaling and is coupled via the endocycle
A. Confocal images of EDs after OPP nascent protein synthesis assay for 10 minutes on Day 10 with mCherry RNAi or overexpression of Rheb driven by LunaGal4 with UAS-nls RFP. The top panel is the images of OPP incorporation in the ED, the bottom panel is the merge with OPP in green, nlsRFP in red, and DAPI in blue. Scale Bar:90.2μm B. Quantification of the Mean Fluorescence Intensity (MFI) of the OPP signal on from panel A, OPP intensity is normalized to the area of the ED. N= at least 9 EDs per genotype. C. Confocal images of EDs after OPP nascent protein synthesis assay for 10 minutes on Day 10 with mCherry, S6K, or mTOR RNAis, driven by LunaGal4 with UAS-nls RFP. The top panel is the images of OPP incorporation, the bottom panel is the merge with OPP in green, nlsRFP in red, and DAPI in blue. Scale Bar:90μm D. Quantification of the Mean Fluorescence Intensity (MFI) of the OPP on Day 10 from panel C, OPP intensity is normalized to the area of the ED. N= at least 9 EDs per genotype. E. Quantification of the DNA content/ploidy of the secretory cells of ED on Day 10 post-eclosion for controls expressing mCherry RNAi, versus Rheb overexpression, knockdown of S6K or mTOR by RNAi. Reduced ploidy is observed in S6K or mTOR knockdown conditions. F. Quantification of the area of the ED on Day 10 post-eclosion with overexpression of Rheb, or knockdown of S6K or mTOR with RNAi driven by Luna Gal4 with UAS-nls RFP. N= at least 6 EDs per genotype. Statistical Analysis: Figure 10B: Two-tailed unpaired t-test. P<0.0001 ****. Figure 10D, F: Unpaired Two-way ANOVA with multiple comparisons between control and Different knockdown and overexpression conditions. P<0.0001 ****
Figure 11.
Figure 11.
A model for ED organ growth and protein synthesis driven by endoreplication induced by JH signaling.

Update of

Similar articles

Cited by

References

    1. Ahmad SM, Baker BS, 2002. Sex-specific deployment of FGF signaling in Drosophila recruits mesodermal cells into the male genital imaginal disc. Cell 109, 651–661. - PubMed
    1. Alyagor I, Berkun V, Keren-Shaul H, Marmor-Kollet N, David E, Mayseless O, Issman-Zecharya N, Amit I, Schuldiner O, 2018. Combining Developmental and Perturbation-Seq Uncovers Transcriptional Modules Orchestrating Neuronal Remodeling. Dev Cell 47, 38–52 e36. - PMC - PubMed
    1. Avila FW, Sánchez-López JA, McGlaughon JL, Raman S, Wolfner MF, Heifetz Y, 2016. Nature and Functions of Glands and Ducts in the Drosophila Reproductive Tract, in: Cohen E, Moussian B (Eds.), Extracellular Composite Matrices in Arthropods. Springer International Publishing, Cham, pp. 411–444.
    1. Bairati A, 1968. STRUCTURE AND ULTRASTRUCTURE OF THE MALE REPRODUCTIVE SYSTEM IN DROSOPHILA MELANOGASTER MEIG. Monitore Zoologico Italiano - Italian Journal of Zoology 2:3–4, 105–182.
    1. Balk SP, Knudsen KE, 2008. AR, the cell cycle, and prostate cancer. Nucl Recept Signal 6, e001. - PMC - PubMed

Publication types

LinkOut - more resources