. 2024 Dec 24;7(1):1698.
doi: 10.1038/s42003-024-07422-9.

Structure and dynamics of the interaction of Delta and Omicron BA.1 SARS-CoV-2 variants with REGN10987 Fab reveal mechanism of antibody action

Affiliations

Structure and dynamics of the interaction of Delta and Omicron BA.1 SARS-CoV-2 variants with REGN10987 Fab reveal mechanism of antibody action

Ekaterina N Lyukmanova et al. Commun Biol. .

Abstract

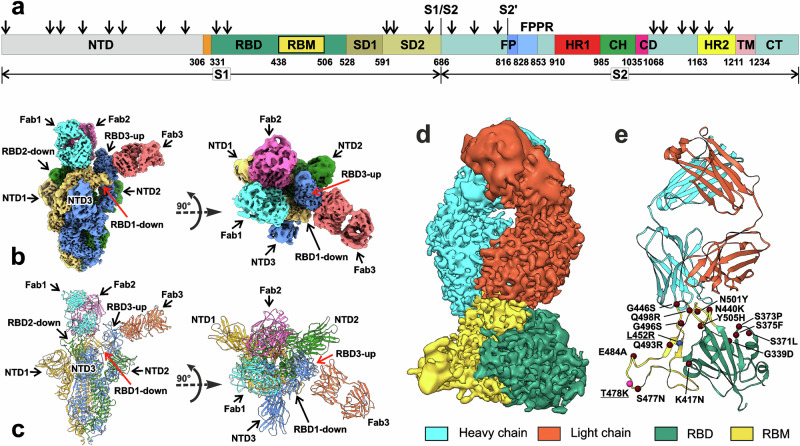
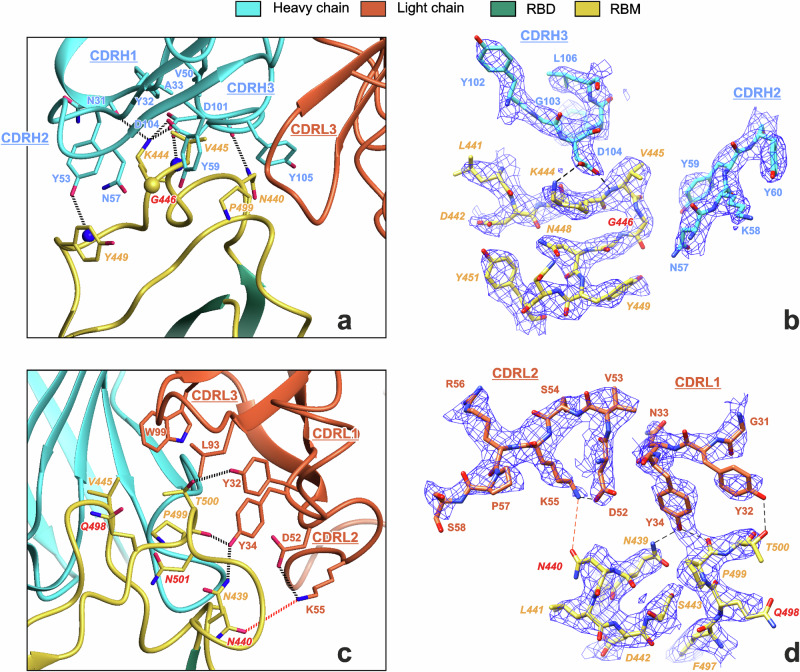
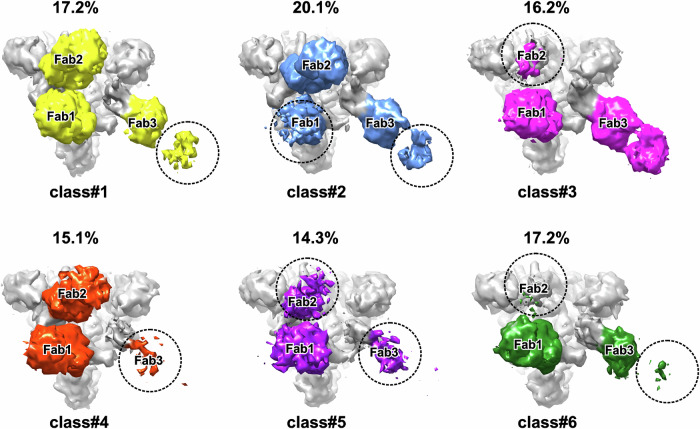
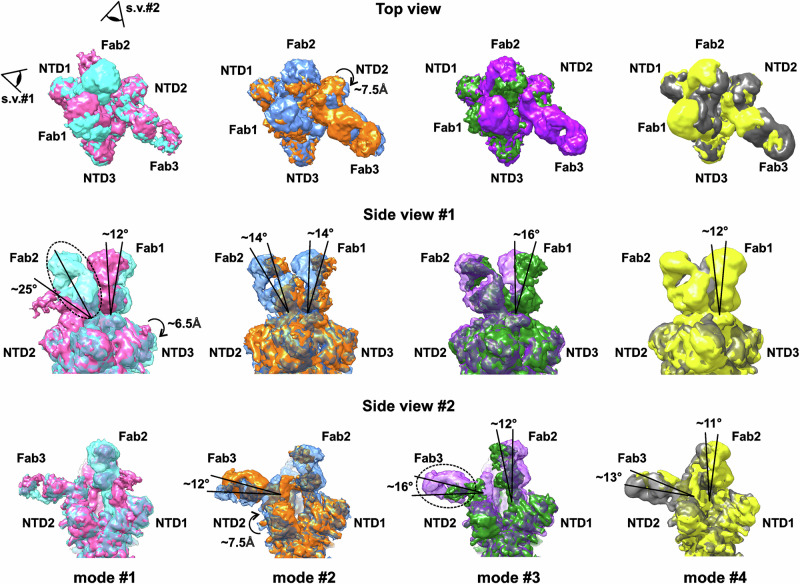
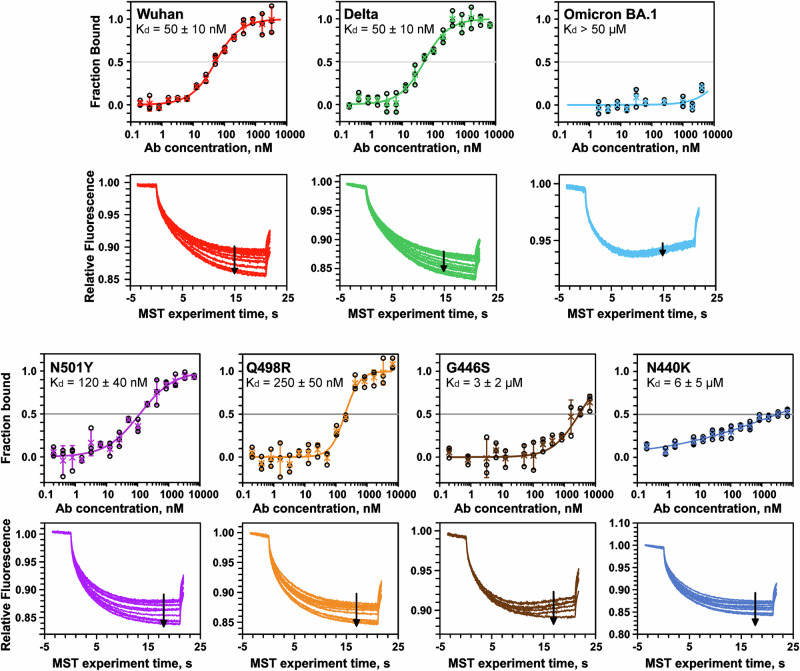
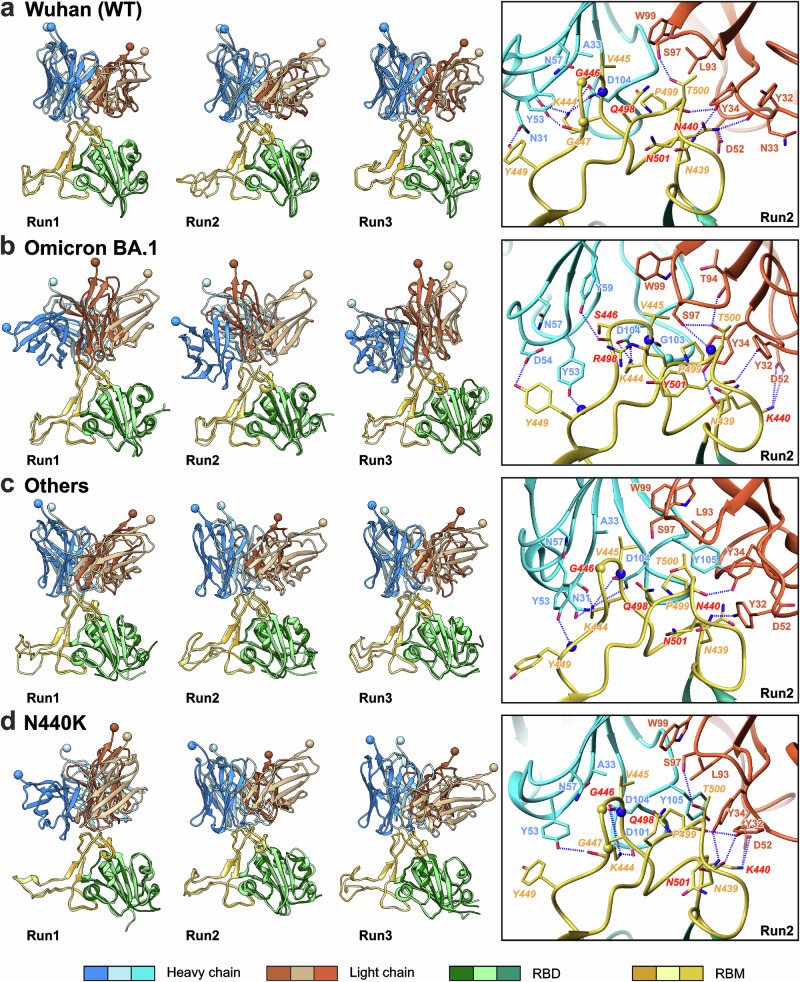
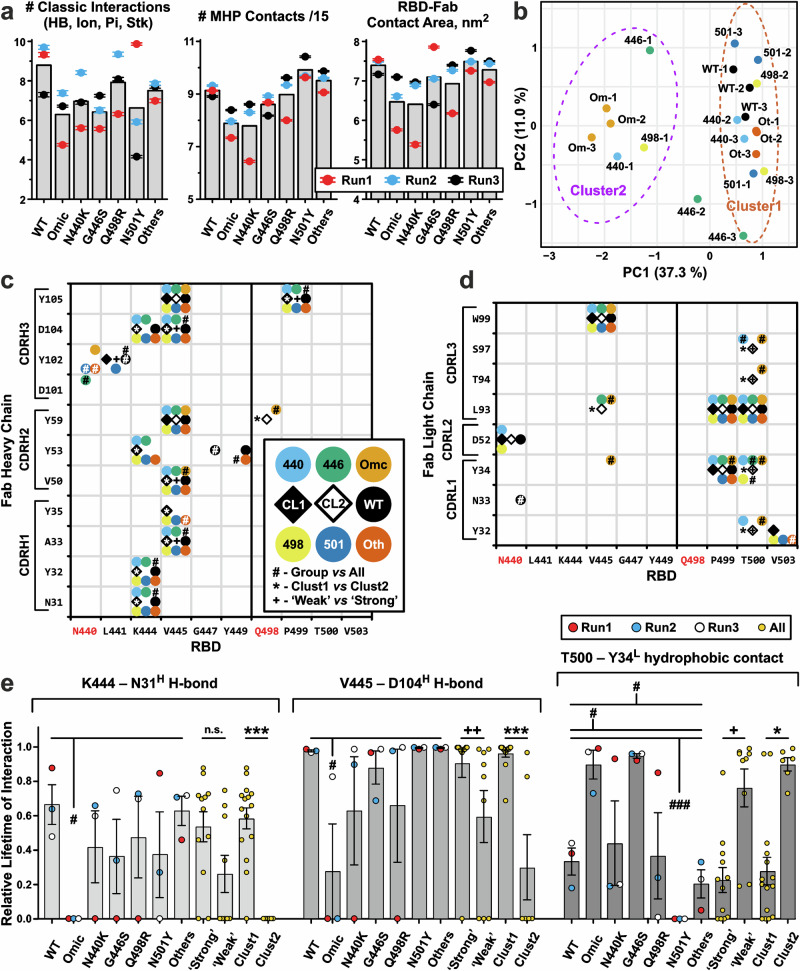
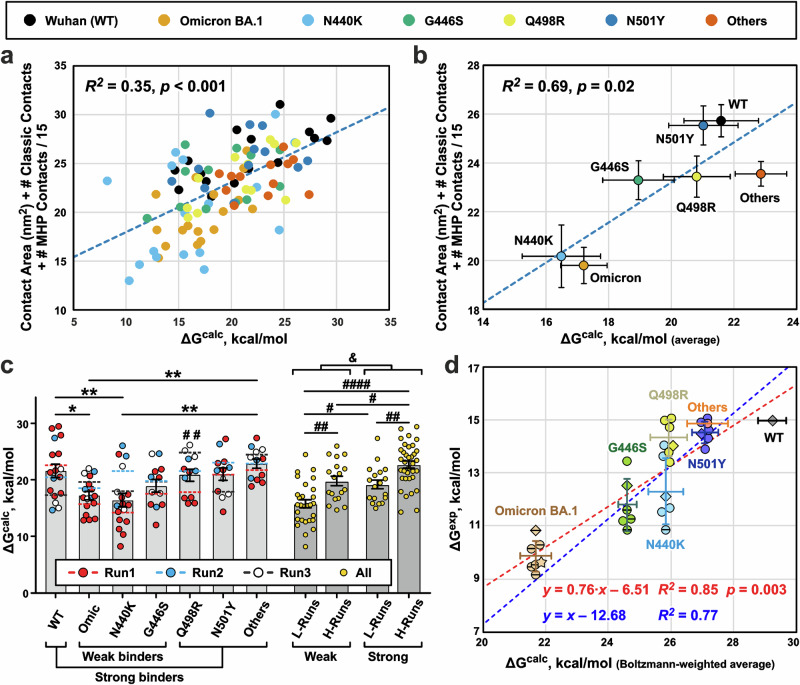
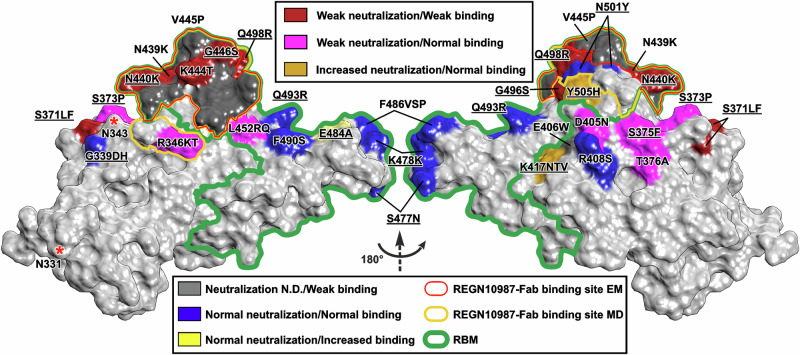
Study of mechanisms by which antibodies recognize different viral strains is necessary for the development of new drugs and vaccines to treat COVID-19 and other infections. Here, we report 2.5 Å cryo-EM structure of the SARS-CoV-2 Delta trimeric S-protein in complex with Fab of the recombinant analog of REGN10987 neutralizing antibody. S-protein adopts "two RBD-down and one RBD-up" conformation. Fab interacts with RBDs in both conformations, blocking the recognition of angiotensin converting enzyme-2. Three-dimensional variability analysis reveals high mobility of the RBD/Fab regions. Interaction of REGN10987 with Wuhan, Delta, Omicron BA.1, and mutated variants of RBDs is analyzed by microscale thermophoresis, molecular dynamics simulations, and ΔG calculations with umbrella sampling and one-dimensional potential of mean force. Variability in molecular dynamics trajectories results in a large scatter of calculated ΔG values, but Boltzmann weighting provides an acceptable correlation with experiment. REGN10987 evasion of the Omicron variant is found to be due to the additive effect of the N440K and G446S mutations located at the RBD/Fab binding interface with a small effect of Q498R mutation. Our study explains the influence of known-to-date SARS-CoV-2 RBD mutations on REGN10987 recognition and highlights the importance of dynamics data beyond the static structure of the RBD/Fab complex.


Conflict of interest statement

Competing interests: The authors declare no competing interests.

Figures

Fig. 1
Fig. 1. Cryo-EM structure of the full-length Delta SARS-CoV-2 S-protein in the complex with REGN10987-Fab.
a Schematic representation of the sequence of full-length SARS-CoV-2 S-protein. Segments of S1 and S2 subunits include: NTD N-terminal domain, RBD receptor-binding domain, RBM receptor-binding module, SD1 and SD2, C-terminal subdomains 1 and 2; S1/S2, S1/S2 cleavage site; S2′, S2′ cleavage site; FP fusion peptide, FPPR fusion peptide proximal region, HR1 heptad repeat 1, CH central helix region, CD connector domain, HR2 heptad repeat 2, TM transmembrane helix, CT cytoplasmic tail; and arrow symbols for glycans. b, c Cryo-EM map of the Delta S-protein/Fab complex refined to 2.5 Å resolution and pseudoatomic model of the complex after local refinement of RBD/Fab regions. Three protomers (1, 2, and 3) of S-protein and the attached Fabs are color coded. RBD1/Fab1 and RBD2/Fab2 complexes are in ‘down’’ conformation, while RBD3/Fab3—in ‘up’’. d, e Cryo-EM map and modeled structure of the RBD1/Fab1 complex after focused refinement to 3.2 Å. The sites of Delta (blue and magenta spheres, underlined) and Omicron BA.1 (magenta and brown spheres) mutations are shown.
Fig. 2
Fig. 2. Cryo-EM data reveal an interaction interface between REGN10987-Fab and Delta-RBD.
Interaction of the heavy (a, b) and light (c, d) chains of REGN10987-Fab with the Delta-RBD. Residues of RBD are in italic font. Residues mutated in the Omicron BA.1 variant are shown in red font. Hydrogen bonds are shown by black dotted/dashed lines. The red dotted/dashed lines illustrate proximity of N440 and K55L sidechains (distance 4.6 Å). CA atom of Gly446, backbone NH atoms, and backbone CO-groups are shown as yellow sphere, blue spheres, and sticks, respectively. Complementarity-determining regions (CDRs) of heavy and light chains are labeled.
Fig. 3
Fig. 3. Overview of 3D classes derived from the Delta S-protein/REGN10987-Fab dataset.
Top views of the S-protein/Fab complexes are shown. Dashed circles indicate missing regions of the EM density map.
Fig. 4
Fig. 4. Four major modes of motion in the Delta S-protein/REGN10987-Fab complex detected by 3D variability analysis (3DVA).
Modes of motion are arranged by columns. For each mode, the two extreme structures are shown in different colors. Dashed ellipses indicate missing regions of the EM density map. The tilting motions of the RBD/Fab complexes and displacements of NTD are shown.
Fig. 5
Fig. 5. Microscale thermophoresis (MST) study of the REGN10987 affinity to the mutant RBDs.
Top panels: binding curves, datapoints are mean ± SD (n = 3 independent experiments). Bottom panels: MST traces. Arrows indicate increase in antibody concentrations. Obtained Kd values (±standard error of fit) are shown.
Fig. 6
Fig. 6. Extreme (left panels) and mean (right panels, boxed) structures of the first eigenmode of motion from the 500–1000 ns part of the RBD/REGN10987-Fab MD trajectories.
RBD complexes with the Fab’s N-terminal domain are shown for three MD replicas (Run1 to Run3) for the RBD variants Wuhan (a), Omicron BA.1 (b), Delta/‘‘Others’’ (c), and Delta/N440K (d). Residues mutated in the Omicron BA.1 variant are shown in red font. CA atoms of the Gly RBD residues, backbone NH atoms, and backbone CO-groups are shown as yellow spheres, blue spheres, and sticks, respectively. To illustrate the amplitude of motions, the C′ atoms of residues A121H and G111L of the Fab’s N-terminal domain are shown as spheres.
Fig. 7
Fig. 7. Intermolecular interactions in the 500–1000 ns parts of the RBD/REGN10987-Fab MD trajectories.
a Average characteristics of MD trajectories (three replicas for each RBD variant, Run1 to Run3). The total number of ‘classic’’ RBD-Fab interactions (ionic, H-bond, π-cation, and stacking) and molecular hydrophobicity potential (MHP) contacts divided by 15, as well as the RBD-Fab contact area in the complex are shown. The scaling factor ‘15’’ was used to approximately equalize the number of ‘classic’’ and MHP contacts. MHP contacts include hydrophobic-hydrophobic and polar-polar intermolecular interactions. Data are mean ± S.E.M. (n = 500, 1 point per 1 ns of MD simulation). Bars denote means calculated over the three replicas. b Clustering of the MD replicas by K-means algorithm. Ellipses on a PCA plot show the 95% confidence interval of the clusters. Each MD trajectory was represented by a vector containing the lifetimes of all observed RBD-FAB contacts (Supplementary Data 1-9). Maps of the intermolecular contacts of the heavy (c) and light (d) Fab chains with RBDs. Interactions with an average (over the three replicas) lifetime ≥35% are shown as circles of different colors for different RBD variants. The 35% threshold was chosen to exclude situations where an interaction is presented in only one replica. Open and filled diamonds indicate interactions observed in 35% of trajectories from Cluster2 (trajectories Omic-1, Omic-2, Omic-3, 440-1, 446-1, and 498-1) and Cluster1 (all others trajectories), respectively. e Lifetimes (mean ± S.E.M., n = 3 independent MD replicas) of some intermolecular interactions normalized to the MD replica length. (ce) #, *, + (p < 0.05), ++ (p < 0.01), and ###, ***(p < 0.001) indicate significant difference in the interaction lifetimes in the following comparisons: (#) the replicas of a particular RBD variant vs all other replicas (cumulatively); (*) Cluster1 vs Cluster2 replicas; and (+) MD trajectories of ‘Weak’’ vs ‘Strong’’ binders, respectively, according to the Mann–Whitney test. No correction for multiple comparisons was used. Group of ‘Strong’’ binders includes WT, ‘Others’’, Q498R, and N501Y RBDs. Group of ‘Weak’’ binders includes Omicron, N440K, and G446S RBDs. In addition, it was required that the difference in average interaction lifetime between the compared groups was >25%.
Fig. 8
Fig. 8. Calculation of free energy changes (ΔGcalc) upon dissociation of RBD/REGN10987-Fab complexes.
a ΔGcalc values calculated for the different RBD variants using different initial conformations (n = 99, in total) positively correlate with the structural characteristics of these conformations (Supplementary Data 1-11 and 1-12). b Same as (a), but averaged for each RBD variant (arithmetic mean ± S.E.M., n = 17 for Wuhan, Omicron, N440K RBD variants, and n = 12 for other RBD variants). c Calculated ΔGcalc values vs RBD variant/MD replica (Run1 to Run3). Bars are the averages (arithmetic mean ± S.E.M., the n numbers are the same as in (b)) for the RBD variants, and dashed lines are means for the replicas. *(p < 0.05) and **(p < 0.01) indicate significant differences between the RBD variants according to one-way ANOVA/Tukey test. #(p < 0.05), ##(p < 0.01), and ####(p < 0.0001) indicate significant differences between the four groups of MD replicas according to two-way ANOVA/Tukey test. Groups: Weak+L-Runs (Omic-1, 440-1, and 446-1), Weak+H-Runs (Omic-2, Omic-3, 440-2, 440-3, 446-2, and 446-3), Strong+L-Runs (WT-3, 498-1, 501-3, and Oth-1), Strong+H-Runs (WT-1, WT-2, 498-2, 498-3, 501-1, 501-2, Oth-2, and Oth-3). &(p = 1.7 × 10−6, n = 99 independent ΔG calculations, two-tailed t-test) indicates significant difference between ‘Weak’’ and ‘Strong’’ binders. d Boltzmann-weighted averaged ΔGcalc values (abscissa, Boltzmann-weighted mean ± Boltzmann-weighted SD, N = 12–17, Supplementary Data 1-13) for different RBD variants show a strong positive correlation with the averaged experimental ΔGexp values (ordinate, arithmetic mean ± SD, N = 6, Supplementary Data 1-14). ΔGexp values recalculated from the MST data (Fig. 5) are shown as diamonds. ΔGexp values recalculated from EC50 and Kd values reported in the literature,,,, are shown as circles. Datapoints for the N440K, G446S, and Omicron BA.1 variants corresponding to lower estimates of EC50 or Kd values,,,, are shown by horizontally crossed circles and diamond. ΔGexp value for the Omicron BA.1 variant recalculated from the measured EC50 value is shown as a star. Only one experimental data point is present for the ‘Others’’ RBD variant. The different ΔGexp data sets were aligned assuming that the dissociation free energy for WT RBD is 15 kcal/mol. Therefore, only one data point is shown for the WT variant. Blue and red dashed lines represent regressions to linear models with unitary and variable slope, respectively.
Fig. 9
Fig. 9. Map of the RBD mutations found in different Omicron variants.
RBM, the site where ACE2 binds, as well as REGN10987-Fab binding sites from cryo-EM structure and MD simulations are shown by green, red, and yellow contours, respectively. Mutations are colored according to their effect on virus neutralization by REGN10987, and according to their effect on the antibody binding. The coloring scheme is shown in the legend. Neutralization data were taken from,,,. The binding data were taken from,,,. Mutations found in the Omicron BA.1 variant are underlined. Glycosylation sites are marked with asterisks.

Similar articles

Cited by

References

    1. Focosi, D. et al. Monoclonal antibody therapies against SARS-CoV-2. Lancet Infect. Dis.22, e311–e326 (2022). - PMC - PubMed
    1. Guo, M. et al. Multi-omics for COVID-19: driving development of therapeutics and vaccines. Natl. Sci. Rev.10, nwad161 (2023). - PMC - PubMed
    1. Padhi, A. K., Kalita, P., Maurya, S., Poluri, K. M. & Tripathi, T. From de novo design to redesign: harnessing computational protein design for understanding SARS-CoV-2 molecular mechanisms and developing therapeutics. J. Phys. Chem. B127, 8717–8735 (2023). - PubMed
    1. Liang, L., Wang, B., Zhang, Q., Zhang, S. & Zhang, S. Antibody drugs targeting SARS-CoV-2: time for a rethink? Biomed. Pharmacother.176, 116900 (2024). - PubMed
    1. Carabelli, A. M. et al. SARS-CoV-2 variant biology: immune escape, transmission and fitness. Nat. Rev. Microbiol.21, 162–177 (2023). - PMC - PubMed

MeSH terms

Substances

Supplementary concepts