. 2024 Dec 24;9(1):256.
doi: 10.1038/s41541-024-01052-2.

Mpox mRNA-1769 vaccine inhibits orthopoxvirus replication at intranasal, intrarectal, and cutaneous sites of inoculation

Affiliations

Mpox mRNA-1769 vaccine inhibits orthopoxvirus replication at intranasal, intrarectal, and cutaneous sites of inoculation

Catherine A Cotter et al. NPJ Vaccines. .

Abstract

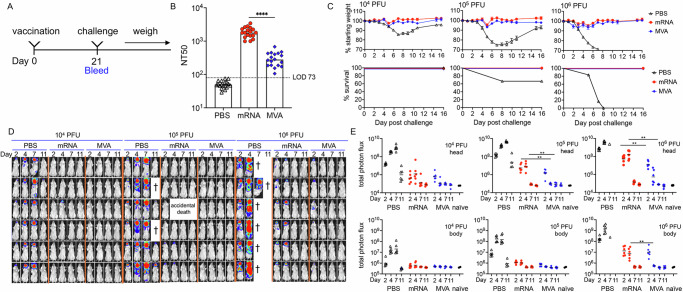
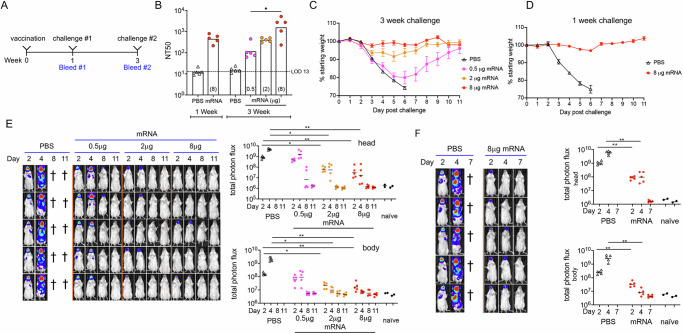
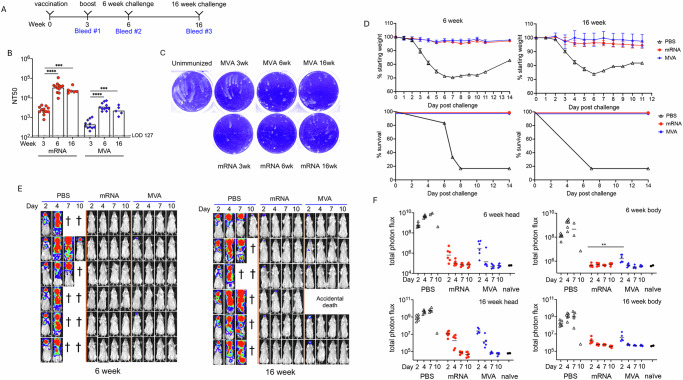
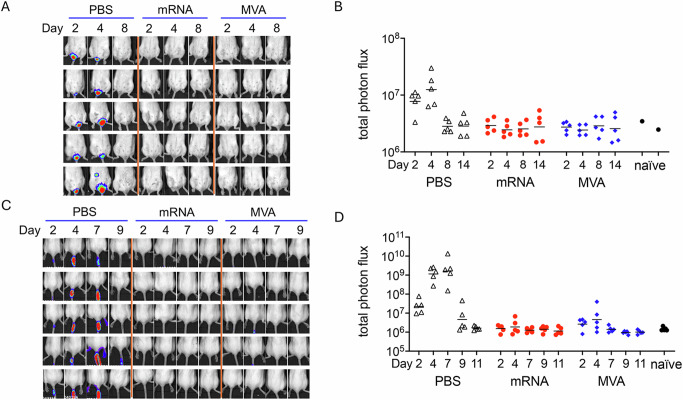
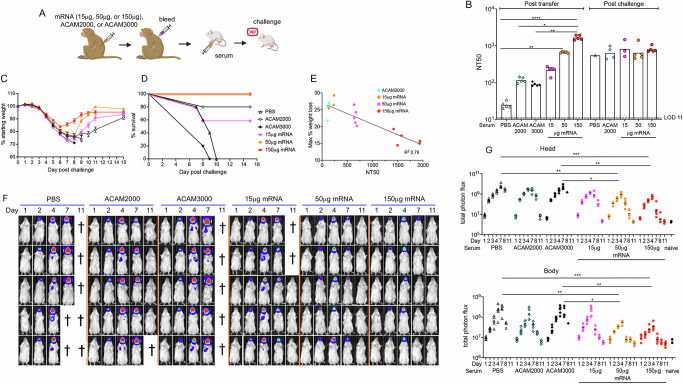
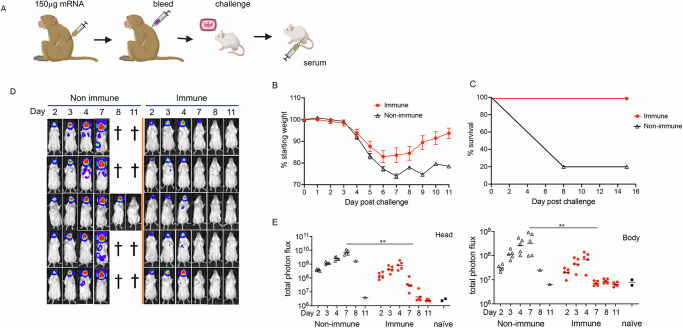
We previously reported that mice immunized twice with a lipid nanoparticle vaccine comprising four monkeypox viral mRNAs raised neutralizing antibodies and antigen-specific T cells and were protected against a lethal intranasal challenge with vaccinia virus (VACV). Here we demonstrated that the mRNA vaccine also protects mice against intranasal and intraperitoneal infections with monkeypox virus and bioluminescence imaging showed that vaccination greatly reduces or prevents VACV replication and spread from intranasal, rectal, and dermal inoculation sites. A single vaccination provided considerable protection that was enhanced by boosting for at least 4 months. Protection was related to the amount of mRNA inoculated, which correlated with neutralizing antibody levels. Furthermore, immunocompetent and immunodeficient mice lacking mature B and T cells that received serum from mRNA-immunized macaques before or after VACV challenge were protected. These findings provide insights into the mechanism and extent of mRNA vaccine-induced protection of orthopoxviruses and support clinical testing.


Conflict of interest statement

Competing interests: TF, AC, and AWF are employees of Moderna and may hold stock/stock options in the company. All other authors declare no competing interests.

Figures

Fig. 1
Fig. 1. Single immunization protects against intranasal infection.
A BALB/c mice were divided into 9 groups (n = 6 per group) and mock immunized with PBS or immunized with 107 PFU of MVA or 8 µg of mRNA. The mice were bled on day 0 and 21 prior to IN challenge with 104, 105, or 106 PFU of VACV WRvFire. B Anti-VACV MV neutralization titers expressed as NT50 of all animals receiving PBS, mRNA or MVA. Dots represent indivual animals, bars represent geometric mean titers. LOD, limit of detection. C Mice were weighed daily and % of starting weight and survival plotted for each group. Error bars represent standard error of the mean (SEM). D Luciferin was injected IP on days 2, 4, 7 and 11. Bioluminescence (BL) is depicted by a pseudocolor scale with red representing highest and blue lowest intensity. Each row represents an individual mouse imaged on successive days. E Photon flux was determined for head and body (chest and abdomen) region of interest (ROI). Geometric mean photon flux is indicated by bars. Significant differences between mRNA and MVA neutralization titers and photon flux for days 2 and 4 were evaluated by Mann–Whitney test. **p < 0.01, **** p < 0.0001.
Fig. 2
Fig. 2. Effects of single mRNA dose and interval before challenge on protection.
A Groups of BALB/c mice (n = 5) were vaccinated and challenged after 1 or 3 weeks with VACV via intranasal (IN) administration. B Anti-VACV MV neutralization titers expressed as NT50 determined 1 week after mock immunization with PBS or 8 µg of mRNA and 3 weeks after immunization with 0.5, 2.0, and 8 µg of mRNA. Individual animals represented by dots and geometric mean of the group represented by each bar. C Mice inoculated IN with 106 PFU of VACV WRvFire at 3 weeks after vaccination with 0.5, 2.0, or 8.0 µg of mRNA were weighed daily and percent of starting weight plotted. Error bars represent SEM. D Mice inoculated IN with 106 PFU of WRvFire at 1 week after vaccination with 8 µg of mRNA were weighed daily and percent of starting weight plotted. Error bars represent SEM. E Mice challenged at 3 weeks following vaccination were imaged following injection of luciferin on days 2, 4, 8, and 11. Bioluminescence is depicted by a pseudocolor scale with red highest and blue lowest intensity. Each row represents an individual mouse imaged on successive days. Photon flux was determined for head and body ROI for individual animals, with bar representing the geometric mean of each group. F Same as preceding panel except that mice vaccinated with 8 µg of mRNA and challenged after 1 week were imaged on days 2, 4, and 7. Significance for panels B and E were determined by Kruskal–Wallis test with Dunn’s post-hoc multiple comparisons and for panel F by Mann–Whitney test. *p < 0.05, **p < 0.01.
Fig. 3
Fig. 3. Enhanced protection after second immunization.
A BALB/c mice were divided into 6 groups (n = 6) and mock immunized with PBS or immunized with 107 PFU of MVA or 8 µg of mRNA on days 0 and 21 and challenged IN on weeks 3 and 16 with VACV WRvFire. B Anti-VACV MV neutralization titers for individual animals are expressed as NT50 with bars representing the geometric mean of each group. C Comet spread assay. Pooled serum diluted 1:50 was added to BS-C-1 cell monolayers at 1 h after infection with VACV strain IHD-J and stained with crystal violet after 48 h incubation at 37 °C. D Percent of starting weights and survival are shown as the mean of each group for each day with error bars representing SEM. E BL on days 2, 4, 7, and 10. Each row represents an individual mouse imaged on successive days. F Photon flux of head and body ROI for individual animals, with bar representing the mean of each group. Significance was evaluated by Kruskal–Wallis test with Dunn’s post-hoc multiple comparisons tests in panel (B) and by Mann–Whitney test in panel (F). **p < 0.01. ***p < 0.001, ****p < 0.0001.
Fig. 4
Fig. 4. Protection of CAST mice challenged intranasally and intraperitoneally with MPXV.
A Groups of CAST mice (n = 12) were primed and boosted with PBS, 107 PFU of MVA, or 1 or 4 µg of mRNA before challenge IN or IP with MPXV. B Anti-VACV MV neutralization titers expressed as NT50 for individual animals with bars representing the geometric mean of each group. C Anti-MPXV MV neutralization titers expressed as NT50 for individual animals with bars representing the geometric mean of each group. D Six mice from each group were challenged IN with 105 PFU of MPXV and survival determined as percentage of surviving mice on each day of study. E Six mice from each group were challenged IP with 104 PFU of MPXV and survival determined as percentage of surviving mice on each day of study. Significance for panels B and C were analyzed by Kruskal–Wallis with Dunn’s post-hoc multiple comparisons tests and for panels (D) and (E) by log-rank (Mantel–Cox) survival test. *p < 0.05, **p < 0.01, ***p < 0.001, ****p < 0.0001.
Fig. 5
Fig. 5. Protection from intrarectal and percutaneous infections.
A BL of mice (n = 5 per group) following intrarectal infection with 106 PFU of VACV WRvFire. Each row represents an individual mouse imaged on successive days. B Total photon flux of the rectal area for individual animals with bars representing the geometric mean of each group. C BL of mice (n = 5 per group) following percutaneous infection with 105 PFU of VACV WRvFire. D Total photon flux of the area around the tail for individual animals with bars representing the geometric mean of each group.
Fig. 6
Fig. 6. Immune serum protects against subsequent virus infection.
A Immunization and challenge scheme. Macaques were immunized by priming and boosting with PBS, ACAM2000, ACAM3000, or 15, 50, or 150 µg of mRNA vaccine. Pooled serum was injected IP into BALB/c mice (n = 5 per group) and one day later the mice were challenged with 105 PFU of VACV WRvFire. B Serum was obtained from mice 1 day post macaque serum transfer and 12 days post VACV challenge and the anti-VACV MV neutralization titer was determined for each animal with the bar representing the geometric mean of each group. C Mice were weighed daily following challenge and the mean of the group is reported each day with error bars representing SEM. Color key is same as in following panel. D Survival curves are shown for each group of mice with the percent surviving mice reported each day post challenge. E Relationship of weight loss to NT50 is plotted for each individual animal. R2 of 0.79 was determined by linear regression. F BL obtained on days indicated. Each row represents an individual mouse imaged on successive days. G Total photon flux was determined for head and body ROI for individual animals, with bar representing the geometric mean of each group. Signifcance was evaluated by Kruskal–Wallis test with Dunn’s post-hoc multiple comparisons tests. *p < 0.05, **p < 0.01, ***p < 0.001, ****p < 0.0001. Panel A was created in https://BioRender.com.
Fig. 7
Fig. 7. Immune serum protects against prior virus infection.
A Immunization and challenge scheme. Macaques were immunized by priming and boosting with PBS or 150 µg of mRNA with one month between doses and peak immune serum taken two weeks post boost. Mice (n = 5 per group) were infected IN with 105 PFU of VACV WRvFire and pooled macaque serum was inoculated IP one day later. B Individual mice were weighed daily following challenge with error bars representing SEM. C Survival curves are shown for each group of mice with the percent surviving mice reported each day post challenge. D BL obtained on days indicated. Each row represents an individual mouse imaged on successive days. E Total photon flux was determined for head and body ROI for individual animals, with bar representing the mean of each group. Significance was evaluated by Mann–Whitney test. **p < 0.01. Panel A was created in https://BioRender.com.
Fig. 8
Fig. 8. Immune serum protects immunodeficient Rag2 KO mice.
A Anti-VACV MV neutralization titers of serum from mice (n = 3) at 1 day after injection of macaque serum. Bars represent the geometric mean of each group. B Mice were challenged one day after receiving control or immune serum and weighed daily and the mean weight of the group is reported eact day with error bars representing SEM. C Survival curves are shown for each group of mice with the percent surviving mice reported each day post challenge. D BL shown for days indicated. Each row represents an individual mouse imaged on successive days. Non, non-immune; Im, Immune. E Total photon flux was determined for head and body ROI for individual animals, with bar representing the mean for each group. Significance was evaluated by Kruskal–Wallis with Dunn’s post-hoc multiple comparisons tests. *p < 0.05, ns, not significant.

Update of

References

    1. Satheshkumar, P. S. & Damon, I. in Fields Virology: DNA Viruses, Vol. 4 (eds Howley, P. M., Knipe, D. M., Cohen, J. L., & Damania, B. A.) Ch. 17, 614–640 (Lippincott Williams & Wilkins, 2021).
    1. Fenner, F., Henderson, D. A., Arita, I., Jezek, Z. & Ladnyi, I. D. Smallpox and its Eradication. 1st edn (World Health Organization, 1988).
    1. Rao, A. K. et al. Use of JYNNEOS (Smallpox and Monkeypox Vaccine, Live, Nonreplicating) for preexposure vaccination of persons at risk for occupational exposure to orthopoxviruses: recommendations of the advisory committee on immunization practices-United States, 2022. Morb. Mortal. Wkly. Rep.71, 734–742 (2022). - PMC - PubMed
    1. Deputy, N. P. et al. Vaccine effectiveness of JYNNEOS against Mpox disease in the United States. N. Engl. J. Med.10.1056/NEJMoa2215201 (2023). - PMC - PubMed
    1. Dalton, A. F. et al. Estimated effectiveness of JYNNEOS vaccine in preventing Mpox: a multijurisdictional case-control study - United States, August 19, 2022-March 31, 2023. Morb. Mortal. Wkly Rep.72, 553–558 (2023). - PMC - PubMed

LinkOut - more resources