. 2024 Dec 24;7(1):1696.
doi: 10.1038/s42003-024-07416-7.

An atlas of the shared genetic architecture between atopic and gastrointestinal diseases

Affiliations

An atlas of the shared genetic architecture between atopic and gastrointestinal diseases

Cancan Qi et al. Commun Biol. .

Abstract

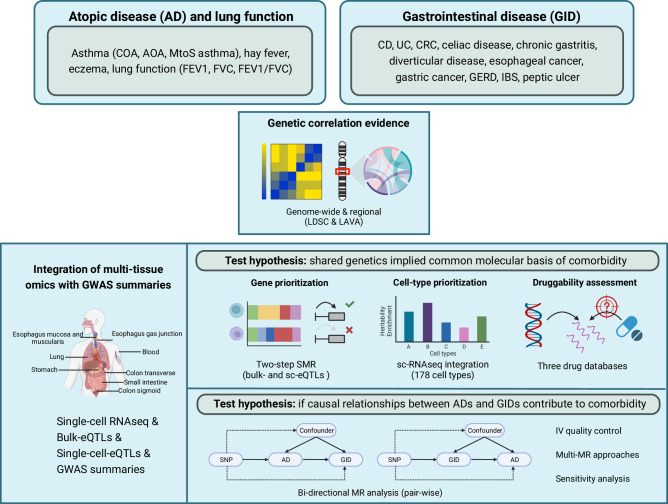
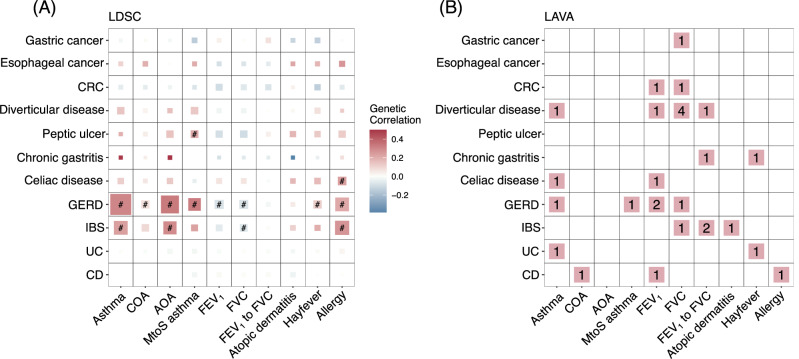
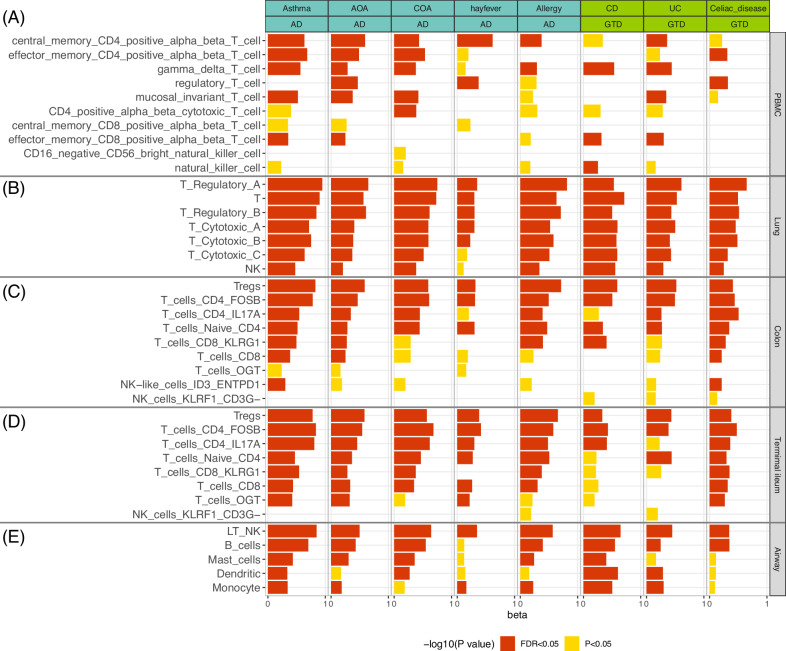
Comorbidity among atopic diseases (ADs) and gastrointestinal diseases (GIDs) has been repeatedly demonstrated by epidemiological studies, whereas the shared genetic liability remains largely unknown. Here we establish an atlas of the shared genetic architecture between 10 ADs or related traits and 11 GIDs, comprehensively investigating the comorbidity-associated genomic regions, cell types, genes and genetically predicted causality. Although distinct genetic correlations between AD-GID are observed, including 14 genome-wide and 28 regional correlations, genetic factors of Crohn's disease (CD), ulcerative colitis (UC), celiac disease and asthma subtypes are converged on CD4+ T cells consistently across relevant tissues. Fourteen genes are associated with comorbidities, with three genes are known treatment targets, showing probabilities for drug repurposing. Lower expressions of WDR18 and GPX4 in PBMC CD4+ T cells predict decreased risk of CD and asthma, which could be novel drug targets. MR unveils certain ADs led to higher risk of GIDs or vice versa. Taken together, here we show distinct genetic correlations between AD-GID pairs, but the correlated genomic loci converge on the dysregulation of CD4+ T cells. Inhibiting WDR18 and GPX4 expressions might be candidate therapeutic strategies for CD and asthma. Estimated causality indicates potential guidance for preventing comorbidity.


Conflict of interest statement

Competing interests: The authors declare no competing interest.

Figures

Fig. 1
Fig. 1. Schematic visualization of the study workflow.
The genetic correlations between 10 traits of ADs and 11 GIDs were first determined on both genome-wide level and genomic regional level by LDSC and LAVA, respectively. The subsequent analysis was conducted based on two hypotheses. (1) To detect if the shared genetic architecture between ADs and GIDs were converged on common cellular pathways, comorbidity-associated genes were prioritized using SMR in bulk-eQTLs data of nine tissues and sc-eQTL data from PBMC. Comorbidity-associated cell types were projected to single-cell RNAseq data from blood, gut, lung and airway tissues. Then the druggability of the prioritized genes were assessed in public drug databases. (2) To investigate the directional causality between AD-GID which might partially explain the comorbidities, multiple bi-directional MR approaches were incorporated, followed by a variety of sensitivity analysis. AD, atopic disease. GID, gastrointestinal diseases. LDSC, linkage disequilibrium score regression. LAVA, local analysis of [co]variant association. sc-eQTL, single cell expression quantitative trait loci. SMR, summary-data-based Mendelian Randomization. PBMC, peripheral blood mononuclear cells. COA, child-onset asthma. AOA, adult-onset asthma. MtoS asthma, Moderate-to-severe asthma. CD, Crohn’s disease. CRC, colorectal carcinoma. GERD, gastroesophageal reflux disease. UC, ulcerative colitis. IBS, irritable bowel syndrome. Created in BioRender. Hu, S. (2024) https://BioRender.com/q95x753.
Fig. 2
Fig. 2. Global and local genetic correlations between AD-GID.
A heatmap of 14 pairs of genome-wide significant correlations. # indicates significant signals with FDR < 0.05. The color represents the directionality of the correlation coefficients. B heatmap of 23 unique genomic regions which were correlated with at least one pair of AD-GID with FDR < 0.05. The numbers indicate the amount of genetically correlated loci. AOA adult-onset asthma, CD Crohn’s disease, COA childhood-onset asthma, CRC colorectal carcinoma, IBS irritable bowel syndrome, UC ulcerative colitis.
Fig. 3
Fig. 3. Candidate genes involved in AD-GID pairs predicted from bulk eQTLs demonstrate pleiotropic effects.
A dot plot showing the significant causal genes identified by SMR, using bulk eQTL analysis from different tissues (FDRsmr <0.05). Blue diamond-shaped dots represent negative effect size estimated from SMR while red dots represent positive relationships. B, C Representative examples of locus zoom plots. X-axis indicated the genomic positions and Y-axis indicated the –log (10) P-values representing the significance of GWAS of diseases and eQTLs. SC sigmoid colon, TC transverse colon, EGJ gastro-esophageal junction, EMa esophagea mucosa, Ems esophagus muscularis.
Fig. 4
Fig. 4. Disease-associated genetic loci converge on specific cell types across different tissues.
The CELLECT method was used to associate SNPs derived from GWAS summaries with 178 different cell types from four tissues (lung, airway, colon and terminal ileum). Panels AE demonstrate representative examples of shared cell type (T cells, B cells, NK cells, monocytes) enrichments across asthma, AOA, COA, hay fever, allergy, CD, UC and celiac disease in PBMCs and lung, airway and gut tissues (colon and terminal ileum). Red color indicated the significance at FDR  < 0.05 level while yellow indicates a more lenient threshold with nominal P < 0.05. Full summaries are presented in Supplementary Figs. 2–8 and Supplementary Data 6.
Fig. 5
Fig. 5. Candidate genes involved in both ADs and GIDs predicted from SMR-sc-eQTLs and druggablity investigation.
A Illustrative plot of SMR-identified five candidate genes presenting associations with ADs or GIDs or both, expressed in CD4+ T cells, CD8+ T cells, NK cells or monocytes. Solid lines indicated significance with FDR < 0.05 while dashed lines indicated a more lenient significance with nominal P < 0.05. B Schematic visualization of the overlaps between predicated candidate genes from bulk- and sc-eQTLs with three public drug targets databases, including DGIdb, DrugBank and OpenTargets. Duggable candidates were defined as the genes which were well-established drug targets.
Fig. 6
Fig. 6. Causal inference of AD-GID associations using bi-directional MR analysis.
A Schematic workflow of MR analysis (Methods), including IVs selection and quality controls, primary and complementary MR approaches, and sensitivity analysis. B A total of five unidirectional causal relationships with FDRIVW < 0.05 were identified, and one significant bi-directional causality between GERD and asthma (both directional FDRIVW < 0.05). All results shown passed quality control and sensitivity analysis. NS, non-significant.

References

    1. Dierick, B. J. H. et al. Burden and socioeconomics of asthma, allergic rhinitis, atopic dermatitis and food allergy. Expert Rev. Pharmacoecon Outcomes Res.20, 437–453 (2020). - PubMed
    1. Asher, M. I. et al. Worldwide time trends in the prevalence of symptoms of asthma, allergic rhinoconjunctivitis, and eczema in childhood: ISAAC Phases One and Three repeat multicountry cross-sectional surveys. Lancet (Lond., Engl.)368, 733–743 (2006). - PubMed
    1. Brew, B. K. et al. Paediatric asthma and non-allergic comorbidities: A review of current risk and proposed mechanisms. Clin. Exp. Allergy52, 1035–1047 (2022). - PMC - PubMed
    1. GBD 2015 Chronic Respiratory Disease Collaborators. Global, regional, and national deaths, prevalence, disability-adjusted life years, and years lived with disability for chronic obstructive pulmonary disease and asthma, 1990-2015: a systematic analysis for the Global Burden of Disease Study 2015. Lancet Respir. Med.5, 691–706 (2017). - PMC - PubMed
    1. Law, A. W., Reed, S. D., Sundy, J. S. & Schulman, K. A. Direct costs of allergic rhinitis in the United States: estimates from the 1996 Medical Expenditure Panel Survey. J. Allergy Clin. Immunol.111, 296–300 (2003). - PubMed

LinkOut - more resources